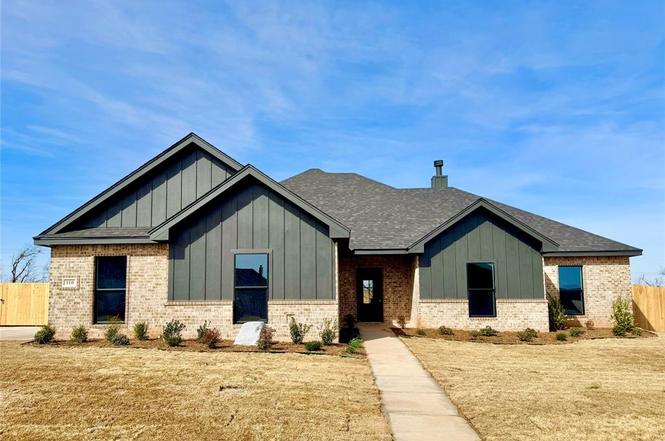
110 Pedernales · Abilene, TX
Flood risk 1/10 · Minimal
- FEMA flood zone
- X (unshaded)
- Chance of flooding over 30 yrs
- 0.0%
- Est. flood insurance / yr
- $507 – $1,088
Fire risk 6/10 · Moderate
- Est. fire insurance / yr
- $1,222 – $2,270
Heat risk 6/10 · Moderate
- Hot days now (above 103°F)
- 7 days/yr
- Hot days in 30 yrs
- 23 days/yr
Wind risk 4/10 · Minor
- Chance of severe wind over 30 yrs
- 18.0%
Air-quality risk 1/10 · Minimal
- Unhealthy air days now
- 0 days/yr
- Unhealthy air days in 30 yrs
- 0 days/yr
Risk factors via First Street. Map © Google.
Why this score? — see what drove the F grade
The composite is a weighted blend of 9 inputs, each scored 0–100. Each bar is that input's sub-score; the figure is the points it added to the 100-point composite (weight × sub-score).
- ARV discount +7.5/15.0
- Cash flow +6.7/30.0
- Schools +5.6/10.0
- Rent growth +5.0/5.0
- Livability +3.8/5.0
- Condition / age +2.5/5.0
- 1% rule +1.8/10.0
- DSCR +0.9/10.0
- Appreciation +0.0/10.0
$465,000
🖨 Deal sheet 📄 Offer letter ✓ Due diligence
Listing remarks
owner-agent - Stop what you're doing and take a look at this! This stunning new home in Headwaters is now complete, featuring 4 bedrooms and 2 bathrooms, equipped with all the modern conveniences. This home boasts a high cathedral ceiling, tile flooring, quartz countertops, upgraded appliances, and a beautifully landscaped front yard with a sprinkler system. Plus, the builder has included spray foam insulation in the walls for enhanced energy efficiency. Book an appointment to see this remarkable home today!
Key facts
- Quartz countertops
- Tile flooring
- Upgraded appliances
Tags
Property features AI
Finance
- Other: Special listing condition: Builder; Possession at closing/funding; All staging furniture and accessories excluded
- Financial info: Listing accepts Cash, Conventional, FHA, Texas Vet, and VA loans
- HOA & community: Mandatory HOA (Headwaters HOA); Annual association fee: $250 (includes management fees); HOA management phone available
Exterior
- Parking: Attached 2-car garage (approx. 20' wide x 24' deep); 2 covered parking spaces; garage faces side
- Security: Smoke detectors
- Utilities: Co-op electric; Co-op water; Curbs; Outside city limits / no city services; Not in a municipal utility district
- Home design: Single-family residence (attached: yes); One story; New construction completed in 2026; Deed and building restrictions; Subdivision: Headwaters Estates
- Construction: Brick and rock/stone exterior; Composition roof; Slab foundation; Year built: 2026 (new construction - complete)
- Exterior features: Covered patio/porch; Privacy wood fencing; Cleared lot/vegetation
Interior
- Kitchen: Kitchen island; Granite or natural stone counters; Walk-in pantry; Water line to refrigerator; Dishwasher; Disposal; Electric range; Microwave
- Bedrooms: 4 bedrooms (all on main level); Primary bedroom on main level with dual sinks, garden tub, separate shower, and walk-in closet
- Flooring: Tile flooring
- Bathrooms: 2 full bathrooms
- Heating & cooling: Central heating (electric); Fireplace provides supplemental heat; Central air; Ceiling fans
- Interior features: Decorative lighting; High-speed internet available; Kitchen island; Pantry; Walk-in closets; Fireplace (wood burning); One living area; One dining area; Room count: 8; Levels: One
- Laundry & utility: Laundry room with built-in cabinets; Full-size washer/dryer area; Washer hookup; Electric dryer hookup; Utility room
Neighborhood map
What this means for you Summary
Snapshot
- This is a 4-bed/2.0-bath land listed at $465k.
Deal economics
- At list price, monthly cash flow is $-745 ($-9k/yr) — negative.
- To cash-flow at today's rent, offer at most $357k (23.2% below list).
- To meet the 1% rule (rent ≥ 1% of price), the offer needs to be $315k (32.2% below list).
- Recommended offer: $315k (32.2% below list) — sets the bar for 1% rule.
- Cap rate 4.4% vs local median 6.7% in Abilene — below-typical yield; the buyer is paying a premium for something (appreciation thesis, condition, location) that the cap rate doesn't capture.
Location & tenants
- Location reads 75/100 on livability (#142 in TX, #4,037 nationally) — a middle-class / working-renter tenant base. Strengths: cost of living A+, housing A+, health & safety A+; Watch: crime D, commute F.
- Wylie ISD (rural): math 63% / reading 62% proficiency, ranked #32 of 826 in TX (top 4%) — acceptable for families but not a draw, mixed tenant base, ~2y average lease; only 17% free/reduced lunch — higher-income household profile.
- Zoned schools: Wylie West El (428 students, 21% FRL) — zoned schools at 21% FRL track the district average.
- Market conditions: Rents rising fast (+40.7%/yr); 288 active listings in the ZIP; 11 comparable units currently listed for rent nearby; rentals leasing fast (median 7d on market — plan ~1-2 weeks tenant-placement turnaround); solid renter incomes; 508 units permitted in Taylor County in 2024 (0 in 5+ unit buildings).
- At $3,151/mo this rent would consume 48% of the median local household income ($79k/yr) (locally 1181% of renters already pay >50% of income on rent) — very limited rent-growth headroom before tenants either downsize or default.
Forward outlook
- Local home prices are declining (-3.0%/yr); year-one equity from $3k of loan paydown is wiped out by about $14k of value loss. Plan a longer hold.
- Taylor County population projected at +16% by 2050 — long-run rental-demand tailwind backs the buy-and-hold thesis.
Negotiation context
- It's been on market 79 days — a 6% lower offer ($437k) is reasonable based on typical stale-listing flexibility.
- 2 sale attempts with the ask held roughly flat each time — persistent listings suggest the price (not the market) is what's stuck; bring a comps-based counter.
Risks & watch-outs
- Climate carrying-cost: major wildfire risk; extreme-heat days projected 7→23/yr by 2055 (HVAC capex compounding) — expect insurance premiums to compound above CPI over the hold.
Questions for the listing agent
- What do current leases actually rent for vs. the listed asking? Can we see a recent rent roll and the last 12 months of T-12 income?
- It's been on market 79 days. Have you received any prior offers? Is the seller open to a 32% concession, seller financing, or rate buy-down credit?
- What does the HOA fee cover, when was the last increase, and are there any pending special assessments or reserve-fund shortfalls?
- Why hasn't it sold? Are there any deal-killer items the seller is aware of (foundation, flood, title, zoning, code violations)?
- Is there a deadline driving the sale (1031 exchange, divorce, estate, relocation)? That informs how much negotiation room exists.
- Schools are D-rated, which usually means shorter tenancies and higher turnover. Who's the typical renter profile here, and what's been the actual vacancy rate?
- Crime grade is D in this area — have there been break-ins, vandalism, or insurance claims at this property in the last 3 years? What carrier currently insures it and at what premium?
- The area grade is low — what's the realistic commute time and amenity access for the typical tenant pool here? Any planned neighborhood developments (good or bad) we should know about?
- What's the average days-on-market for RENTAL listings here right now (not sales)? A rising rental-DOM trend means longer vacancies and softer asking-rent achievability than the comps imply.
- What's the recent tenant-quality profile in this submarket — average credit score on applications, eviction rate, late-payment / NSF rate, and stable-employment percentage? A property-management company in the area should have these aggregated.
- How much new for-sale + rental construction is in the pipeline within 1–3 miles? Heavy new supply typically softens prices + rents 12–24 months out; constrained supply supports both.
Investment metrics
- 1% rule
- 0.68% ✗
- Cap rate
- 4.37%
- Cash-on-cash
- -6.87%
- DSCR
- 0.69
- GRM
- 12.3
CMA / ARV
No comps found within radius.
Projected returns pro-forma
-3.0% appreciation · 8.0% rent growth · sell at horizon
- IRR
- -22.8%
- Equity multiple
- 0.19×
- Total profit
- $-106,076
- Equity at exit
- $69,333
- IRR
- -7.8%
- Equity multiple
- 0.41×
- Total profit
- $-77,410
- Equity at exit
- $40,205
Cash invested: $130,200 (down + closing). Projections, not guarantees.
Landlord ↔ Tenant lean methodology
- Overall (STATE)
- 87 Strongly Landlord-Friendly
- State Texas
- 87 Strongly Landlord-Friendly · R+5
- County
- — inherits STATE
- City
- — inherits STATE
ZIP-level market 79606
- Rents YoY
- 40.7%
- Active inventory
- 288
- Price-to-rent
- 12.3×
Monthly cashflow live
- Estimated rent
- $3,151 high interval (Pro) →
- Mortgage (P&I)
- −$2,439
- Tax est. 1.5%
- −$581 /mo · $6,975/yr
- Insurance
- −$194
- HOA
- −$21
- Vacancy / Maint / Mgmt
- −$662
- Net cashflow
- $-745
Break-even live
UW: 25.0% down · 7.5% · 30yr · 1.5% tax · 5.0% vac · 8.0% maint · 8.0% mgmt
Financing live
Cash to close
- Down payment
- $116,250
- Closing costs
- $13,950
- Reserves months
- —
- Total cash needed
- —
Loan-product check · same deal, 3 products live
Conventional
25% down · 7.5% · 30yr
- Down + closing
- —
- Monthly P&I
- —
- Monthly cashflow
- —
- DSCR
- —
- Eligible?
- —
Personal DTI + credit; lowest rate.
DSCR
20% down · 8.5% · 30yr
- Down + closing
- —
- Monthly P&I
- —
- Monthly cashflow
- —
- DSCR
- —
- Eligible?
- —
No personal income docs; deal must DSCR.
Hard money
10% down · 12.0% · 12mo
- Down + closing
- —
- Monthly P&I
- —
- Monthly cashflow
- —
- DSCR
- —
- Eligible?
- —
Short-term bridge; refi at stabilization.
Rent comps 11 comps
| Address | Beds | Baths | Sqft | Rent | $/sqft | DOM | Units | Dist |
|---|---|---|---|---|---|---|---|---|
| 134 Pedernales Unit 136 Abilene, TX | 3.0 | 2.0 | 2798 | $2,995 | $1.07 | 20d | 1 | 0.16mi |
| 4426 Sierra Sunset Abilene, TX | 4.0 | 3.0 | 2697 | $4,500 | $1.67 | 43d | 1 | 0.64mi |
| 7933 Hearne Dr Abilene, TX | 3.0 | 2.0 | 1542 | $2,695 | $1.75 | 13d | 1 | 0.93mi |
| 4742 Kevin Ct Abilene, TX | 3.0 | 2.0 | 1630 | $3,400 | $2.09 | 5d | 1 | 0.95mi |
| 8345 South Rdg Abilene, TX | 4.0 | 2.5 | 2300 | $4,000 | $1.74 | 7d | 1 | 1.10mi |
| 7534 John Carroll Dr Abilene, TX | 4.0 | 2.0 | 1984 | $2,795 | $1.41 | 3d | 1 | 1.22mi |
| 7601 Thompson Pkwy Abilene, TX | 4.0 | 2.0 | 1495 | $2,795 | $1.87 | 13d | 1 | 1.25mi |
| 5133 Bridle Path Ln Abilene, TX | 3.0 | 2.0 | 1618 | $2,595 | $1.60 | 2d | 1 | 1.28mi |
| 5409 Wagon Wheel Ave Abilene, TX | 3.0 | 2.0 | 1706 | $2,795 | $1.64 | 13d | 1 | 1.31mi |
| 5180 Western Plains Ave Abilene, TX | 3.0 | 2.0 | 1718 | $2,500 | $1.46 | 5d | 1 | 1.38mi |
| 5280 Western Plains Ave Abilene, TX | 3.0 | 2.0 | 1810 | $3,095 | $1.71 | 5d | 1 | 1.43mi |
HOA detail
- Monthly dues
- $21 · $252/yr
- Likely covers
- water
Listing history 6 events
-
2026-05-09status Pending
-
2026-04-29status Active
-
2026-03-11status Pending
-
2026-03-11price $459,900
-
2026-03-11price $465,000
-
2026-01-01$459,000 Active
ⓘ Source: listings_history table (triggers on properties + properties_extension) + one-shot
backfill from property_details.listing_events for pre-trigger history.
Climate risk First Street
- Flood 1/10 Low FEMA zone X (unshaded) · 0% chance over 30 yrs
- Wildfire 6/10 Major
- Heat 6/10 Major 7 d/yr ≥103°F today · 23 d/yr by 30 yrs out
- Wind 4/10 Moderate 18% chance of damaging wind over 30 yrs
- Air quality 1/10 Low 0 unhealthy d/yr today · 0 by 30 yrs out
Nearby sold comps map
Loading sold comps map…
Walkable amenities ~0.75 mi
Loading nearby amenities…
Taxation est. · year 1
- Rental income
- $37,817
- − Mortgage interest
- −$26,047
- − Property taxes
- −$6,975
- − Insurance
- −$2,325
- − Repairs & maintenance
- −$3,025
- − Management
- −$3,025
- − HOA
- −$252
- − Depreciation
- −$13,527
- Taxable loss
- −$17,360
- Est. tax savings @ 24.0%
- +$4,166
- After-tax cash flow
- $-4,772/yr
For passive investors: Depreciation is non-cash, so a rental often shows a tax loss while cash-flowing — sheltering income. Rental losses are passive: they offset passive income freely, and up to $25,000/yr can offset ordinary (W-2) income if you actively participate and your MAGI is under $100k (phasing out to $0 by $150k); unused losses carry forward. On sale, claimed depreciation is recaptured at up to 25%, and gains may owe capital-gains tax (a 1031 exchange can defer both). Figures are a year-1 estimate at your 24.0% rate — not tax advice; consult a CPA.
Schools (NCES district)
- District
- Wylie ISD
- NCES district ID
- 4846500
- Math proficiency
- 63% ▼ -12.00%
- Reading proficiency
- 62% ▼ -4.00%
- Median HH income
- $78,248
- Composite
- 55.86/100
- National rank
- #1206
- State rank
- #32 of 826 in TX
Livability — Abilene
- Score
- 75/100
- State rank
- #142
- US rank
- #4037
Category grades
Schools grade is shown separately in the Schools card above.
Census & demographics
- County
- Taylor County · 136,672 people
- City population
- 136,672
- Metro
- Abilene, TX
- Population (ZIP)
- 29,182
- Household income
- $79,196
- Rent vs Own
- Severe rent burden
- 1181.0
Population outlook (Taylor County) Hauer SSP2
- Today (2025)
- 145,270 people
- By 2030
- 150,050 · +3.3%
- By 2040
- 159,417 · +9.7%
- By 2050
- 168,883 · +16.3%
- By 2075
- 194,436 · +33.8%
- By 2100
- 203,163 · +39.9%
Race, ethnicity, and origin ACS 2023
- Neighborhood character
- Predominantly White (69%)
- Race & ethnicity
- White 69% Hispanic / Latino 19% Two or more races 11% Black 6% Asian 4%
- Hispanic origin (detail)
- Mexican 14%
- Common ancestry
- Italian 4% Slovak 2% Serbian 1%
- Foreign-born
- 7% · Canada, Vietnam
- Languages at home
- 86% English-only · Spanish 10% Tagalog/Filipino 1% Other Indo-European 1%
Political lean MEDSL · Taylor
- 2024 margin
- Solid R (+49.8) · D 24.6% · R 74.4% · Other 1.0%
- 2008→2024 swing
- -4.2pp toward R · 2008: -45.6pp · 2024: -49.8pp
- All cycles
- 2024: R+49.8 2020: R+45.3 2016: R+51.1 2012: R+53.6 2008: R+45.6
Not yet ingested
- Civics
- —
Market trends
- HPI YoY
- ▼ -167.33%
- Current HPI
- 179.2555
- Rent YoY
- ▲ 40.73%
- Metro
- Abilene, TX
- State GDP YoY
- ▲ 3.95%
- F500 in state
- 110
Industry mix (Fortune 500 HQ in TX)
| Industry | F500 HQs | Revenue |
|---|---|---|
| Energy | 16 | $1,198B |
|
||
| Technology | 5 | $198B |
|
||
| Engineering / Construction | 4 | $72B |
|
||
| Energy Services | 3 | $60B |
|
||
| Utilities | 3 | $41B |
|
||
| Healthcare | 2 | $330B |
|
||
Price history
+1.3% since first listed6 events — show timeline
- 2026-05-09 Pending — NTREIS
- 2026-04-29 Relisted — NTREIS
- 2026-03-11 Pending — NTREIS
- 2026-03-11 Price Changed $465,000 NTREIS
- 2026-03-11 Price Changed $459,900 NTREIS
- 2026-01-01 Listed $459,000 NTREIS
Property tax history
+22.7%/yrLatest (2025): $854 · +0.5% YoY. Source: county tax records.
Cash-flow waterfall
monthlySold comps — $/sqft
last 12 mo · ≤1 miLoading sold comps…