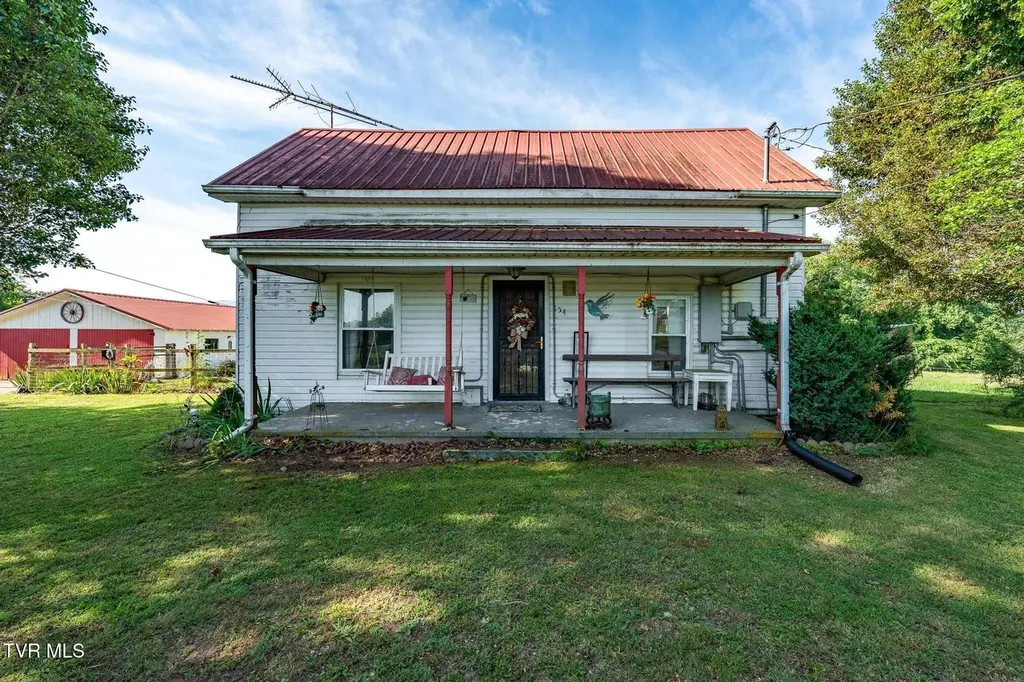
154 Stockton Rd · Tusculum, TN
Flood risk 1/10 · Minimal
- FEMA flood zone
- X (unshaded)
- Chance of flooding over 30 yrs
- 0.0%
- Est. flood insurance / yr
- $507 – $1,088
Fire risk 6/10 · Moderate
- Est. fire insurance / yr
- $949 – $1,763
Heat risk 4/10 · Minor
- Hot days now (above 100°F)
- 7 days/yr
- Hot days in 30 yrs
- 20 days/yr
Wind risk 2/10 · Minimal
- Chance of severe wind over 30 yrs
- —
Air-quality risk 2/10 · Minimal
- Unhealthy air days now
- 1 days/yr
- Unhealthy air days in 30 yrs
- 2 days/yr
Risk factors via First Street. Map © Google.
Why this score? — see what drove the D+ grade
The composite is a weighted blend of 9 inputs, each scored 0–100. Each bar is that input's sub-score; the figure is the points it added to the 100-point composite (weight × sub-score).
- Cash flow +11.8/30.0
- ARV discount +11.8/15.0
- Appreciation +7.1/10.0
- DSCR +3.5/10.0
- Livability +3.3/5.0
- Rent growth +2.5/5.0
- Condition / age +2.5/5.0
- 1% rule +2.1/10.0
- Schools +2.1/10.0
$199,900
🖨 Deal sheet 📄 Offer letter ✓ Due diligence
Listing remarks MLS
A nice two story home with 3 bedrooms and 1 bath with a detached 2 car garage on 1.07 acres. Home has a metal roof, covered front and rear porches, and a shed on property for storage. There is also a concrete driveway and sidewalk, heat pump, and beautiful mountain views.
Key facts
- New step in shower
- New dishwasher
- Detached garage
Tags
Property features AI
Finance
- Other: Zoned A-1; Topography: level to sloped
Exterior
- Parking: Detached concrete garage with 2 spaces
- Utilities: Private water, public water available, and well; Septic tank; Electricity connected; Water available
- Home design: Single-family house; One level
- Construction: Wood siding; Metal roof; Slab foundation; Built as a house
- Exterior features: Front porch; Rear porch; Back yard fencing; Poultry coop; Shed(s); Has a view
Interior
- Kitchen: Dishwasher; Range; Refrigerator
- Bathrooms: 1 full bathroom
- Heating & cooling: Central heating; Heat pump; Central air; Wall unit(s); Window unit(s)
- Interior features: See remarks; Finished basement; Total of 5 rooms
- Laundry & utility: Washer hookup; Electric dryer hookup
Neighborhood map
What this means for you Summary
Snapshot
- This is a 3-bed/1.0-bath single-family listed at $200k.
Deal economics
- At list price, monthly cash flow is $-55 ($-657/yr) — negative.
- To cash-flow at today's rent, offer at most $190k (4.8% below list).
- To meet the 1% rule (rent ≥ 1% of price), the offer needs to be $142k (28.8% below list).
- Recommended offer: $142k (28.8% below list) — sets the bar for 1% rule.
Location & tenants
- Location reads 66/100 on livability (#113 in TN) — a middle-class / working-renter tenant base. Strengths: crime A+, cost of living A+, housing A+; Watch: amenities F, commute F, health & safety F.
- Greene County (rural): math 27% / reading 24% proficiency, ranked #83 of 139 in TN (top 60%) — low school quality limits family demand, transient renter base, plan for 1-2y turnover.
- Zoned schools: Chuckey Elementary (math 32% / reading 27%, grade F, #423 of 952 statewide, top 48%, 354 students, 0% FRL); Chuckey Doak Middle School (math 41% / reading 25%, grade F, #77 of 333 statewide, top 24%, 388 students, 0% FRL); Chuckey Doak High School (math 22% / reading 42%, grade F, #56 of 332 statewide, top 20%, 592 students, 0% FRL) — zoned schools average 0% FRL vs 58% district-wide (58 pts lower); this property's tenant base skews higher-income than the district average.
- Market conditions: 59 active listings in the ZIP; 333 units permitted in Greene County in 2024 (72 in 5+ unit buildings).
Forward outlook
- In year one you build about $10k of equity ($1k loan paydown + $9k appreciation (4.3% local appreciation)).
- Greene County population projected to shrink 8% by 2050 — rents likely to lag national; underwrite the cash flow, not the appreciation.
- At projected returns (4.3% appreciation + 3.0% rent growth), your $56k cash investment doubles in ~6 years — after that, you're playing with house money.
- By year 4, paydown + projected appreciation supports a ~$34k cash-out refi (75% LTV) — recoverable capital for the next deal without selling this one.
Negotiation context
- Only 8 days on market — expect competitive offers; lowballing is unlikely to land.
- 3 sale attempts since 12y ago with the ask held roughly flat each time — persistent listings suggest the price (not the market) is what's stuck; bring a comps-based counter.
- Current owner paid $50k; list at $200k implies a 300% gain — meaningful room to come down on a strong offer.
Risks & watch-outs
- Watch-outs: built in 1940 — expect roof / HVAC / electrical / plumbing capex.
- Climate carrying-cost: major wildfire risk — expect insurance premiums to compound above CPI over the hold.
Questions for the listing agent
- What do current leases actually rent for vs. the listed asking? Can we see a recent rent roll and the last 12 months of T-12 income?
- Built in 1940 — when were the roof, HVAC, electrical panel, plumbing, and water heater last replaced?
- Is there a deadline driving the sale (1031 exchange, divorce, estate, relocation)? That informs how much negotiation room exists.
- Schools are F-rated, which usually means shorter tenancies and higher turnover. Who's the typical renter profile here, and what's been the actual vacancy rate?
- The area grade is low — what's the realistic commute time and amenity access for the typical tenant pool here? Any planned neighborhood developments (good or bad) we should know about?
- What's the average days-on-market for RENTAL listings here right now (not sales)? A rising rental-DOM trend means longer vacancies and softer asking-rent achievability than the comps imply.
- What's the recent tenant-quality profile in this submarket — average credit score on applications, eviction rate, late-payment / NSF rate, and stable-employment percentage? A property-management company in the area should have these aggregated.
- How much new for-sale + rental construction is in the pipeline within 1–3 miles? Heavy new supply typically softens prices + rents 12–24 months out; constrained supply supports both.
Investment metrics
- 1% rule
- 0.71% ✗
- Cap rate
- 5.96%
- Cash-on-cash
- -1.17%
- DSCR
- 0.95
- GRM
- 11.7
CMA / ARV
- ARV (on-the-fly)
- $220,860
- Comps found
- 1
Show comp detail 1 sale within ~0.75 mi
| Address | Dist | Beds/Ba | Sqft | Sold | Price | $/sf | Match |
|---|---|---|---|---|---|---|---|
| 228 Mae Mckee Rd | 0.50mi | 3/1.0 | 1,055 (-14%) | 13mo | $189,700 | $180 | 43 |
Match score weights: distance 35% · size 25% · config 20% · recency 20%. Top-matched comps best support the ARV.
Projected returns pro-forma
4.29% appreciation · 3.0% rent growth · sell at horizon
- IRR
- 10.0%
- Equity multiple
- 1.62×
- Total profit
- $34,481
- Equity at exit
- $104,768
- IRR
- 11.7%
- Equity multiple
- 2.99×
- Total profit
- $111,202
- Equity at exit
- $174,141
Cash invested: $55,972 (down + closing). Projections, not guarantees.
Landlord ↔ Tenant lean methodology
- Overall (STATE)
- 87 Strongly Landlord-Friendly
- State Tennessee
- 87 Strongly Landlord-Friendly · R+13
- County
- — inherits STATE
- City
- — inherits STATE
ZIP-level market 37641
- Home prices YoY
- 1.4%
- Active inventory
- 59
- Price-to-rent
- 11.7×
Monthly cashflow live
- Estimated rent
- $1,424 medium interval (Pro) →
- Mortgage (P&I)
- −$1,048
- Tax from tax record
- −$48 /mo · $573/yr
- Insurance
- −$83
- HOA
- −$0
- Vacancy / Maint / Mgmt
- −$299
- Net cashflow
- $-55
Break-even live
UW: 25.0% down · 7.5% · 30yr · 1.5% tax · 5.0% vac · 8.0% maint · 8.0% mgmt
Financing live
Cash to close
- Down payment
- $49,975
- Closing costs
- $5,997
- Reserves months
- —
- Total cash needed
- —
Loan-product check · same deal, 3 products live
Conventional
25% down · 7.5% · 30yr
- Down + closing
- —
- Monthly P&I
- —
- Monthly cashflow
- —
- DSCR
- —
- Eligible?
- —
Personal DTI + credit; lowest rate.
DSCR
20% down · 8.5% · 30yr
- Down + closing
- —
- Monthly P&I
- —
- Monthly cashflow
- —
- DSCR
- —
- Eligible?
- —
No personal income docs; deal must DSCR.
Hard money
10% down · 12.0% · 12mo
- Down + closing
- —
- Monthly P&I
- —
- Monthly cashflow
- —
- DSCR
- —
- Eligible?
- —
Short-term bridge; refi at stabilization.
Listing history 7 events
-
2026-06-12status $199,900 Pending 8 DOM
-
2026-06-09days on market $199,900 Active 8 DOM
-
2026-06-08days on market $199,900 Active 7 DOM
-
2026-06-07days on market $199,900 Active 6 DOM
-
2026-06-05days on market $199,900 Active 3 DOM
-
2026-06-02remarks 699-char remark
-
2026-06-02$199,900 Active 1 DOM
ⓘ Source: listings_history table (triggers on properties + properties_extension) + one-shot
backfill from property_details.listing_events for pre-trigger history.
Tax reassessment forecast TN · Resets to sale price
- Current annual tax
- $573 · $48/mo
- Projected year-2 tax
- $1,419 · $118/mo
- Expected delta
- +$846/yr (+$71/mo · 147.7%)
ⓘ Screening estimate from a state-policy table — verify with the county assessor before closing.
Climate risk First Street
- Flood 1/10 Low FEMA zone X (unshaded) · 0% chance over 30 yrs
- Wildfire 6/10 Major
- Heat 4/10 Moderate 7 d/yr ≥100°F today · 20 d/yr by 30 yrs out
- Wind 2/10 Low
- Air quality 2/10 Low 1 unhealthy d/yr today · 2 by 30 yrs out
Nearby sold comps map
Loading sold comps map…
Walkable amenities ~0.75 mi
Loading nearby amenities…
Taxation est. · year 1
- Rental income
- $17,082
- − Mortgage interest
- −$11,198
- − Property taxes
- −$573
- − Insurance
- −$1,000
- − Repairs & maintenance
- −$1,367
- − Management
- −$1,367
- − Depreciation
- −$5,815
- Taxable loss
- −$4,236
- Est. tax savings @ 24.0%
- +$1,017
- After-tax cash flow
- $359/yr
For passive investors: Depreciation is non-cash, so a rental often shows a tax loss while cash-flowing — sheltering income. Rental losses are passive: they offset passive income freely, and up to $25,000/yr can offset ordinary (W-2) income if you actively participate and your MAGI is under $100k (phasing out to $0 by $150k); unused losses carry forward. On sale, claimed depreciation is recaptured at up to 25%, and gains may owe capital-gains tax (a 1031 exchange can defer both). Figures are a year-1 estimate at your 24.0% rate — not tax advice; consult a CPA.
Schools (NCES district)
- District
- Greene County
- NCES district ID
- 4701470
- Math proficiency
- 27% ▼ -14.00%
- Reading proficiency
- 24% ▼ -7.00%
- Median HH income
- $37,517
- Composite
- 21.3/100
- National rank
- #8388
- State rank
- #83 of 139 in TN
Livability — Tusculum
- Score
- 66/100
- State rank
- #113
- US rank
- #11305
Category grades
Schools grade is shown separately in the Schools card above.
Census & demographics
- Population (ZIP)
- 9,110
Population outlook (Greene County) Hauer SSP2
- Today (2025)
- 68,624 people
- By 2030
- 68,114 · -0.7%
- By 2040
- 66,167 · -3.6%
- By 2050
- 63,038 · -8.1%
- By 2075
- 55,274 · -19.5%
- By 2100
- 45,527 · -33.7%
Race, ethnicity, and origin ACS 2023
- Neighborhood character
- Predominantly White (98%)
- Race & ethnicity
- White 98% Two or more races 1%
- Common ancestry
- Serbian 2% Slovak 2% Lithuanian 1%
- Foreign-born
- 1%
Political lean MEDSL · Greene
- 2024 margin
- Solid R (+65.7) · D 16.6% · R 82.3% · Other 1.2%
- 2008→2024 swing
- -25.0pp toward R · 2008: -40.7pp · 2024: -65.7pp
- All cycles
- 2024: R+65.7 2020: R+60.7 2016: R+61.0 2012: R+46.0 2008: R+40.7
Not yet ingested
- Civics
- —
Market trends
- HPI YoY
- ▲ 4.29%
- Current HPI
- 321.5562
- Rent YoY
- —
- Metro
- —
- State GDP YoY
- ▲ 2.78%
- F500 in state
- 22
Industry mix (Fortune 500 HQ in TN)
| Industry | F500 HQs | Revenue |
|---|---|---|
| Healthcare | 3 | $91B |
|
||
| Retail | 3 | $72B |
|
||
| Transportation / Logistics | 1 | $88B |
|
||
| Paper / Packaging | 1 | $19B |
|
||
| Insurance | 1 | $13B |
|
||
| Energy | 1 | $12B |
|
||
Price history
+151.4% since first listed7 events — show timeline
- 2026-05-31 Listed $199,900 TVRMLS
- 2016-03-17 Sold (Public Records) $50,000 Public Records
- 2016-03-11 Sold (MLS) $50,000 TVRMLS
- 2016-01-19 Listed $52,000 TVRMLS
- 2015-02-12 Sold (Public Records) $76,000 Public Records
- 2015-02-11 Sold (MLS) $76,000 TVRMLS
- 2014-12-01 Listed $79,500 TVRMLS
Property tax history
+6.0%/yrLatest (2025): $573 · +0.0% YoY. Source: county tax records.
Cash-flow waterfall
monthlySold comps — $/sqft
last 12 mo · ≤1 miLoading sold comps…