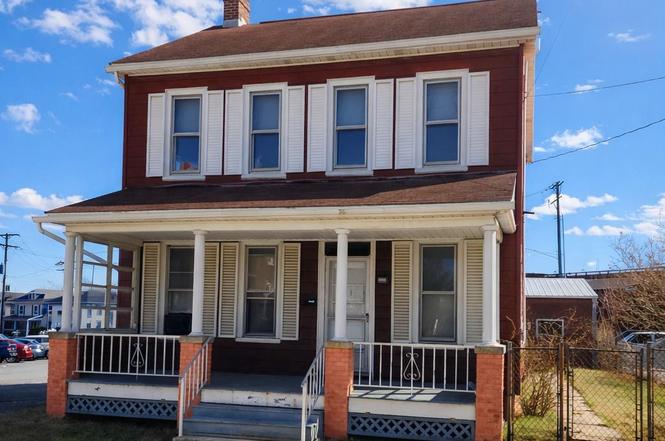
33 George St · Hanover, PA
Flood risk 1/10 · Minimal
- FEMA flood zone
- X (unshaded)
- Chance of flooding over 30 yrs
- 0.0%
- Est. flood insurance / yr
- $473 – $860
Fire risk 1/10 · Minimal
- Est. fire insurance / yr
- $511 – $949
Heat risk 6/10 · Moderate
- Hot days now (above 102°F)
- 7 days/yr
- Hot days in 30 yrs
- 16 days/yr
Wind risk 3/10 · Minor
- Chance of severe wind over 30 yrs
- 7.0%
Air-quality risk 2/10 · Minimal
- Unhealthy air days now
- 1 days/yr
- Unhealthy air days in 30 yrs
- 3 days/yr
Risk factors via First Street. Map © Google.
Why this score? — see what drove the B grade
The composite is a weighted blend of 9 inputs, each scored 0–100. Each bar is that input's sub-score; the figure is the points it added to the 100-point composite (weight × sub-score).
- Cash flow +30.0/30.0
- 1% rule +10.0/10.0
- DSCR +10.0/10.0
- ARV discount +7.5/15.0
- Livability +3.8/5.0
- Rent growth +3.7/5.0
- Schools +3.7/10.0
- Condition / age +2.5/5.0
- Appreciation +0.0/10.0
$119,900
🖨 Deal sheet (PDF) 📄 Offer letter ✓ Due diligence
Listing remarks
An excellent investment opportunity awaits with this 4-bedroom home ideally located within walking distance to the hospital. Offering over 1,300 square feet of living space, this two-story traditional home retains much of its original character, including beautiful original woodwork and generously sized rooms throughout. The exterior is in fair condition, while the interior will require a complete restoration—making this a prime opportunity for investors, contractors, or buyers looking to bring new life to a classic home. A sizable detached two-car garage provides additional flexibility and potential for storage, workshop space, or future use. CASH ONLY. Agents are encouraged to revie
Key facts
- Original woodwork
- 4,779 sq ft lot
- 2 garage spots
Tags
Neighborhood map
What this means for you Summary
Snapshot
- This is a 4-bed/1.5-bath single-family listed at $120k.
Deal economics
- At list price, monthly cash flow is $469 ($6k/yr) — positive.
- The deal already cash-flows at list — no discount required.
- Meets the 1% rule at list price ($2k rent vs $120k).
- Cap rate 11.0% vs local median 3.9% in Hanover — top-decile yield for the area; either an underpriced asset or a hidden risk that comps aren't pricing in. Stress-test before assuming the spread holds.
Location & tenants
- Location reads 76/100 on livability (#373 in PA, #3,295 nationally) — a middle-class / working-renter tenant base. Strengths: cost of living A+, housing A+, health & safety A+; Watch: amenities C-, employment D, commute F.
- Hanover Public SD (urban): math 34% / reading 54% proficiency, ranked #294 of 539 in PA (top 54%) — families likely to look elsewhere, expect single-tenant / working-renter base with shorter leases.
- Market conditions: Rents rising fast (+4.7%/yr); 386 active listings in the ZIP; 17 comparable units currently listed for rent nearby; rentals lingering (median 45d on market — plan ~5-8 weeks vacancy on turnover, expect pricing pressure); 59% of comp listings sitting > 30 days — soft ceiling on asking rent; solid renter incomes; 1,328 units permitted in York County in 2024 (338 in 5+ unit buildings).
Forward outlook
- Local home prices are declining (-3.0%/yr); year-one equity from $829 of loan paydown is wiped out by about $4k of value loss. Plan a longer hold.
- At projected returns (-3.0% appreciation + 4.7% rent growth), your $34k cash investment doubles in ~7 years — after that, you're playing with house money.
Negotiation context
- Only 13 days on market — expect competitive offers; lowballing is unlikely to land.
Risks & watch-outs
- Watch-outs: property tax is 3.0% of price; built in 1920 — expect roof / HVAC / electrical / plumbing capex.
- Climate carrying-cost: extreme-heat days projected 7→16/yr by 2055 (HVAC capex compounding) — expect insurance premiums to compound above CPI over the hold.
Questions for the listing agent
- Built in 1920 — when were the roof, HVAC, electrical panel, plumbing, and water heater last replaced?
- Property tax is high relative to price — has the assessment been appealed recently, and will the sale trigger a re-assessment?
- Is there a deadline driving the sale (1031 exchange, divorce, estate, relocation)? That informs how much negotiation room exists.
- What's the average days-on-market for RENTAL listings here right now (not sales)? A rising rental-DOM trend means longer vacancies and softer asking-rent achievability than the comps imply.
- What's the recent tenant-quality profile in this submarket — average credit score on applications, eviction rate, late-payment / NSF rate, and stable-employment percentage? A property-management company in the area should have these aggregated.
- How much new for-sale + rental construction is in the pipeline within 1–3 miles? Heavy new supply typically softens prices + rents 12–24 months out; constrained supply supports both.
Investment metrics
- 1% rule
- 1.53% ✓
- Cap rate
- 10.98%
- Cash-on-cash
- 16.75%
- DSCR
- 1.75
- GRM
- 5.5
CMA / ARV
- ARV (on-the-fly)
- $242,208
- Comps found
- 12
Show comp detail 12 sales within ~0.75 mi
| Address | Dist | Beds/Ba | Sqft | Sold | Price | $/sf | Match |
|---|---|---|---|---|---|---|---|
| 19 Fulton St | 0.18mi | 4/1.5 | 1,502 (+8%) | 6mo | $195,000 | $130 | 73 |
| 632 E Walnut St | 0.39mi | 4/2.0 | 1,328 (-5%) | 4mo | $256,000 | $193 | 69 |
| 26 Ridge Ave | 0.39mi | 3/1.5 (-1) | 1,350 (-3%) | 7mo | $249,900 | $185 | 66 |
| 406 Allegheny Ave | 0.29mi | 3/1.5 (-1) | 1,285 (-8%) | 6mo | $235,000 | $183 | 64 |
| 636 Broadway | 0.35mi | 3/1.5 (-1) | 1,472 (+6%) | 7mo | $184,900 | $126 | 64 |
| 102 George St | 0.24mi | 3/1.0 (-1) | 1,511 (+8%) | 6mo | $267,500 | $177 | 63 |
| 241 Clearview Rd | 0.57mi | 3/1.0 (-1) | 1,364 (-2%) | 2mo | $222,000 | $163 | 61 |
| 524 Fulton St | 0.55mi | 4/1.0 | 1,490 (+7%) | 1mo | $236,000 | $158 | 60 |
| 348 High St | 0.58mi | 3/1.5 (-1) | 1,492 (+7%) | 3mo | $260,000 | $174 | 53 |
| 209 Centennial Ave | 0.68mi | 3/1.5 (-1) | 1,472 (+6%) | 1mo | $220,000 | $149 | 53 |
| 210 Centennial Ave | 0.67mi | 4/1.0 | 1,548 (+11%) | 6mo | $210,000 | $136 | 43 |
| 3 Sprenkle Ave | 0.65mi | 3/2.0 (-1) | 1,232 (-12%) | 1mo | $250,000 | $203 | 42 |
Match score weights: distance 35% · size 25% · config 20% · recency 20%. Top-matched comps best support the ARV.
Projected returns pro-forma
-3.0% appreciation · 4.67% rent growth · sell at horizon
- IRR
- 10.1%
- Equity multiple
- 1.41×
- Total profit
- $13,667
- Equity at exit
- $17,877
- IRR
- 20.7%
- Equity multiple
- 2.91×
- Total profit
- $64,088
- Equity at exit
- $10,367
Cash invested: $33,572 (down + closing). Projections, not guarantees.
Landlord ↔ Tenant lean methodology
- Overall (STATE)
- 62 Landlord-Friendly
- State Pennsylvania
- 62 Landlord-Friendly · EVEN
- County
- — inherits STATE
- City
- — inherits STATE
ZIP-level market 17331
- Home prices YoY
- -33.8%
- Rents YoY
- 4.7%
- Active inventory
- 386
- Price-to-rent
- 5.5×
Monthly cashflow live
- Estimated rent
- $1,829 high interval (Pro) →
- Mortgage (P&I)
- −$629
- Tax from tax record
- −$297 /mo · $3,569/yr
- Insurance
- −$50
- HOA
- −$0
- Vacancy / Maint / Mgmt
- −$384
- Net cashflow
- $469
Break-even live
Sensitivity live
| Price | -10% $537 | -5% $503 | +0% $469 | +5% $435 | +10% $401 |
|---|---|---|---|---|---|
| Rent | -10% $324 | -5% $396 | +0% $469 | +5% $541 | +10% $613 |
| Rate | -1.0pp $529 | -0.5pp $499 | base $469 | +0.5pp $438 | +1.0pp $406 |
UW: 25.0% down · 7.5% · 30yr · 1.5% tax · 5.0% vac · 8.0% maint · 8.0% mgmt
Financing live
Cash to close
- Down payment
- $29,975
- Closing costs
- $3,597
- Reserves months
- —
- Total cash needed
- —
Loan-product check · same deal, 3 products live
Conventional
25% down · 7.5% · 30yr
- Down + closing
- —
- Monthly P&I
- —
- Monthly cashflow
- —
- DSCR
- —
- Eligible?
- —
Personal DTI + credit; lowest rate.
DSCR
20% down · 8.5% · 30yr
- Down + closing
- —
- Monthly P&I
- —
- Monthly cashflow
- —
- DSCR
- —
- Eligible?
- —
No personal income docs; deal must DSCR.
Hard money
10% down · 12.0% · 12mo
- Down + closing
- —
- Monthly P&I
- —
- Monthly cashflow
- —
- DSCR
- —
- Eligible?
- —
Short-term bridge; refi at stabilization.
Rent comps 17 comps
| Address | Beds | Baths | Sqft | Rent | $/sqft | DOM | Units | Dist |
|---|---|---|---|---|---|---|---|---|
| 28 McCosh St Hanover, PA | 3.0 | 1.0 | 1800 | $2,050 | $1.14 | 14d | 1 | 0.16mi |
| 261 N Franklin St Unit 302 Hanover, PA | 3.0 | 2.0 | 1398 | $1,130 | $0.81 | 44d | 1 | 0.35mi |
| 285 South St Hanover, PA | 3.0 | 1.5 | 1000 | $1,350 | $1.35 | 14d | 1 | 1.13mi |
| 76 Brookside Ave Hanover, PA | 3.0 | 2.5 | 1625 | $1,906 | $1.17 | 44d | 1 | 1.14mi |
| 76 Brookside Ave Hanover, PA | 3.0 | 2.5 | 1625 | $1,963 | $1.21 | 22d | 1 | 1.14mi |
| 88 Brookside Ave Hanover, PA | 3.0 | 2.5 | 1625 | $1,906 | $1.17 | 44d | 1 | 1.15mi |
| 88 Brookside Ave Hanover, PA | 3.0 | 2.5 | 1625 | $1,963 | $1.21 | 22d | 1 | 1.15mi |
| 607 3rd St Hanover, PA | 3.0 | 1.0 | 1276 | $1,400 | $1.10 | 22d | 1 | 1.28mi |
| 51 Overlook Dr Unit F Hanover, PA | 3.0 | 2.5 | 1820 | $1,983 | $1.09 | 44d | 1 | 1.39mi |
| 51 Overlook Dr Unit J Hanover, PA | 3.0 | 2.5 | 1820 | $2,120 | $1.16 | 44d | 1 | 1.39mi |
| 101 Pacer Dr Unit L Hanover, PA | 3.0 | 2.5 | 1252 | $1,901 | $1.52 | 14d | 1 | 1.42mi |
| 101 Pacer Dr Unit K Hanover, PA | 3.0 | 2.5 | 1252 | $1,846 | $1.47 | 44d | 1 | 1.42mi |
| 101 Pacer Dr Unit M Hanover, PA | 3.0 | 2.5 | 1252 | $1,751 | $1.40 | 44d | 1 | 1.42mi |
| 34 Overlook Dr Hanover, PA | 3.0 | 2.5 | 1749 | $2,000 | $1.14 | 14d | 1 | 1.43mi |
| 22 Mustang Dr Hanover, PA | 3.0 | 2.5 | 1625 | $1,843 | $1.13 | 44d | 1 | 1.47mi |
| 40 Mustang Dr Hanover, PA | 4.0 | 2.5 | 1625 | $1,843 | $1.13 | 44d | 1 | 1.48mi |
| 20 Mustang Dr Hanover, PA | 4.0 | 2.5 | 1625 | $1,931 | $1.19 | 44d | 1 | 1.49mi |
Listing history 2 events
-
2026-03-23status Pending
-
2026-03-10$119,900 Active
ⓘ Source: listings_history table (triggers on properties + properties_extension) + one-shot
backfill from property_details.listing_events for pre-trigger history.
Tax reassessment forecast PA · Partial reset (capped growth)
- Current annual tax
- $3,569 · $297/mo
- Projected year-2 tax
- $3,569 · $297/mo
- Expected delta
- $0/yr ($0/mo · 0.0%)
ⓘ Screening estimate from a state-policy table — verify with the county assessor before closing.
Climate risk First Street
- Flood 1/10 Low FEMA zone X (unshaded) · 0% chance over 30 yrs
- Wildfire 1/10 Low
- Heat 6/10 Major 7 d/yr ≥102°F today · 16 d/yr by 30 yrs out
- Wind 3/10 Moderate 7% chance of damaging wind over 30 yrs
- Air quality 2/10 Low 1 unhealthy d/yr today · 3 by 30 yrs out
Nearby sold comps map
Loading sold comps map…
Walkable amenities ~0.75 mi
Loading nearby amenities…
Taxation est. · year 1
- Rental income
- $21,948
- − Mortgage interest
- −$6,716
- − Property taxes
- −$3,569
- − Insurance
- −$600
- − Repairs & maintenance
- −$1,756
- − Management
- −$1,756
- − Depreciation
- −$3,488
- Taxable income
- $4,063
- Est. tax owed @ 24.0%
- −$975
- After-tax cash flow
- $4,650/yr
For passive investors: Depreciation is non-cash, so a rental often shows a tax loss while cash-flowing — sheltering income. Rental losses are passive: they offset passive income freely, and up to $25,000/yr can offset ordinary (W-2) income if you actively participate and your MAGI is under $100k (phasing out to $0 by $150k); unused losses carry forward. On sale, claimed depreciation is recaptured at up to 25%, and gains may owe capital-gains tax (a 1031 exchange can defer both). Figures are a year-1 estimate at your 24.0% rate — not tax advice; consult a CPA.
Schools (NCES district)
- District
- Hanover Public SD
- NCES district ID
- 4211450
- Math proficiency
- 34% ▼ -11.00%
- Reading proficiency
- 54% ▼ -8.00%
- Median HH income
- $45,022
- Composite
- 37.26/100
- National rank
- #4457
- State rank
- #294 of 539 in PA
Livability — Hanover
- Score
- 76/100
- State rank
- #373
- US rank
- #3295
Category grades
Schools grade is shown separately in the Schools card above.
Census & demographics
- Census place
- Hanover, PA
- County
- York County · 278,806 people
- City population
- 56,443
- Metro
- York-Hanover, PA
- Population (ZIP)
- 56,443
- Household income
- $79,488
- Rent vs Own
- Severe rent burden
- 1076.0
Population outlook (York County) Hauer SSP2
- Today (2025)
- 454,205 people
- By 2030
- 457,407 · +0.7%
- By 2040
- 457,529 · +0.7%
- By 2050
- 448,261 · -1.3%
- By 2075
- 427,388 · -5.9%
- By 2100
- 384,218 · -15.4%
Race, ethnicity, and origin ACS 2023
- Neighborhood character
- Predominantly White (86%)
- Race & ethnicity
- White 86% Hispanic / Latino 7% Two or more races 7% Black 3% Asian 1%
- Hispanic origin (detail)
- Mexican 3% Puerto Rican 2%
- Common ancestry
- Romanian 3% Lithuanian 2% Slovak 2%
- Foreign-born
- 4% · Canada
- Languages at home
- 95% English-only · Spanish 3%
Political lean MEDSL · York
- 2024 margin
- Strong R (+25.3) · D 36.9% · R 62.1%
- 2008→2024 swing
- -11.7pp toward R · 2008: -13.6pp · 2024: -25.3pp
- All cycles
- 2024: R+25.3 2020: R+24.6 2016: R+29.3 2012: R+21.2 2008: R+13.6
Not yet ingested
- Civics
- —
Market trends
- HPI YoY
- ▼ -128.48%
- Current HPI
- 251.8974
- Rent YoY
- ▲ 4.67%
- Metro
- York-Hanover, PA
- State GDP YoY
- ▲ 1.68%
- F500 in state
- 34
Industry mix (Fortune 500 HQ in PA)
| Industry | F500 HQs | Revenue |
|---|---|---|
| Healthcare | 2 | $309B |
|
||
| Insurance | 2 | $27B |
|
||
| Telecommunications / Media | 1 | $124B |
|
||
| Industrial Distribution | 1 | $22B |
|
||
| Financial Services | 1 | $20B |
|
||
| Chemicals / Materials | 1 | $18B |
|
||
Price history
2 events — show timeline
- 2026-03-23 Pending — BRIGHT MLS
- 2026-03-10 Listed $119,900 BRIGHT MLS
Property tax history
+1.9%/yrLatest (2025): $3,569 · +0.8% YoY. Source: county tax records.
Cash-flow waterfall
monthlySold comps — $/sqft
last 12 mo · ≤1 miLoading sold comps…