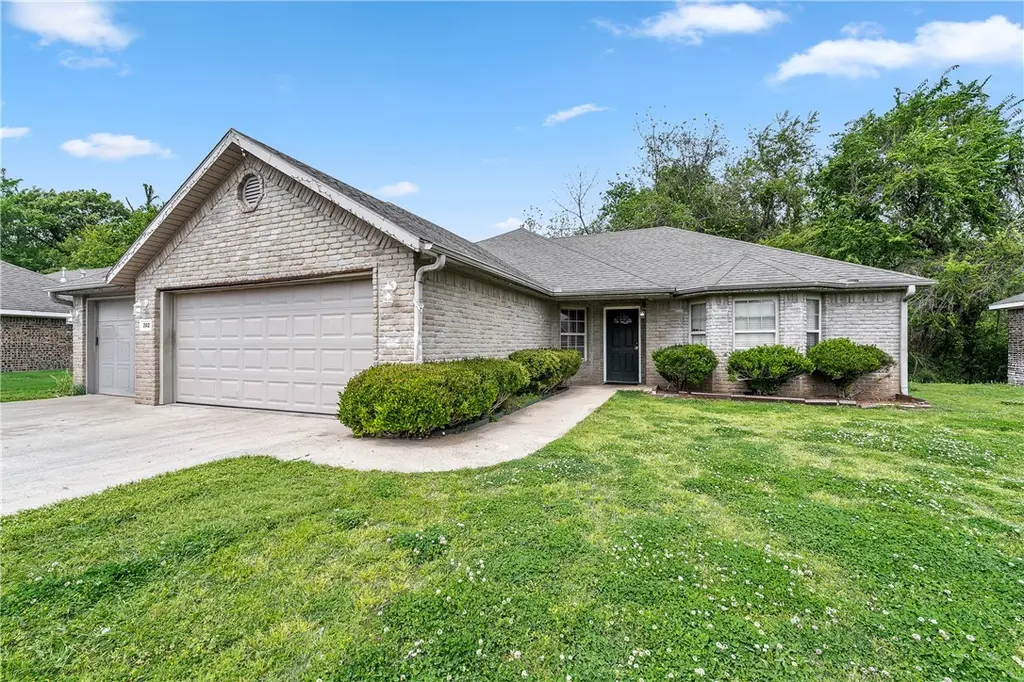
202 Hunter Allen · Springdale, AR
Flood risk 1/10 · Minimal
- FEMA flood zone
- X (unshaded)
- Chance of flooding over 30 yrs
- 0.0%
- Est. flood insurance / yr
- $507 – $1,088
Fire risk 4/10 · Minor
- Est. fire insurance / yr
- $1,499 – $2,785
Heat risk 5/10 · Moderate
- Hot days now (above 104°F)
- 7 days/yr
- Hot days in 30 yrs
- 21 days/yr
Wind risk 2/10 · Minimal
- Chance of severe wind over 30 yrs
- 2.0%
Air-quality risk 2/10 · Minimal
- Unhealthy air days now
- 1 days/yr
- Unhealthy air days in 30 yrs
- 1 days/yr
Risk factors via First Street. Map © Google.
Why this score? — see what drove the C- grade
The composite is a weighted blend of 9 inputs, each scored 0–100. Each bar is that input's sub-score; the figure is the points it added to the 100-point composite (weight × sub-score).
- Cash flow +15.6/30.0
- ARV discount +15.0/15.0
- DSCR +4.8/10.0
- 1% rule +3.7/10.0
- Livability +3.5/5.0
- Rent growth +3.2/5.0
- Schools +3.1/10.0
- Condition / age +2.5/5.0
- Appreciation +0.0/10.0
$218,000
🖨 Deal sheet 📄 Offer letter ✓ Due diligence
Listing remarks
* * Please note this property will require significant remodeling and does not qualify for traditional financing — cash or renovation loan offers only. There once was a home on Hunter Allen Drive, With 4 beds and 3 cars — what a jive! It needs a little love, Like a hand in a glove, Flip it right and watch your equity thrive! Opportunity is knocking at 202 Hunter Allen in Springdale! This 4-bedroom, 2-bath brick home sits on a level corner lot in Wilkins Subdivision, offering 1,661 sq ft of living space with a spacious 3-car attached garage. Built in 2007, the layout features an eat-in kitchen, walk-in closets, ceiling fans, and a cozy gas fireplace in the living room. Step outs
Key facts
- Cozy gas fireplace
- Walk-in closets
- Deck
Tags
Property features AI
Finance
- HOA & community: Monthly association fee; Community near fire station, hospital, schools, park, shopping, and sidewalks
Exterior
- Parking: Attached garage with garage door opener; 3 covered spaces
- Security: Fire alarm; Smoke detector(s)
- Utilities: Public water; Sewer available; Electricity available; Natural gas available; Cable available
- Home design: Single-story design; Residential zoning; Entry level on main level
- Construction: Brick construction; Architectural shingle roof; Slab foundation; Resale home (less than 25 years old)
- Exterior features: Concrete driveway; Deck; Corner lot, cleared and level; Near park; Subdivision setting; Shared road frontage
Interior
- Kitchen: Countertop; Dishwasher; Electric range; Gas cooktop; Microwave; Refrigerator
- Bedrooms: Bedroom on second level
- Flooring: Carpet; Tile
- Bathrooms: 2 full bathrooms
- Heating & cooling: Central heating (gas); Central air (electric)
- Interior features: Attic; Ceiling fan(s); Eat-in kitchen; Storage; Walk-in closet(s); Window treatments; Double-pane vinyl windows with blinds
- Laundry & utility: Washer hookup; Dryer hookup; Utility room (main level)
Neighborhood map
What this means for you Summary
Snapshot
- This is a 4-bed/2.0-bath single-family listed at $218k.
Deal economics
- At list price, monthly cash flow is $92 ($1k/yr) — positive.
- The deal already cash-flows at list — no discount required.
- To meet the 1% rule (rent ≥ 1% of price), the offer needs to be $190k (12.6% below list).
- Recommended offer: $190k (12.6% below list) — sets the bar for 1% rule.
- Cap rate 6.8% vs local median 3.3% in Springdale — top-decile yield for the area; either an underpriced asset or a hidden risk that comps aren't pricing in. Stress-test before assuming the spread holds.
Location & tenants
- Location reads 70/100 on livability (#48 in AR) — a middle-class / working-renter tenant base. Strengths: cost of living A+, housing A+, health & safety A+; Watch: schools D+, commute D+, employment D+.
- Springdale School District (urban): math 38% / reading 35% proficiency, ranked #100 of 238 in AR (top 42%) — families likely to look elsewhere, expect single-tenant / working-renter base with shorter leases.
- Market conditions: Rents rising (+2.9%/yr); 369 active listings in the ZIP; 4 comparable units currently listed for rent nearby; rentals lingering (median 44d on market — plan ~5-8 weeks vacancy on turnover, expect pricing pressure); 50% of comp listings sitting > 30 days — soft ceiling on asking rent; 4,359 units permitted in Benton County in 2024 (402 in 5+ unit buildings).
- This rent runs 35% of the median local income ($66k/yr) — at the standard rent-burdened threshold; future hikes will face affordability resistance.
Forward outlook
- Local home prices are declining (-3.0%/yr); year-one equity from $2k of loan paydown is wiped out by about $7k of value loss. Plan a longer hold.
- Benton County population projected at +56% by 2050 — long-run rental-demand tailwind backs the buy-and-hold thesis.
Negotiation context
- It's been on market 55 days — a 3% lower offer ($211k) is reasonable based on typical stale-listing flexibility.
- Current owner paid $100k; list at $218k implies a 118% gain — meaningful room to come down on a strong offer.
Risks & watch-outs
- Climate carrying-cost: extreme-heat days projected 7→21/yr by 2055 (HVAC capex compounding) — expect insurance premiums to compound above CPI over the hold.
Questions for the listing agent
- It's been on market 55 days. Have you received any prior offers? Is the seller open to a 13% concession, seller financing, or rate buy-down credit?
- Is there a deadline driving the sale (1031 exchange, divorce, estate, relocation)? That informs how much negotiation room exists.
- Schools are D-rated, which usually means shorter tenancies and higher turnover. Who's the typical renter profile here, and what's been the actual vacancy rate?
- Crime grade is D in this area — have there been break-ins, vandalism, or insurance claims at this property in the last 3 years? What carrier currently insures it and at what premium?
- What's the average days-on-market for RENTAL listings here right now (not sales)? A rising rental-DOM trend means longer vacancies and softer asking-rent achievability than the comps imply.
- What's the recent tenant-quality profile in this submarket — average credit score on applications, eviction rate, late-payment / NSF rate, and stable-employment percentage? A property-management company in the area should have these aggregated.
- How much new for-sale + rental construction is in the pipeline within 1–3 miles? Heavy new supply typically softens prices + rents 12–24 months out; constrained supply supports both.
Investment metrics
- 1% rule
- 0.87% ✗
- Cap rate
- 6.80%
- Cash-on-cash
- 1.81%
- DSCR
- 1.08
- GRM
- 9.5
CMA / ARV
- ARV (median comp)
- $290,147
- List price
- $218,000
- Delta
- -24.87%
- Verdict
- UNDERPRICED
- Comps
- 20 within 1.0 mi
Show comp detail 12 sales within ~0.75 mi
| Address | Dist | Beds/Ba | Sqft | Sold | Price | $/sf | Match |
|---|---|---|---|---|---|---|---|
| 3621 Alliance Dr | 0.06mi | 4/2.0 | 1,660 (-0%) | 7mo | $300,000 | $181 | 91 |
| 3751 Alliance Dr | 0.14mi | 4/2.0 | 1,660 (-0%) | 3mo | $280,000 | $169 | 91 |
| 235 Glory Ln | 0.15mi | 4/2.0 | 1,660 (-0%) | 8mo | $293,750 | $177 | 86 |
| 3733 Alliance Dr | 0.13mi | 4/2.0 | 1,628 (-2%) | 10mo | $293,750 | $180 | 82 |
| 337 Joy Carol Loop | 0.15mi | 3/2.0 (-1) | 1,560 (-6%) | 4mo | $265,000 | $170 | 74 |
| 334 Jeanne | 0.18mi | 3/2.0 (-1) | 1,592 (-4%) | 9mo | $305,000 | $192 | 72 |
| 566 Parkside Cv | 0.42mi | 3/2.0 (-1) | 1,612 (-3%) | 3mo | $363,000 | $225 | 68 |
| 604 Loganberry Ln | 0.42mi | 3/2.0 (-1) | 1,657 (-0%) | 9mo | $336,400 | $203 | 68 |
| 3058 Chelsey Ln | 0.42mi | 3/2.0 (-1) | 1,477 (-11%) | 3mo | $315,000 | $213 | 54 |
| 3393 Ashton Ln | 0.61mi | 3/2.0 (-1) | 1,448 (-13%) | 3mo | $270,000 | $186 | 42 |
| 3316 Grainger Cir | 0.75mi | 3/2.0 (-1) | 1,474 (-11%) | 1mo | $293,000 | $199 | 40 |
| 4809 Kimberly Pl | 0.73mi | 3/2.0 (-1) | 1,869 (+12%) | 6mo | $315,000 | $169 | 35 |
Match score weights: distance 35% · size 25% · config 20% · recency 20%. Top-matched comps best support the ARV.
Projected returns pro-forma
-3.0% appreciation · 2.87% rent growth · sell at horizon
- IRR
- -13.6%
- Equity multiple
- 0.51×
- Total profit
- $-29,731
- Equity at exit
- $32,505
- IRR
- -4.9%
- Equity multiple
- 0.68×
- Total profit
- $-19,465
- Equity at exit
- $18,849
Cash invested: $61,040 (down + closing). Projections, not guarantees.
Landlord ↔ Tenant lean methodology
- Overall (STATE)
- 92 Strongly Landlord-Friendly
- State Arkansas
- 92 Strongly Landlord-Friendly · R+14
- County
- — inherits STATE
- City
- — inherits STATE
ZIP-level market 72764
- Rents YoY
- 2.9%
- Active inventory
- 369
- Price-to-rent
- 9.5×
Monthly cashflow live
- Estimated rent
- $1,905 medium interval (Pro) →
- Mortgage (P&I)
- −$1,143
- Tax from tax record
- −$178 /mo · $2,141/yr
- Insurance
- −$91
- HOA
- −$0
- Vacancy / Maint / Mgmt
- −$400
- Net cashflow
- $92
Break-even live
UW: 25.0% down · 7.5% · 30yr · 1.5% tax · 5.0% vac · 8.0% maint · 8.0% mgmt
Financing live
Cash to close
- Down payment
- $54,500
- Closing costs
- $6,540
- Reserves months
- —
- Total cash needed
- —
Loan-product check · same deal, 3 products live
Conventional
25% down · 7.5% · 30yr
- Down + closing
- —
- Monthly P&I
- —
- Monthly cashflow
- —
- DSCR
- —
- Eligible?
- —
Personal DTI + credit; lowest rate.
DSCR
20% down · 8.5% · 30yr
- Down + closing
- —
- Monthly P&I
- —
- Monthly cashflow
- —
- DSCR
- —
- Eligible?
- —
No personal income docs; deal must DSCR.
Hard money
10% down · 12.0% · 12mo
- Down + closing
- —
- Monthly P&I
- —
- Monthly cashflow
- —
- DSCR
- —
- Eligible?
- —
Short-term bridge; refi at stabilization.
Rent comps 4 comps
| Address | Beds | Baths | Sqft | Rent | $/sqft | DOM | Units | Dist |
|---|---|---|---|---|---|---|---|---|
| 3910 Allegheny Ter Unit B Springdale, AR | 3.0 | 2.0 | 1580 | $1,495 | $0.95 | 14d | 1 | 0.68mi |
| 1489 Bridgeboro Ave Springdale, AR | 4.0 | 2.0 | 1738 | $2,150 | $1.24 | 43d | 1 | 1.00mi |
| 5325 N Oak St Bethel Heights, AR | 1.0–3.0 | 1.0–2.0 | 879 | $1,345 | $1.53 | 21d | 7 | 1.13mi |
| 584 Quartz Way Springdale, AR | 4.0 | 2.0 | 2100 | $2,295 | $1.09 | 43d | 1 | 1.28mi |
Listing history 18 events
-
2026-06-18days on market $218,000 Active 55 DOM
-
2026-06-17days on market $218,000 Active 54 DOM
-
2026-06-16days on market $218,000 Active 53 DOM
-
2026-06-15days on market $218,000 Active 52 DOM
-
2026-06-14days on market $218,000 Active 50 DOM
-
2026-06-10days on market $218,000 Active 47 DOM
-
2026-06-09days on market $218,000 Active 46 DOM
-
2026-06-08days on market $218,000 Active 45 DOM
-
2026-06-07days on market $218,000 Active 44 DOM
-
2026-06-05days on market $218,000 Active 41 DOM
-
2026-06-03days on market $218,000 Active 40 DOM
-
2026-06-02days on market $218,000 Active 39 DOM
-
2026-06-01days on market $218,000 Active 38 DOM
-
2026-05-31days on market $218,000 Active 37 DOM
-
2026-05-31days on market $218,000 Active 36 DOM
-
2026-05-06price $227,000 960-char remark
-
2026-04-24$235,000 Active 960-char remark
-
2026-04-07soldstatus $100,000
ⓘ Source: listings_history table (triggers on properties + properties_extension) + one-shot
backfill from property_details.listing_events for pre-trigger history.
Tax reassessment forecast AR · Resets to sale price
- Current annual tax
- $2,141 · $178/mo
- Projected year-2 tax
- $2,141 · $178/mo
- Expected delta
- $0/yr ($0/mo · 0.0%)
ⓘ Screening estimate from a state-policy table — verify with the county assessor before closing.
Climate risk First Street
- Flood 1/10 Low FEMA zone X (unshaded) · 0% chance over 30 yrs
- Wildfire 4/10 Moderate
- Heat 5/10 Major 7 d/yr ≥104°F today · 21 d/yr by 30 yrs out
- Wind 2/10 Low 2% chance of damaging wind over 30 yrs
- Air quality 2/10 Low 1 unhealthy d/yr today · 1 by 30 yrs out
Nearby sold comps map
Loading sold comps map…
Walkable amenities ~0.75 mi
Loading nearby amenities…
Taxation est. · year 1
- Rental income
- $22,856
- − Mortgage interest
- −$12,211
- − Property taxes
- −$2,141
- − Insurance
- −$1,090
- − Repairs & maintenance
- −$1,828
- − Management
- −$1,828
- − Depreciation
- −$6,342
- Taxable loss
- −$2,585
- Est. tax savings @ 24.0%
- +$621
- After-tax cash flow
- $1,727/yr
For passive investors: Depreciation is non-cash, so a rental often shows a tax loss while cash-flowing — sheltering income. Rental losses are passive: they offset passive income freely, and up to $25,000/yr can offset ordinary (W-2) income if you actively participate and your MAGI is under $100k (phasing out to $0 by $150k); unused losses carry forward. On sale, claimed depreciation is recaptured at up to 25%, and gains may owe capital-gains tax (a 1031 exchange can defer both). Figures are a year-1 estimate at your 24.0% rate — not tax advice; consult a CPA.
Schools (NCES district)
- District
- Springdale School District
- NCES district ID
- 0512660
- Math proficiency
- 38% ▼ -11.00%
- Reading proficiency
- 35% ▼ -6.00%
- Median HH income
- $45,469
- Composite
- 31.18/100
- National rank
- #6046
- State rank
- #100 of 238 in AR
Livability — Springdale
- Score
- 70/100
- State rank
- #48
- US rank
- #7326
Category grades
Schools grade is shown separately in the Schools card above.
Census & demographics
- Census place
- Springdale, AR
- County
- Washington County · 252,056 people
- City population
- 104,811
- Metro
- Fayetteville-Springdale-Rogers, AR
- Population (ZIP)
- 58,719
- Household income
- $65,898
- Rent vs Own
- Severe rent burden
- 1352.0
Population outlook (Benton County) Hauer SSP2
- Today (2025)
- 318,683 people
- By 2030
- 353,481 · +10.9%
- By 2040
- 425,280 · +33.4%
- By 2050
- 497,239 · +56.0%
- By 2075
- 662,114 · +107.8%
- By 2100
- 776,431 · +143.6%
Race, ethnicity, and origin ACS 2023
- Neighborhood character
- Diverse neighborhood (Simpson 0.70)
- Race & ethnicity
- Hispanic / Latino 44% White 33% Two or more races 28% Pacific Islander 11% Black 3% Asian 2% Native American 2%
- Hispanic origin (detail)
- Mexican 32% Puerto Rican 1%
- Common ancestry
- Romanian 1% Slovak 1% Italian 1%
- Foreign-born
- 28% · Canada
- Languages at home
- 58% English-only · Spanish 32% Other Asian/Pacific 9% Russian/Polish/Slavic 1%
Political lean MEDSL · Benton
- 2024 margin
- Strong R (+27.0) · D 35.2% · R 62.1% · Other 2.7%
- 2008→2024 swing
- +9.6pp toward D · 2008: -36.5pp · 2024: -27.0pp
- All cycles
- 2024: R+27.0 2020: R+26.4 2016: R+34.9 2012: R+40.4 2008: R+36.5
Not yet ingested
- Civics
- —
Market trends
- HPI YoY
- ▼ -269.05%
- Current HPI
- 297.924
- Rent YoY
- ▲ 2.87%
- Metro
- Fayetteville-Springdale-Rogers, AR
- State GDP YoY
- ▲ 3.80%
- F500 in state
- 10
Industry mix (Fortune 500 HQ in AR)
| Industry | F500 HQs | Revenue |
|---|---|---|
| Retail | 1 | $681B |
|
||
| Food / Agriculture | 1 | $53B |
|
||
| Retail / Energy | 1 | $22B |
|
||
| Transportation / Logistics | 1 | $12B |
|
||
| Energy | 1 | $4B |
|
||
Price history
+118.0% since first listed4 events — show timeline
- 2026-05-26 Price Changed $218,000 NWARMLS
- 2026-05-06 Price Changed $227,000 NWARMLS
- 2026-04-24 Listed $235,000 NWARMLS
- 2026-04-07 Sold (Public Records) $100,000 Public Records
Property tax history
+4.7%/yrLatest (2025): $2,141 · +10.1% YoY. Source: county tax records.
Cash-flow waterfall
monthlySold comps — $/sqft
last 12 mo · ≤1 miLoading sold comps…