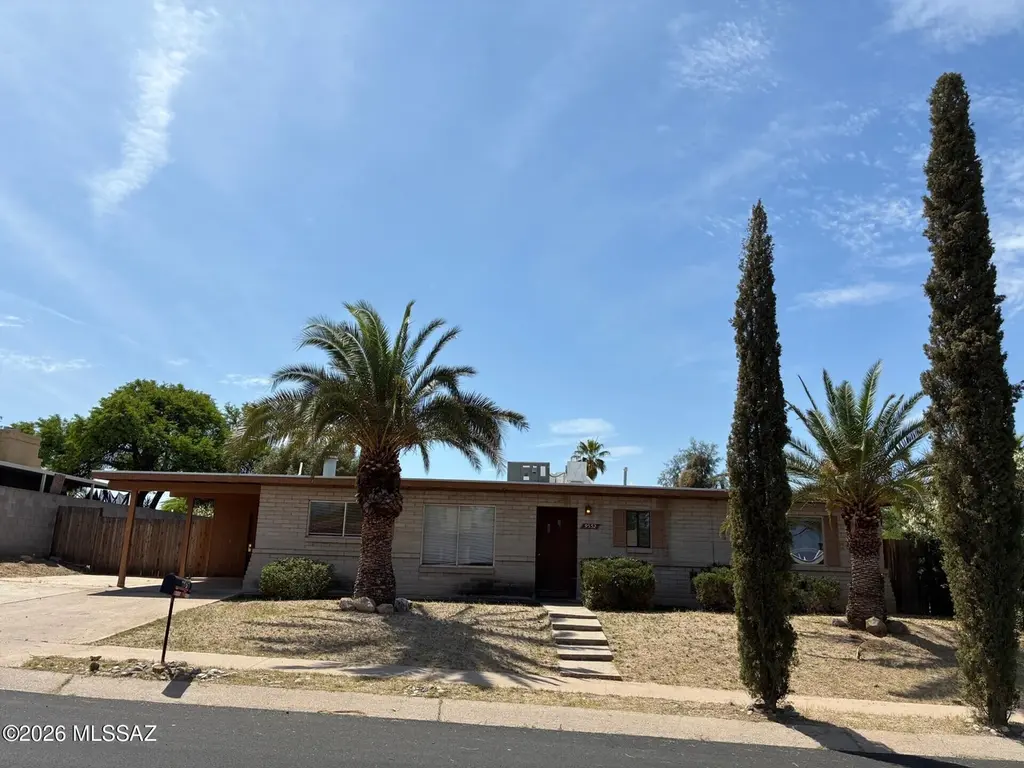
9552 E Irene St · Tucson, AZ
Flood risk 1/10 · Minimal
- FEMA flood zone
- X (unshaded)
- Chance of flooding over 30 yrs
- 0.0%
- Est. flood insurance / yr
- $507 – $1,088
Fire risk 5/10 · Moderate
- Est. fire insurance / yr
- $610 – $1,132
Heat risk 7/10 · Major
- Hot days now (above 104°F)
- 6 days/yr
- Hot days in 30 yrs
- 16 days/yr
Wind risk 1/10 · Minimal
- Chance of severe wind over 30 yrs
- —
Air-quality risk 1/10 · Minimal
- Unhealthy air days now
- 0 days/yr
- Unhealthy air days in 30 yrs
- 0 days/yr
Risk factors via First Street. Map © Google.
Why this score? — see what drove the D grade
The composite is a weighted blend of 9 inputs, each scored 0–100. Each bar is that input's sub-score; the figure is the points it added to the 100-point composite (weight × sub-score).
- ARV discount +15.0/15.0
- Cash flow +11.5/30.0
- Livability +3.7/5.0
- DSCR +3.4/10.0
- 1% rule +2.6/10.0
- Rent growth +2.5/5.0
- Condition / age +2.5/5.0
- Schools +1.6/10.0
- Appreciation +0.0/10.0
$258,000
🖨 Deal sheet (PDF) 📄 Offer letter ✓ Due diligence
Listing remarks MLS
Needs some TLC, 1408 sq ft. Four bedrooms, two bathrooms, Fireplace, Pool, large backyard with dog run.
Key facts
- Large backyard
- Pool
- Dog run
Tags
Neighborhood map
What this means for you Summary
Snapshot
- This is a 4-bed/2.0-bath single-family listed at $258k.
Deal economics
- At list price, monthly cash flow is $-86 ($-1k/yr) — negative.
- To cash-flow at today's rent, offer at most $243k (5.9% below list).
- To meet the 1% rule (rent ≥ 1% of price), the offer needs to be $196k (24.0% below list).
- Recommended offer: $196k (24.0% below list) — sets the bar for 1% rule.
- Cap rate 5.9% vs local median 3.7% in Tucson — top-decile yield for the area; either an underpriced asset or a hidden risk that comps aren't pricing in. Stress-test before assuming the spread holds.
Location & tenants
- Location reads 74/100 on livability (#17 in AZ, #4,502 nationally) — a middle-class / working-renter tenant base. Strengths: commute A+, cost of living A+, housing A+; Watch: health & safety C-, crime F, employment D-.
- Tucson Unified District (4403) (urban): math 14% / reading 23% proficiency, ranked #190 of 249 in AZ (top 76%) — low school quality limits family demand, transient renter base, plan for 1-2y turnover.
- Zoned schools: Dunham Elementary School (math 17% / reading 34%, grade F, #629 of 1,109 statewide, top 57%, 158 students, 61% FRL); Secrist Middle School (math 2% / reading 17%, grade F, #194 of 218 statewide, top 90%, 304 students, 76% FRL); Santa Rita High School (math 8% / reading 8%, grade F, #358 of 381 statewide, top 94%, 392 students, 63% FRL).
- Market conditions: Rents soft (-0.2%/yr); 198 active listings in the ZIP; 32 comparable units currently listed for rent nearby; rentals at typical pace (median 23d on market — plan ~3-4 weeks tenant-placement turnaround); 5,268 units permitted in Pima County in 2024 (996 in 5+ unit buildings).
- This rent runs 38% of the median local income ($62k/yr) — at the standard rent-burdened threshold; future hikes will face affordability resistance.
Forward outlook
- Local home prices are declining (-3.0%/yr); year-one equity from $2k of loan paydown is wiped out by about $8k of value loss. Plan a longer hold.
- Pima County population projected at +8% by 2050 — modest demand growth; plan on rents tracking national, not racing it.
Negotiation context
- It's been on market 82 days — a 6% lower offer ($243k) is reasonable based on typical stale-listing flexibility.
- 11 sale attempts since 6y ago with the ask held roughly flat each time — persistent listings suggest the price (not the market) is what's stuck; bring a comps-based counter.
- Current owner paid $71k; list at $258k implies a 263% gain — meaningful room to come down on a strong offer.
Risks & watch-outs
- Climate carrying-cost: moderate wildfire risk; extreme-heat days projected 6→16/yr by 2055 (HVAC capex compounding) — expect insurance premiums to compound above CPI over the hold.
Questions for the listing agent
- What do current leases actually rent for vs. the listed asking? Can we see a recent rent roll and the last 12 months of T-12 income?
- It's been on market 82 days. Have you received any prior offers? Is the seller open to a 24% concession, seller financing, or rate buy-down credit?
- Built in 1973 — when were the roof, HVAC, electrical panel, plumbing, and water heater last replaced?
- Why hasn't it sold? Are there any deal-killer items the seller is aware of (foundation, flood, title, zoning, code violations)?
- Is there a deadline driving the sale (1031 exchange, divorce, estate, relocation)? That informs how much negotiation room exists.
- Schools are D-rated, which usually means shorter tenancies and higher turnover. Who's the typical renter profile here, and what's been the actual vacancy rate?
- Crime grade is F in this area — have there been break-ins, vandalism, or insurance claims at this property in the last 3 years? What carrier currently insures it and at what premium?
- The area grade is low — what's the realistic commute time and amenity access for the typical tenant pool here? Any planned neighborhood developments (good or bad) we should know about?
- What's the average days-on-market for RENTAL listings here right now (not sales)? A rising rental-DOM trend means longer vacancies and softer asking-rent achievability than the comps imply.
- What's the recent tenant-quality profile in this submarket — average credit score on applications, eviction rate, late-payment / NSF rate, and stable-employment percentage? A property-management company in the area should have these aggregated.
- How much new for-sale + rental construction is in the pipeline within 1–3 miles? Heavy new supply typically softens prices + rents 12–24 months out; constrained supply supports both.
Investment metrics
- 1% rule
- 0.76% ✗
- Cap rate
- 5.89%
- Cash-on-cash
- -1.43%
- DSCR
- 0.94
- GRM
- 11.0
CMA / ARV
- ARV (median comp)
- $314,447
- List price
- $258,000
- Delta
- -17.95%
- Verdict
- UNDERPRICED
- Comps
- 20 within 1.0 mi
Show comp detail 12 sales within ~0.75 mi
| Address | Dist | Beds/Ba | Sqft | Sold | Price | $/sf | Match |
|---|---|---|---|---|---|---|---|
| 9714 E Gray Hawk Dr | 0.18mi | 3/2.0 (-1) | 1,423 (+1%) | 1mo | $349,900 | $246 | 84 |
| 9761 E Sellarole Rd | 0.28mi | 4/2.0 | 1,419 (+1%) | 4mo | $299,000 | $211 | 82 |
| 3563 S Harrison Shadow Way | 0.30mi | 3/2.0 (-1) | 1,385 (-2%) | 1mo | $285,000 | $206 | 78 |
| 3390 S Marcia Pl | 0.25mi | 3/2.0 (-1) | 1,498 (+6%) | 1mo | $295,000 | $197 | 72 |
| 9849 E Victoria Ln | 0.43mi | 3/2.0 (-1) | 1,367 (-3%) | 1mo | $287,500 | $210 | 69 |
| 9842 E Sellarole Rd | 0.38mi | 4/2.0 | 1,519 (+8%) | 1mo | $315,000 | $207 | 68 |
| 2749 S Pace East Dr | 0.49mi | 3/2.0 (-1) | 1,383 (-2%) | 2mo | $270,000 | $195 | 67 |
| 9706 E Sascha St | 0.59mi | 3/2.0 (-1) | 1,495 (+6%) | 1mo | $316,000 | $211 | 56 |
| 10071 E Nicaragua Ln | 0.66mi | 3/2.0 (-1) | 1,360 (-3%) | 2mo | $290,000 | $213 | 56 |
| 2741 S Aida Ave | 0.66mi | 3/2.0 (-1) | 1,384 (-2%) | 6mo | $280,000 | $202 | 56 |
| 9745 E Sascha St | 0.63mi | 3/2.0 (-1) | 1,285 (-9%) | 0mo | $300,000 | $233 | 51 |
| 9968 E Country Shadows Dr | 0.75mi | 3/2.0 (-1) | 1,258 (-11%) | 5mo | $290,000 | $231 | 38 |
Match score weights: distance 35% · size 25% · config 20% · recency 20%. Top-matched comps best support the ARV.
Projected returns pro-forma
-3.0% appreciation · 0.0% rent growth · sell at horizon
- IRR
- -21.8%
- Equity multiple
- 0.26×
- Total profit
- $-53,108
- Equity at exit
- $38,469
- IRR
- -24.2%
- Equity multiple
- -0.05×
- Total profit
- $-75,770
- Equity at exit
- $22,307
Cash invested: $72,240 (down + closing). Projections, not guarantees.
Landlord ↔ Tenant lean methodology
- Overall (STATE)
- 87 Strongly Landlord-Friendly
- State Arizona
- 87 Strongly Landlord-Friendly · R+3
- County
- — inherits STATE
- City
- — inherits STATE
ZIP-level market 85730
- Home prices YoY
- -30.9%
- Rents YoY
- -0.2%
- Active inventory
- 198
- Price-to-rent
- 11.0×
Monthly cashflow live
- Estimated rent
- $1,960 high interval (Pro) →
- Mortgage (P&I)
- −$1,353
- Tax from tax record
- −$174 /mo · $2,090/yr
- Insurance
- −$108
- HOA
- −$0
- Vacancy / Maint / Mgmt
- −$412
- Net cashflow
- $-86
Break-even live
Sensitivity live
| Price | -10% $60 | -5% $-13 | +0% $-86 | +5% $-159 | +10% $-232 |
|---|---|---|---|---|---|
| Rent | -10% $-241 | -5% $-164 | +0% $-86 | +5% $-9 | +10% $69 |
| Rate | -1.0pp $44 | -0.5pp $-21 | base $-86 | +0.5pp $-153 | +1.0pp $-221 |
UW: 25.0% down · 7.5% · 30yr · 1.5% tax · 5.0% vac · 8.0% maint · 8.0% mgmt
Financing live
Cash to close
- Down payment
- $64,500
- Closing costs
- $7,740
- Reserves months
- —
- Total cash needed
- —
Loan-product check · same deal, 3 products live
Conventional
25% down · 7.5% · 30yr
- Down + closing
- —
- Monthly P&I
- —
- Monthly cashflow
- —
- DSCR
- —
- Eligible?
- —
Personal DTI + credit; lowest rate.
DSCR
20% down · 8.5% · 30yr
- Down + closing
- —
- Monthly P&I
- —
- Monthly cashflow
- —
- DSCR
- —
- Eligible?
- —
No personal income docs; deal must DSCR.
Hard money
10% down · 12.0% · 12mo
- Down + closing
- —
- Monthly P&I
- —
- Monthly cashflow
- —
- DSCR
- —
- Eligible?
- —
Short-term bridge; refi at stabilization.
Rent comps 32 comps
| Address | Beds | Baths | Sqft | Rent | $/sqft | DOM | Units | Dist |
|---|---|---|---|---|---|---|---|---|
| 3246 S Winona Cir Tucson, AZ | 4.0 | 2.0 | 1655 | $1,830 | $1.11 | 45d | 1 | 0.28mi |
| 9802 E Stella Rd Tucson, AZ | 4.0 | 2.0 | 1416 | $1,945 | $1.37 | 13d | 1 | 0.30mi |
| 3715 S Escalante Oasis Pl Tucson, AZ | 4.0 | 2.0 | 1601 | $1,900 | $1.19 | 25d | 1 | 0.39mi |
| 9801 E Domenic Ln Tucson, AZ | 3.0 | 2.0 | 1428 | $1,791 | $1.25 | 13d | 1 | 0.44mi |
| 10002 E Stella Rd Tucson, AZ | 4.0 | 2.0 | 1706 | $2,000 | $1.17 | 25d | 1 | 0.53mi |
| 3292 S Kristina Park Loop Tucson, AZ | 3.0 | 2.0 | 1650 | $2,000 | $1.21 | 25d | 1 | 0.53mi |
| 9202 E 39th St Tucson, AZ | 3.0 | 2.0 | 1728 | $1,650 | $0.95 | 25d | 1 | 0.55mi |
| 9746 E Sascha St Tucson, AZ | 3.0 | 2.0 | 1024 | $1,800 | $1.76 | 16d | 1 | 0.61mi |
| 9699 E Vendela St Tucson, AZ | 3.0 | 2.0 | 1165 | $1,800 | $1.55 | 45d | 1 | 0.66mi |
| 10061 E Domenic Ln Tucson, AZ | 3.0 | 2.0 | 1597 | $1,785 | $1.12 | 3d | 1 | 0.68mi |
| 10055 E Desert Aire Dr Tucson, AZ | 3.0 | 2.0 | 1300 | $1,680 | $1.29 | 4d | 1 | 0.77mi |
| 9960 E Banister Dr Tucson, AZ | 3.0 | 2.0 | 1252 | $1,575 | $1.26 | 45d | 1 | 0.77mi |
| 9172 E Corte Arroyo Oeste Tucson, AZ | 3.0 | 2.0 | 1350 | $1,900 | $1.41 | 5d | 1 | 0.85mi |
| 10272 E Sky Castle Way Tucson, AZ | 3.0 | 2.0 | 1709 | $1,781 | $1.04 | 12d | 1 | 0.89mi |
| 9903 E Rocky Vista Dr Tucson, AZ | 3.0 | 2.0 | 1560 | $1,795 | $1.15 | 5d | 1 | 0.92mi |
| 2342 S Via de Dos Arroyos Tucson, AZ | 3.0 | 2.0 | 1618 | $1,795 | $1.11 | 45d | 1 | 0.93mi |
| 4052 S Ferris Dr Tucson, AZ | 4.0 | 2.0 | 1672 | $2,125 | $1.27 | 16d | 1 | 0.99mi |
| 2650 S Brandywine Ln Tucson, AZ | 3.0 | 2.5 | 1340 | $1,500 | $1.12 | 45d | 1 | 1.00mi |
| 2217 S Oak Park Dr Tucson, AZ | 3.0 | 2.0 | 1631 | $3,200 | $1.96 | 45d | 1 | 1.06mi |
| 4289 S Goodall Pl Tucson, AZ | 3.0 | 2.0 | 1372 | $1,950 | $1.42 | 45d | 1 | 1.08mi |
| 4275 S Mayberry Pl Tucson, AZ | 4.0 | 2.0 | 1672 | $1,850 | $1.11 | 45d | 1 | 1.11mi |
| 3455 S Magda Ave Tucson, AZ | 3.0 | 2.0 | 1500 | $2,000 | $1.33 | 45d | 1 | 1.16mi |
| 10234 E Wasp Spring Dr Tucson, AZ | 3.0 | 2.0 | 1558 | $1,701 | $1.09 | 13d | 1 | 1.23mi |
| 8829 E Eagle Creek Dr Tucson, AZ | 3.0 | 2.0 | 1280 | $1,830 | $1.43 | 18d | 1 | 1.26mi |
| 9009 E Kinross Dr Tucson, AZ | 3.0 | 2.0 | 1304 | $1,715 | $1.32 | 23d | 1 | 1.34mi |
| 8467 E Shasta Dr Tucson, AZ | 3.0 | 2.0 | 1618 | $1,725 | $1.07 | 13d | 1 | 1.39mi |
| 8737 E Pebble Stone Ln Tucson, AZ | 3.0 | 2.0 | 1383 | $2,095 | $1.51 | 45d | 1 | 1.39mi |
| 1422 S Moonflower Ln Tucson, AZ | 3.0 | 2.0 | 1190 | $1,695 | $1.42 | 5d | 1 | 1.39mi |
| 8763 E Pebble Stone Ln Tucson, AZ | 3.0 | 2.0 | 1262 | $1,995 | $1.58 | 5d | 1 | 1.40mi |
| 4433 S Sunrise Bluff Way Tucson, AZ | 3.0 | 2.0 | 1465 | $1,895 | $1.29 | 25d | 1 | 1.46mi |
| 9055 E Alderpoint Way Tucson, AZ | 3.0 | 2.0 | 1165 | $1,695 | $1.45 | 23d | 1 | 1.47mi |
| 8755 E Stone Meadow Cir Tucson, AZ | 3.0 | 2.0 | 1465 | $1,925 | $1.31 | 19d | 1 | 1.50mi |
Listing history 42 events
-
2026-06-21days on market $258,000 Active 82 DOM
-
2026-06-18days on market $258,000 Active 79 DOM
-
2026-06-17days on market $258,000 Active 78 DOM
-
2026-06-16days on market $258,000 Active 77 DOM
-
2026-06-15days on market $258,000 Active 76 DOM
-
2026-06-13days on market $258,000 Active 74 DOM
-
2026-06-10days on market $258,000 Active 71 DOM
-
2026-06-09days on market $258,000 Active 70 DOM
-
2026-06-08days on market $258,000 Active 69 DOM
-
2026-06-07days on market $258,000 Active 68 DOM
-
2026-06-05days on market $258,000 Active 65 DOM
-
2026-06-03days on market $258,000 Active 64 DOM
-
2026-06-02days on market $258,000 Active 63 DOM
-
2026-06-01days on market $258,000 Active 62 DOM
-
2026-05-31days on market $258,000 Active 61 DOM
-
2026-03-31$258,000 Active 103-char remark
Show marketing remark (103 chars)
Needs some TLC, 1408 sq ft. Four bedrooms, two bathrooms, Fireplace, Pool, large backyard with dog run.
-
2026-03-27historical
-
2026-03-06price $275,000
-
2026-02-04$280,000 Active
-
2025-08-12historical
-
2025-06-30historical Active Contingent
-
2025-06-16price $285,000
-
2025-05-21$289,900 Active
-
2025-05-14historical
-
2025-05-09$289,900 Active
-
2025-04-28historical
-
2025-04-27$289,900 Active
-
2025-04-27historical
-
2025-01-28$289,900 Active
-
2024-10-02historical
-
2024-07-31$325,000 Active
-
2024-03-05historical $1,650
-
2023-11-22price $1,650
-
2023-10-04$1,700
-
2020-12-01historical
-
2020-09-11status Active
-
2020-07-09historical
-
2020-06-23price $204,900
-
2020-06-08status Active
-
2020-06-03historical
-
2020-06-02$199,900 Active
-
1980-10-17soldstatus $71,000
ⓘ Source: listings_history table (triggers on properties + properties_extension) + one-shot
backfill from property_details.listing_events for pre-trigger history.
Tax reassessment forecast AZ · Resets to sale price
- Current annual tax
- $2,090 · $174/mo
- Projected year-2 tax
- $2,090 · $174/mo
- Expected delta
- $0/yr ($0/mo · 0.0%)
ⓘ Screening estimate from a state-policy table — verify with the county assessor before closing.
Climate risk First Street
- Flood 1/10 Low FEMA zone X (unshaded) · 0% chance over 30 yrs
- Wildfire 5/10 Major
- Heat 7/10 Severe 6 d/yr ≥104°F today · 16 d/yr by 30 yrs out
- Wind 1/10 Low
- Air quality 1/10 Low 0 unhealthy d/yr today · 0 by 30 yrs out
Nearby sold comps map
Loading sold comps map…
Walkable amenities ~0.75 mi
Loading nearby amenities…
Taxation est. · year 1
- Rental income
- $23,520
- − Mortgage interest
- −$14,452
- − Property taxes
- −$2,090
- − Insurance
- −$1,290
- − Repairs & maintenance
- −$1,882
- − Management
- −$1,882
- − Depreciation
- −$7,505
- Taxable loss
- −$5,581
- Est. tax savings @ 24.0%
- +$1,339
- After-tax cash flow
- $304/yr
For passive investors: Depreciation is non-cash, so a rental often shows a tax loss while cash-flowing — sheltering income. Rental losses are passive: they offset passive income freely, and up to $25,000/yr can offset ordinary (W-2) income if you actively participate and your MAGI is under $100k (phasing out to $0 by $150k); unused losses carry forward. On sale, claimed depreciation is recaptured at up to 25%, and gains may owe capital-gains tax (a 1031 exchange can defer both). Figures are a year-1 estimate at your 24.0% rate — not tax advice; consult a CPA.
Schools (NCES district)
- District
- Tucson Unified District (4403)
- NCES district ID
- 0408800
- Math proficiency
- 14% ▼ -17.00%
- Reading proficiency
- 23% ▼ -11.00%
- Median HH income
- $40,962
- Composite
- 15.78/100
- National rank
- #9270
- State rank
- #190 of 249 in AZ
Livability — Tucson
- Score
- 74/100
- State rank
- #17
- US rank
- #4502
Category grades
Schools grade is shown separately in the Schools card above.
Census & demographics
- Census place
- Tucson, AZ
- County
- Pima County · 1,012,107 people
- City population
- 839,336
- Metro
- Tucson, AZ
- Population (ZIP)
- 39,399
- Household income
- $62,090
- Rent vs Own
- Severe rent burden
- 1364.0
Population outlook (Pima County) Hauer SSP2
- Today (2025)
- 1,066,056 people
- By 2030
- 1,086,684 · +1.9%
- By 2040
- 1,117,160 · +4.8%
- By 2050
- 1,149,778 · +7.9%
- By 2075
- 1,271,480 · +19.3%
- By 2100
- 1,321,160 · +23.9%
Race, ethnicity, and origin ACS 2023
- Neighborhood character
- Diverse neighborhood (Simpson 0.62)
- Race & ethnicity
- White 53% Hispanic / Latino 31% Two or more races 16% Black 8% Asian 3% Native American 1%
- Hispanic origin (detail)
- Mexican 28%
- Common ancestry
- Romanian 2% Lithuanian 2% Slovak 2%
- Foreign-born
- 8% · Canada, Vietnam
- Languages at home
- 84% English-only · Spanish 13% Vietnamese 1%
Political lean MEDSL · Pima
- 2024 margin
- D (+15.2) · D 57.0% · R 41.8% · Other 1.2%
- 2008→2024 swing
- +9.1pp toward D · 2008: 6.1pp · 2024: 15.2pp
- All cycles
- 2024: D+15.2 2020: D+18.7 2016: D+13.5 2012: D+5.8 2008: D+6.1
Not yet ingested
- Civics
- —
Market trends
- HPI YoY
- ▼ -136.41%
- Current HPI
- 304.999
- Rent YoY
- ▼ -0.16%
- Metro
- Tucson, AZ
- State GDP YoY
- ▲ 4.54%
- F500 in state
- 20
Industry mix (Fortune 500 HQ in AZ)
| Industry | F500 HQs | Revenue |
|---|---|---|
| Technology | 2 | $13B |
|
||
| Mining / Metals | 1 | $23B |
|
||
| Environmental Services | 1 | $16B |
|
||
| Metals / Steel | 1 | $14B |
|
||
| Technology Distribution | 1 | $9B |
|
||
| Homebuilding | 1 | $8B |
|
||
Price history
+263.4% since first listed27 events — show timeline
- 2026-03-31 Listed $258,000 MLSSAZ
- 2026-03-27 Listing Removed — MLSSAZ
- 2026-03-06 Price Changed $275,000 MLSSAZ
- 2026-02-04 Listed $280,000 MLSSAZ
- 2025-08-12 Listing Removed — MLSSAZ
- 2025-06-30 Contingent — MLSSAZ
- 2025-06-16 Price Changed $285,000 MLSSAZ
- 2025-05-21 Listed $289,900 MLSSAZ
- 2025-05-14 Listing Removed — MLSSAZ
- 2025-05-09 Listed $289,900 MLSSAZ
- 2025-04-28 Listing Removed — MLSSAZ
- 2025-04-27 Listing Removed — MLSSAZ
- 2025-04-27 Listed $289,900 MLSSAZ
- 2025-01-28 Listed $289,900 MLSSAZ
- 2024-10-02 Listing Removed — MLSSAZ
- 2024-07-31 Listed $325,000 MLSSAZ
- 2024-03-05 Rental Removed $1,650 TARMLS
- 2023-11-22 Price Changed $1,650 TARMLS
- 2023-10-04 Listed for Rent $1,700 TARMLS
- 2020-12-01 Listing Removed — MLSSAZ
- 2020-09-11 Relisted — MLSSAZ
- 2020-07-09 Listing Removed — MLSSAZ
- 2020-06-23 Price Changed $204,900 MLSSAZ
- 2020-06-08 Relisted — MLSSAZ
- 2020-06-03 Listing Removed — MLSSAZ
- 2020-06-02 Listed $199,900 MLSSAZ
- 1980-10-17 Sold (Public Records) $71,000 Public Records
Property tax history
+2.7%/yrLatest (2025): $2,090 · +4.2% YoY. Source: county tax records.
Cash-flow waterfall
monthlySold comps — $/sqft
last 12 mo · ≤1 miLoading sold comps…