 🏗️ New Construction
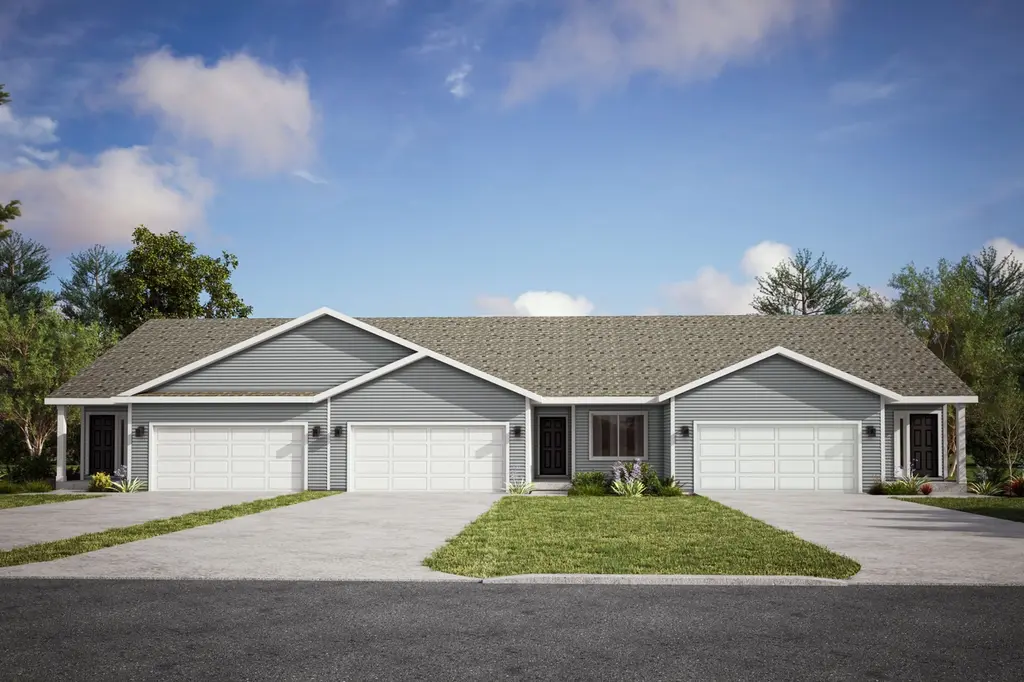
Monroe Plan · Norwalk, IA
Flood risk No data
- FEMA flood zone
- —
- Chance of flooding over 30 yrs
- —
- Est. flood insurance / yr
- —
Fire risk No data
- Est. fire insurance / yr
- —
Heat risk No data
- Hot days now (above threshold)
- —
- Hot days in 30 yrs
- —
Wind risk No data
- Chance of severe wind over 30 yrs
- —
Air-quality risk No data
- Unhealthy air days now
- —
- Unhealthy air days in 30 yrs
- —
Risk factors via First Street. Map © Google.
Why this score? — see what drove the F grade
The composite is a weighted blend of 9 inputs, each scored 0–100. Each bar is that input's sub-score; the figure is the points it added to the 100-point composite (weight × sub-score).
- ARV discount +7.5/15.0
- Schools +6.7/10.0
- Cash flow +4.1/30.0
- Livability +3.8/5.0
- Rent growth +2.5/5.0
- Condition / age +2.5/5.0
- 1% rule +0.3/10.0
- DSCR +0.0/10.0
- Appreciation +0.0/10.0
$268,200
🖨 Deal sheet (PDF) 📄 Offer letter ✓ Due diligence
Listing remarks MLS
The Monroe floorplan features the best of main level living. A large great room and dining room combination that wraps around to the kitchen-perfect for entertaining. The primary suite is spacious and connects to an en-suite and large walk-in closet. An additional bedroom, bathroom, laundry room, patio, and 2-car garage complete the main level.
Key facts
- 2 garage spots
- Listed 412 days
Neighborhood map
What this means for you Summary
Snapshot
- This is a 2-bed/2.0-bath single-family listed at $268k.
Deal economics
- At list price, monthly cash flow is $-1k ($-12k/yr) — negative.
- To cash-flow at today's rent, offer at most $224k (16.4% below list).
- To meet the 1% rule (rent ≥ 1% of price), the offer needs to be $196k (26.9% below list).
- Recommended offer: $196k (26.9% below list) — sets the bar for 1% rule.
Location & tenants
- Location reads 76/100 on livability (#187 in IA, #3,367 nationally) — a middle-class / working-renter tenant base. Strengths: crime A+, employment A+, cost of living A+; Watch: amenities F, commute F, health & safety F.
- Norwalk Community School District (suburban): math 76% / reading 76% proficiency, ranked #39 of 289 in IA (top 14%) — strong family-tenant draw, lease renewals of 3-5y typical; only 14% free/reduced lunch — higher-income household profile.
- Zoned schools: Oviatt Elementary School (616 students, 22% FRL); Norwalk Middle School (math 76% / reading 75%, grade A, #65 of 246 statewide, top 29%, 787 students, 21% FRL); Norwalk Senior High School (math 72% / reading 79%, grade A-, #79 of 336 statewide, top 25%, 1,035 students, 19% FRL).
- Market conditions: 438 active listings in the ZIP; 4 comparable units currently listed for rent nearby; rentals lingering (median 46d on market — plan ~5-8 weeks vacancy on turnover, expect pricing pressure); 50% of comp listings sitting > 30 days — soft ceiling on asking rent; solid renter incomes; 439 units permitted in Warren County in 2024 (0 in 5+ unit buildings).
Forward outlook
- Local home prices are declining (-3.0%/yr); year-one equity from $3k of loan paydown is wiped out by about $11k of value loss. Plan a longer hold.
- Warren County population projected at +22% by 2050 — long-run rental-demand tailwind backs the buy-and-hold thesis.
Negotiation context
- It's been on market 412 days — a 12% lower offer ($236k) is reasonable based on typical stale-listing flexibility.
Questions for the listing agent
- What do current leases actually rent for vs. the listed asking? Can we see a recent rent roll and the last 12 months of T-12 income?
- It's been on market 412 days. Have you received any prior offers? Is the seller open to a 27% concession, seller financing, or rate buy-down credit?
- Why hasn't it sold? Are there any deal-killer items the seller is aware of (foundation, flood, title, zoning, code violations)?
- Is there a deadline driving the sale (1031 exchange, divorce, estate, relocation)? That informs how much negotiation room exists.
- Schools are A-rated — typically a magnet for longer-tenancy family renters. What's the average tenant stay here, and is there a school-zone premium baked into asking?
- The area grade is low — what's the realistic commute time and amenity access for the typical tenant pool here? Any planned neighborhood developments (good or bad) we should know about?
- What's the average days-on-market for RENTAL listings here right now (not sales)? A rising rental-DOM trend means longer vacancies and softer asking-rent achievability than the comps imply.
- What's the recent tenant-quality profile in this submarket — average credit score on applications, eviction rate, late-payment / NSF rate, and stable-employment percentage? A property-management company in the area should have these aggregated.
- How much new for-sale + rental construction is in the pipeline within 1–3 miles? Heavy new supply typically softens prices + rents 12–24 months out; constrained supply supports both.
Investment metrics
- 1% rule
- 0.53% ✗
- Cap rate
- 2.99%
- Cash-on-cash
- -11.80%
- DSCR
- 0.48
- GRM
- 15.8
CMA / ARV
- ARV (median comp)
- $372,615
- List price
- $268,200
- Delta
- -28.02%
- Verdict
- UNDERPRICED
- Comps
- 20 within 1.0 mi
Show comp detail 12 sales within ~0.75 mi
| Address | Dist | Beds/Ba | Sqft | Sold | Price | $/sf | Match |
|---|---|---|---|---|---|---|---|
| 3026 Myron St | 0.10mi | 3/2.0 (+1) | 1,390 (+10%) | 2mo | $389,885 | $280 | 71 |
| 2005 Waller Ave | 0.10mi | 3/2.0 (+1) | 1,408 (+12%) | 10mo | $354,900 | $252 | 62 |
| 2013 Waller Ave | 0.08mi | 3/2.0 (+1) | 1,427 (+13%) | 11mo | $365,150 | $256 | 60 |
| 9330 Bellflower Ln | 0.14mi | 3/3.0 (+1) | 1,410 (+12%) | 6mo | $512,000 | $363 | 60 |
| 1919 Waller Ave | 0.12mi | 3/2.0 (+1) | 1,408 (+12%) | 14mo | $357,040 | $254 | 58 |
| 2001 Waller Ave | 0.11mi | 3/2.0 (+1) | 1,435 (+14%) | 12mo | $359,990 | $251 | 57 |
| 2910 Lund St | 0.14mi | 3/2.0 (+1) | 1,411 (+12%) | 14mo | $352,000 | $249 | 56 |
| 3009 Lund St | 0.14mi | 3/2.0 (+1) | 1,408 (+12%) | 15mo | $374,990 | $266 | 56 |
| 1906 Waller Ave | 0.16mi | 3/2.0 (+1) | 1,427 (+13%) | 13mo | $414,990 | $291 | 55 |
| 2908 Sayre Dr | 0.18mi | 3/2.0 (+1) | 1,433 (+14%) | 11mo | $347,100 | $242 | 54 |
| 9113 Woodmayr Dr | 0.75mi | 3/2.0 (+1) | 1,125 (-11%) | 7mo | $257,500 | $229 | 36 |
| 4281 Wakonda Dr | 0.71mi | 3/1.5 (+1) | 1,095 (-13%) | 6mo | $205,000 | $187 | 33 |
Match score weights: distance 35% · size 25% · config 20% · recency 20%. Top-matched comps best support the ARV.
Projected returns pro-forma
-3.0% appreciation · 3.0% rent growth · sell at horizon
- IRR
- -38.0%
- Equity multiple
- -0.20×
- Total profit
- $-125,675
- Equity at exit
- $55,558
- IRR
- -56.4%
- Equity multiple
- -0.85×
- Total profit
- $-193,431
- Equity at exit
- $32,217
Cash invested: $104,332 (down + closing). Projections, not guarantees.
Landlord ↔ Tenant lean methodology
- Overall (STATE)
- 83 Strongly Landlord-Friendly
- State Iowa
- 83 Strongly Landlord-Friendly · R+6
- County
- — inherits STATE
- City
- — inherits STATE
ZIP-level market 50211
- Active inventory
- 438
- Price-to-rent
- 11.4×
Monthly cashflow live
- Estimated rent
- $1,961 medium interval (Pro) →
- Mortgage (P&I)
- −$1,954
- Tax est. 1.5%
- −$466 /mo · $5,589/yr
- Insurance
- −$155
- HOA
- −$0
- Vacancy / Maint / Mgmt
- −$412
- Net cashflow
- $-1,026
Break-even live
Sensitivity live
| Price | -10% $-768 | -5% $-897 | +0% $-1,026 | +5% $-1,154 | +10% $-1,283 |
|---|---|---|---|---|---|
| Rent | -10% $-1,181 | -5% $-1,103 | +0% $-1,026 | +5% $-948 | +10% $-871 |
| Rate | -1.0pp $-838 | -0.5pp $-931 | base $-1,026 | +0.5pp $-1,122 | +1.0pp $-1,220 |
UW: 25.0% down · 7.5% · 30yr · 1.5% tax · 5.0% vac · 8.0% maint · 8.0% mgmt
Financing live
Cash to close
- Down payment
- $93,154
- Closing costs
- $11,178
- Reserves months
- —
- Total cash needed
- —
Loan-product check · same deal, 3 products live
Conventional
25% down · 7.5% · 30yr
- Down + closing
- —
- Monthly P&I
- —
- Monthly cashflow
- —
- DSCR
- —
- Eligible?
- —
Personal DTI + credit; lowest rate.
DSCR
20% down · 8.5% · 30yr
- Down + closing
- —
- Monthly P&I
- —
- Monthly cashflow
- —
- DSCR
- —
- Eligible?
- —
No personal income docs; deal must DSCR.
Hard money
10% down · 12.0% · 12mo
- Down + closing
- —
- Monthly P&I
- —
- Monthly cashflow
- —
- DSCR
- —
- Eligible?
- —
Short-term bridge; refi at stabilization.
Rent comps 4 comps
| Address | Beds | Baths | Sqft | Rent | $/sqft | DOM | Units | Dist |
|---|---|---|---|---|---|---|---|---|
| 3026 Myron St Norwalk, IA | 3.0 | 2.0 | 1390 | $2,350 | $1.69 | 45d | 1 | 0.11mi |
| 1707 Ashwood Ave Norwalk, IA | 3.0 | 2.5 | 1588 | $2,195 | $1.38 | 45d | 1 | 0.88mi |
| 1451 High Rd Norwalk, IA | 3.0 | 2.5 | 1564 | $1,970 | $1.26 | 4d | 2 | 1.05mi |
| 901 E 17th St Norwalk, IA | 1.0–3.0 | 1.0 | 820 | $1,038 | $1.27 | 4d | 3 | 1.46mi |
Listing history 20 events
-
2026-06-21days on market $268,200 Active 412 DOM
-
2026-06-18days on market $268,200 Active 409 DOM
-
2026-06-17days on market $268,200 Active 408 DOM
-
2026-06-16days on market $268,200 Active 407 DOM
-
2026-06-15days on market $268,200 Active 406 DOM
-
2026-06-14days on market $268,200 Active 404 DOM
-
2026-06-13days on market $268,200 Active 403 DOM
-
2026-06-10days on market $268,200 Active 401 DOM
-
2026-06-09days on market $268,200 Active 400 DOM
-
2026-06-08days on market $268,200 Active 399 DOM
-
2026-06-07days on market $268,200 Active 398 DOM
-
2026-06-05days on market $268,200 Active 395 DOM
-
2026-06-03days on market $268,200 Active 394 DOM
-
2026-06-02days on market $268,200 Active 393 DOM
-
2026-06-01days on market $268,200 Active 392 DOM
-
2026-05-31days on market $268,200 Active 391 DOM
-
2026-05-31days on market $268,200 Active 390 DOM
-
2026-04-04price $268,200 346-char remark
Show marketing remark (346 chars)
The Monroe floorplan features the best of main level living. A large great room and dining room combination that wraps around to the kitchen-perfect for entertaining. The primary suite is spacious and connects to an en-suite and large walk-in closet. An additional bedroom, bathroom, laundry room, patio, and 2-car garage complete the main level.
-
2025-09-10price $312,800 346-char remark
Show marketing remark (346 chars)
The Monroe floorplan features the best of main level living. A large great room and dining room combination that wraps around to the kitchen-perfect for entertaining. The primary suite is spacious and connects to an en-suite and large walk-in closet. An additional bedroom, bathroom, laundry room, patio, and 2-car garage complete the main level.
-
2025-05-06$294,900 Active 346-char remark
Show marketing remark (346 chars)
The Monroe floorplan features the best of main level living. A large great room and dining room combination that wraps around to the kitchen-perfect for entertaining. The primary suite is spacious and connects to an en-suite and large walk-in closet. An additional bedroom, bathroom, laundry room, patio, and 2-car garage complete the main level.
ⓘ Source: listings_history table (triggers on properties + properties_extension) + one-shot
backfill from property_details.listing_events for pre-trigger history.
Nearby sold comps map
Loading sold comps map…
Walkable amenities ~0.75 mi
Loading nearby amenities…
Taxation est. · year 1
- Rental income
- $23,535
- − Mortgage interest
- −$20,872
- − Property taxes
- −$5,589
- − Insurance
- −$1,863
- − Repairs & maintenance
- −$1,883
- − Management
- −$1,883
- − Depreciation
- −$10,840
- Taxable loss
- −$19,395
- Est. tax savings @ 24.0%
- +$4,655
- After-tax cash flow
- $-7,653/yr
For passive investors: Depreciation is non-cash, so a rental often shows a tax loss while cash-flowing — sheltering income. Rental losses are passive: they offset passive income freely, and up to $25,000/yr can offset ordinary (W-2) income if you actively participate and your MAGI is under $100k (phasing out to $0 by $150k); unused losses carry forward. On sale, claimed depreciation is recaptured at up to 25%, and gains may owe capital-gains tax (a 1031 exchange can defer both). Figures are a year-1 estimate at your 24.0% rate — not tax advice; consult a CPA.
Schools (NCES district)
- District
- Norwalk Community School District
- NCES district ID
- 1921240
- Math proficiency
- 76% ▼ -6.00%
- Reading proficiency
- 76% ▼ -2.00%
- Median HH income
- $76,652
- Composite
- 66.9/100
- National rank
- #401
- State rank
- #39 of 289 in IA
Livability — Norwalk
- Score
- 76/100
- State rank
- #187
- US rank
- #3367
Category grades
Schools grade is shown separately in the Schools card above.
Census & demographics
- Census place
- Norwalk, IA
- County
- Warren County · 16,835 people
- City population
- 16,835
- Metro
- Des Moines-West Des Moines, IA
- Population (ZIP)
- 16,835
- Household income
- $103,712
- Rent vs Own
- Severe rent burden
- 157.0
Population outlook (Warren County) Hauer SSP2
- Today (2025)
- 54,222 people
- By 2030
- 56,863 · +4.9%
- By 2040
- 61,691 · +13.8%
- By 2050
- 65,939 · +21.6%
- By 2075
- 75,626 · +39.5%
- By 2100
- 80,425 · +48.3%
Race, ethnicity, and origin ACS 2023
- Neighborhood character
- Predominantly White (93%)
- Race & ethnicity
- White 93% Two or more races 3% Hispanic / Latino 2%
- Common ancestry
- Portuguese 4% Italian 3% Iranian 3%
- Foreign-born
- 1% · Canada
- Languages at home
- 99% English-only · Spanish 1%
Political lean MEDSL · Warren
- 2024 margin
- Strong R (+20.7) · D 38.9% · R 59.7% · Other 1.4%
- 2008→2024 swing
- -21.4pp toward R · 2008: 0.6pp · 2024: -20.7pp
- All cycles
- 2024: R+20.7 2020: R+16.8 2016: R+16.4 2012: R+2.0 2008: D+0.6
Not yet ingested
- Civics
- —
Market trends
- HPI YoY
- ▼ -158.74%
- Current HPI
- 206.2899
- Rent YoY
- —
- Metro
- Des Moines-West Des Moines, IA
- State GDP YoY
- ▲ 2.48%
- F500 in state
- 4
Industry mix (Fortune 500 HQ in IA)
| Industry | F500 HQs | Revenue |
|---|---|---|
| Financial Services | 1 | $16B |
|
||
| Retail / Convenience | 1 | $15B |
|
||
Price history
-9.1% since first listed3 events — show timeline
- 2026-04-04 Price Changed $268,200 Zillow
- 2025-09-10 Price Changed $312,800 Zillow
- 2025-05-06 Listed $294,900 Zillow
Cash-flow waterfall
monthlySold comps — $/sqft
last 12 mo · ≤1 miLoading sold comps…