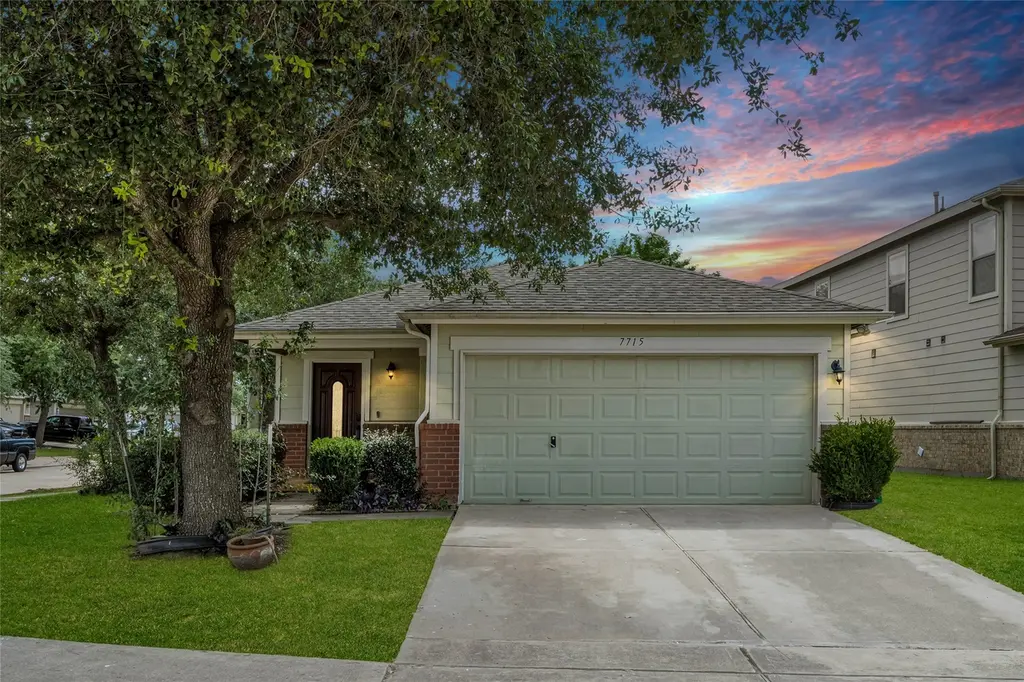
7715 Sagemark Ridge Dr · Houston, TX
Flood risk 5/10 · Moderate
- FEMA flood zone
- X (unshaded)
- Chance of flooding over 30 yrs
- 0.67%
- Est. flood insurance / yr
- $507 – $1,088
Fire risk 4/10 · Minor
- Est. fire insurance / yr
- $1,222 – $2,270
Heat risk 9/10 · Severe
- Hot days now (above 110°F)
- 7 days/yr
- Hot days in 30 yrs
- 23 days/yr
Wind risk 8/10 · Major
- Chance of severe wind over 30 yrs
- 99.0%
Air-quality risk 2/10 · Minimal
- Unhealthy air days now
- 2 days/yr
- Unhealthy air days in 30 yrs
- 2 days/yr
Risk factors via First Street. Map © Google.
Why this score? — see what drove the D- grade
The composite is a weighted blend of 9 inputs, each scored 0–100. Each bar is that input's sub-score; the figure is the points it added to the 100-point composite (weight × sub-score).
- Cash flow +10.7/30.0
- ARV discount +9.2/15.0
- Schools +4.4/10.0
- 1% rule +4.1/10.0
- Livability +3.7/5.0
- DSCR +3.1/10.0
- Condition / age +2.5/5.0
- Rent growth +2.2/5.0
- Appreciation +0.0/10.0
$255,000
🖨 Deal sheet (PDF) 📄 Offer letter ✓ Due diligence
Listing remarks
Welcome to 7715 Sagemark Ridge Drive in Canyon Village at Cypress Springs, where modern updates, curb appeal, and comfort come together beautifully. On a corner lot with a mature shade tree, this one-story ranch-style home features a brick and cement board exterior, double-wide driveway, and gutters. Inside, fresh paint, engineered wood flooring in the main living area, and brand-new plush carpet in all bedrooms make this home truly move-in ready. The updated kitchen shines with new, white sparkly quartz countertops, white subway tile backsplash, stainless steel appliances, matte black faucet, and a stylish chandelier over the island. A breakfast bar opens the kitchen to the living area for
Key facts
- Mature shade tree
- Fresh paint
- Double-wide driveway
Tags
Property features AI
Finance
- HOA & community: Community association (Spectrum Association Management); Annual association fee of $550; Association amenities include pool, playground, park; Association fee covers recreation facilities; Community features include community pool, curbs, gutters
Exterior
- Parking: Attached garage; 2 garage spaces; Driveway
- Utilities: Public water; Public sewer
- Home design: Residential property; Faces northeast; Built in 2008; Slab foundation
- Construction: Brick and cement siding; Composition roof
- Exterior features: Backyard fence; Porch; Private yard; Storage shed(s); Corner lot; Subdivision setting; Backs to greenbelt/park; Concrete road surface
Interior
- Kitchen: Dishwasher; Disposal; Gas oven; Gas range
- Bedrooms: Primary bedroom (First floor); Bedroom (First floor); Bedroom (First floor); Up to 3 possible bedrooms total
- Flooring: Carpet; Engineered hardwood; Laminate; Tile
- Bathrooms: 2 full bathrooms; Primary bathroom (First floor)
- Heating & cooling: Central heating (gas); Central air (electric)
- Interior features: Breakfast bar; Double vanity; Entrance foyer; Granite counters; Kitchen island; Kitchen/family room combo; Pantry; Tub with shower; Window treatments; Ceiling fan(s); Programmable thermostat; Insulated doors; Window coverings
- Laundry & utility: Washer hookup; Electric dryer hookup; Utility room (First floor)
Neighborhood map
What this means for you Summary
Snapshot
- This is a 3-bed/2.0-bath single-family listed at $255k.
Deal economics
- At list price, monthly cash flow is $-120 ($-1k/yr) — negative.
- To cash-flow at today's rent, offer at most $234k (8.3% below list).
- To meet the 1% rule (rent ≥ 1% of price), the offer needs to be $233k (8.7% below list).
- Recommended offer: $233k (8.7% below list) — sets the bar for 1% rule.
- Cap rate 5.7% vs local median 3.2% in Houston — top-decile yield for the area; either an underpriced asset or a hidden risk that comps aren't pricing in. Stress-test before assuming the spread holds.
Location & tenants
- Location reads 74/100 on livability (#184 in TX, #4,771 nationally) — a middle-class / working-renter tenant base. Strengths: amenities A+, cost of living A+, housing A+; Watch: crime F.
- Cypress-Fairbanks ISD (suburban): math 45% / reading 52% proficiency, ranked #161 of 826 in TX (top 20%) — families likely to look elsewhere, expect single-tenant / working-renter base with shorter leases.
- Zoned schools: Walker El (math 23% / reading 38%, grade F, #2,464 of 4,322 statewide, top 58%, 1,025 students, 77% FRL); Hopper Middle (math 24% / reading 34%, grade F, #1,103 of 1,662 statewide, top 67%, 930 students, 80% FRL); Cypress Springs H S (math 35% / reading 60%, grade D, #583 of 1,632 statewide, top 36%, 2,788 students, 68% FRL) — zoned schools average 75% FRL vs 43% district-wide (32 pts higher); higher-poverty schools than district average — tighter screening recommended.
- Zoned-school proficiency averages 36% at this address vs 48% district-wide (-13 pts) — the specific schools serving this property underperform the Cypress-Fairbanks ISD average; the district grade overstates school quality for this exact location.
- Market conditions: Rents soft (-1.3%/yr); 2065 active listings in the ZIP; 34 comparable units currently listed for rent nearby; rentals lingering (median 46d on market — plan ~5-8 weeks vacancy on turnover, expect pricing pressure); 53% of comp listings sitting > 30 days — soft ceiling on asking rent; high-income renter base; 29,883 units permitted in Harris County in 2024 (8,621 in 5+ unit buildings).
Forward outlook
- Local home prices are declining (-3.0%/yr); year-one equity from $2k of loan paydown is wiped out by about $8k of value loss. Plan a longer hold.
- Harris County population projected at +47% by 2050 — long-run rental-demand tailwind backs the buy-and-hold thesis.
Negotiation context
- It's been on market 47 days — a 3% lower offer ($247k) is reasonable based on typical stale-listing flexibility.
- 9 sale attempts since 17y ago; this cycle's ask has dropped $15k (6%) from the opening price — seller is motivated, your offer sets the floor, not the list.
Risks & watch-outs
- Climate carrying-cost: moderate flood risk; severe wind risk, 99% chance of damaging wind over 30y; extreme-heat days projected 7→23/yr by 2055 (HVAC capex compounding) — expect insurance premiums to compound above CPI over the hold.
Questions for the listing agent
- What do current leases actually rent for vs. the listed asking? Can we see a recent rent roll and the last 12 months of T-12 income?
- It's been on market 47 days. Have you received any prior offers? Is the seller open to a 9% concession, seller financing, or rate buy-down credit?
- What does the HOA fee cover, when was the last increase, and are there any pending special assessments or reserve-fund shortfalls?
- Is there a deadline driving the sale (1031 exchange, divorce, estate, relocation)? That informs how much negotiation room exists.
- Schools are D-rated, which usually means shorter tenancies and higher turnover. Who's the typical renter profile here, and what's been the actual vacancy rate?
- Crime grade is F in this area — have there been break-ins, vandalism, or insurance claims at this property in the last 3 years? What carrier currently insures it and at what premium?
- The area grade is low — what's the realistic commute time and amenity access for the typical tenant pool here? Any planned neighborhood developments (good or bad) we should know about?
- What's the average days-on-market for RENTAL listings here right now (not sales)? A rising rental-DOM trend means longer vacancies and softer asking-rent achievability than the comps imply.
- What's the recent tenant-quality profile in this submarket — average credit score on applications, eviction rate, late-payment / NSF rate, and stable-employment percentage? A property-management company in the area should have these aggregated.
- How much new for-sale + rental construction is in the pipeline within 1–3 miles? Heavy new supply typically softens prices + rents 12–24 months out; constrained supply supports both.
Investment metrics
- 1% rule
- 0.91% ✗
- Cap rate
- 5.73%
- Cash-on-cash
- -2.01%
- DSCR
- 0.91
- GRM
- 9.1
CMA / ARV
- ARV (median comp)
- $264,848
- List price
- $255,000
- Delta
- -3.72%
- Verdict
- FAIR
- Comps
- 20 within 1.0 mi
Show comp detail 12 sales within ~0.75 mi
| Address | Dist | Beds/Ba | Sqft | Sold | Price | $/sf | Match |
|---|---|---|---|---|---|---|---|
| 7554 Appleberry Dr | 0.19mi | 3/2.0 | 1,812 (+5%) | 2mo | $275,000 | $152 | 81 |
| 7806 Coco Verde Dr | 0.36mi | 3/2.0 | 1,679 (-3%) | 1mo | $329,000 | $196 | 78 |
| 7514 Appleberry Dr | 0.28mi | 3/2.0 | 1,605 (-7%) | 4mo | $237,800 | $148 | 72 |
| 20519 Holly Barr Ln | 0.45mi | 3/2.5 | 1,751 (+2%) | 4mo | $269,999 | $154 | 71 |
| 20730 Cypress Crescent Ln | 0.11mi | 3/2.5 | 1,967 (+14%) | 4mo | $270,000 | $137 | 66 |
| 7402 Bering Landing Dr | 0.57mi | 3/2.0 | 1,630 (-5%) | 0mo | $249,990 | $153 | 64 |
| 21119 Sherrell Bay Dr | 0.59mi | 4/3.0 (+1) | 1,712 (-1%) | 3mo | $330,000 | $193 | 60 |
| 21043 Salt Rock Dr | 0.36mi | 4/2.5 (+1) | 1,900 (+10%) | 3mo | $344,900 | $182 | 57 |
| 7507 Sendera Oaks Ct | 0.59mi | 3/2.0 | 1,558 (-10%) | 1mo | $235,000 | $151 | 56 |
| 7606 Blue Coast Ct | 0.62mi | 3/2.5 | 1,852 (+8%) | 2mo | $312,995 | $169 | 55 |
| 21106 Garden Palm Dr | 0.39mi | 3/2.5 | 1,948 (+13%) | 4mo | $315,000 | $162 | 55 |
| 20022 Rustic Lake Ln | 0.67mi | 4/2.0 (+1) | 1,905 (+11%) | 2mo | $252,000 | $132 | 44 |
Match score weights: distance 35% · size 25% · config 20% · recency 20%. Top-matched comps best support the ARV.
Projected returns pro-forma
-3.0% appreciation · 0.0% rent growth · sell at horizon
- IRR
- -23.4%
- Equity multiple
- 0.22×
- Total profit
- $-55,603
- Equity at exit
- $38,021
- IRR
- -31.0%
- Equity multiple
- -0.18×
- Total profit
- $-83,959
- Equity at exit
- $22,048
Cash invested: $71,400 (down + closing). Projections, not guarantees.
Landlord ↔ Tenant lean methodology
- Overall (STATE)
- 87 Strongly Landlord-Friendly
- State Texas
- 87 Strongly Landlord-Friendly · R+5
- County
- — inherits STATE
- City
- — inherits STATE
ZIP-level market 77433
- Home prices YoY
- -28.5%
- Rents YoY
- -1.3%
- Active inventory
- 2065
- Price-to-rent
- 9.1×
Monthly cashflow live
- Estimated rent
- $2,328 high interval (Pro) →
- Mortgage (P&I)
- −$1,337
- Tax from tax record
- −$469 /mo · $5,631/yr
- Insurance
- −$106
- HOA
- −$46
- Vacancy / Maint / Mgmt
- −$489
- Net cashflow
- $-120
Break-even live
Sensitivity live
| Price | -10% $25 | -5% $-47 | +0% $-120 | +5% $-192 | +10% $-264 |
|---|---|---|---|---|---|
| Rent | -10% $-303 | -5% $-212 | +0% $-120 | +5% $-28 | +10% $64 |
| Rate | -1.0pp $9 | -0.5pp $-55 | base $-120 | +0.5pp $-186 | +1.0pp $-253 |
UW: 25.0% down · 7.5% · 30yr · 1.5% tax · 5.0% vac · 8.0% maint · 8.0% mgmt
Financing live
Cash to close
- Down payment
- $63,750
- Closing costs
- $7,650
- Reserves months
- —
- Total cash needed
- —
Loan-product check · same deal, 3 products live
Conventional
25% down · 7.5% · 30yr
- Down + closing
- —
- Monthly P&I
- —
- Monthly cashflow
- —
- DSCR
- —
- Eligible?
- —
Personal DTI + credit; lowest rate.
DSCR
20% down · 8.5% · 30yr
- Down + closing
- —
- Monthly P&I
- —
- Monthly cashflow
- —
- DSCR
- —
- Eligible?
- —
No personal income docs; deal must DSCR.
Hard money
10% down · 12.0% · 12mo
- Down + closing
- —
- Monthly P&I
- —
- Monthly cashflow
- —
- DSCR
- —
- Eligible?
- —
Short-term bridge; refi at stabilization.
Rent comps 34 comps
| Address | Beds | Baths | Sqft | Rent | $/sqft | DOM | Units | Dist |
|---|---|---|---|---|---|---|---|---|
| 21010 Treasure Gate Ln Cypress, TX | 4.0 | 2.0 | 2157 | $2,768 | $1.28 | 45d | 1 | 0.27mi |
| 21038 Treasure Gate Ln Cypress, TX | 4.0 | 2.5 | 1804 | $2,676 | $1.48 | 45d | 1 | 0.33mi |
| 21054 Montego Breeze Ln Cypress, TX | 3.0–5.0 | 2.0–3.5 | 1935 | $2,199 | $1.14 | 14d | 21 | 0.34mi |
| 20519 Keegans Ledge Ln Cypress, TX | 4.0 | 3.0 | 1907 | $2,100 | $1.10 | 45d | 1 | 0.54mi |
| 7310 Coconut Bay Dr Cypress, TX | 4.0 | 2.0 | 1620 | $2,307 | $1.42 | 45d | 1 | 0.55mi |
| 21034 Shore Oak Dr Cypress, TX | 4.0 | 3.0 | 2110 | $2,950 | $1.40 | 45d | 1 | 0.57mi |
| 21114 Montego Bay Dr Cypress, TX | 3.0 | 2.5 | 2124 | $2,499 | $1.18 | 45d | 1 | 0.59mi |
| 21038 Bay Village Dr Cypress, TX | 4.0 | 2.5 | 1904 | $2,491 | $1.31 | 45d | 1 | 0.61mi |
| 20126 Breezy Oak Ct Cypress, TX | 3.0 | 2.0 | 1667 | $2,100 | $1.26 | 6d | 1 | 0.63mi |
| 20211 Longenbaugh Rd Cypress, TX | 1.0–3.0 | 1.0–2.0 | 1065 | $2,500 | $2.35 | 0d | 25 | 0.65mi |
| 20217 Longenbaugh Rd Cypress, TX | 2.0 | 2.0 | 1112 | $1,565 | $1.41 | 45d | 1 | 0.71mi |
| 7546 Coral Terrace Dr Cypress, TX | 3.0 | 2.5 | 2050 | $2,699 | $1.32 | 45d | 1 | 0.74mi |
| 19943 Crested Hill Ln Cypress, TX | 3.0 | 2.0 | 1204 | $1,621 | $1.35 | 9d | 1 | 0.76mi |
| 21235 Catalina Palm Dr Cypress, TX | 4.0 | 2.0 | 1756 | $2,600 | $1.48 | 45d | 1 | 0.77mi |
| 21054 Breezeway Cove Dr Bridgeland, TX | 3.0–4.0 | 2.5–3.5 | 1784 | $2,450 | $1.37 | 1d | 41 | 0.78mi |
| 20123 Braley Ct Cypress, TX | 3.0 | 2.5 | 1726 | $1,976 | $1.14 | 1d | 1 | 0.78mi |
| 19939 Longenbaugh Rd Cypress, TX | 1.0–2.0 | 1.0–2.0 | 933 | $2,105 | $2.26 | 3d | 15 | 0.81mi |
| 7911 Tuscan Cypress Dr Cypress, TX | 4.0 | 3.0 | 1730 | $2,475 | $1.43 | 45d | 1 | 0.85mi |
| 19917 Stoney Haven Dr Cypress, TX | 2.0 | 1.5 | 1060 | $1,579 | $1.49 | 45d | 1 | 0.92mi |
| 19758 Crossfalls Ln Cypress, TX | 4.0 | 2.5 | 2156 | $2,070 | $0.96 | 46d | 1 | 1.02mi |
| 20735 Dewberry Creek Ln Katy, TX | 4.0 | 2.0 | 1609 | $1,756 | $1.09 | 23d | 1 | 1.03mi |
| 6810 N Fry Rd Katy, TX | 1.0–3.0 | 1.0–3.0 | 1151 | $2,683 | $2.33 | 1d | 58 | 1.10mi |
| 7850 Maverick Trace Ln Cypress, TX | 3.0 | 3.0 | 1852 | $1,875 | $1.01 | 45d | 1 | 1.11mi |
| 19903 Mountain Dale Dr Cypress, TX | 3.0 | 2.0 | 1356 | $1,896 | $1.40 | 1d | 1 | 1.15mi |
| 21035 Carmel Valley Dr Katy, TX | 3.0 | 2.0 | 1431 | $1,791 | $1.25 | 26d | 1 | 1.16mi |
| 19715 Swan Valley Dr Cypress, TX | 3.0 | 2.0 | 1380 | $1,886 | $1.37 | 45d | 1 | 1.23mi |
| 20507 Barker Bend Ct Katy, TX | 3.0 | 2.0 | 1488 | $1,825 | $1.23 | 45d | 1 | 1.25mi |
| 19738 Tacoma Bluff Dr Cypress, TX | 4.0 | 2.5 | 2238 | $5,000 | $2.23 | 23d | 1 | 1.25mi |
| 7558 Magnolia Orchid Ln Cypress, TX | 4.0 | 2.5 | 1743 | $2,390 | $1.37 | 45d | 1 | 1.26mi |
| 6642 High Stone Ln Katy, TX | 4.0 | 2.0 | 2091 | $1,999 | $0.96 | 45d | 1 | 1.33mi |
| 21447 FM 529 Rd Cypress, TX | 1.0–3.0 | 1.0–2.0 | 996 | $2,205 | $2.21 | 1d | 28 | 1.35mi |
| 6506 Garden Canyon Dr Katy, TX | 3.0 | 2.0 | 1842 | $1,895 | $1.03 | 23d | 1 | 1.38mi |
| 6619 Rusty Ridge Ln Katy, TX | 3.0 | 2.5 | 1450 | $1,895 | $1.31 | 5d | 1 | 1.44mi |
| 19442 Elmtree Estates Dr Katy, TX | 3.0 | 2.0 | 1735 | $1,776 | $1.02 | 14d | 1 | 1.45mi |
HOA detail
- Monthly dues
- $46 · $552/yr
Listing history 37 events
-
2026-06-21days on market $255,000 Active 47 DOM
-
2026-06-18days on market $255,000 Active 44 DOM
-
2026-06-18price $255,000 Active 43 DOM
-
2026-06-17days on market $265,000 Active 43 DOM
-
2026-06-16days on market $265,000 Active 42 DOM
-
2026-06-15days on market $265,000 Active 41 DOM
-
2026-06-13days on market $265,000 Active 39 DOM
-
2026-06-13days on market $265,000 Active 38 DOM
-
2026-06-09days on market $265,000 Active 35 DOM
-
2026-06-08days on market $265,000 Active 34 DOM
-
2026-06-07days on market $265,000 Active 33 DOM
-
2026-06-04days on market $265,000 Active 30 DOM
-
2026-06-03days on market $265,000 Active 29 DOM
-
2026-06-02days on market $265,000 Active 28 DOM
-
2026-06-02pricedays on market $265,000 Active 27 DOM
-
2026-05-31days on market $270,000 Active 26 DOM
-
2026-05-05$270,000 Active 998-char remark
-
2025-01-24historical $1,850
-
2025-01-24historical
-
2025-01-15$1,850
-
2025-01-13$260,000 Active
-
2025-01-07historical $1,850
-
2025-01-06historical
-
2024-12-11status Active
-
2024-12-04status Option Pending
-
2024-12-03status Active
-
2024-11-28status Option Pending
-
2024-11-18$265,000 Active
-
2024-11-09$1,850
-
2020-08-07soldstatus
-
2020-08-06soldstatus Sold
-
2020-07-13status Pending
-
2020-07-06status Option Pending
-
2020-07-01$182,000 Active
-
2009-04-13soldstatus
-
2009-02-27historical
-
2009-02-13$103,952
ⓘ Source: listings_history table (triggers on properties + properties_extension) + one-shot
backfill from property_details.listing_events for pre-trigger history.
Tax reassessment forecast TX · Resets to sale price
- Current annual tax
- $5,631 · $469/mo
- Projected year-2 tax
- $5,631 · $469/mo
- Expected delta
- $0/yr ($0/mo · 0.0%)
ⓘ Screening estimate from a state-policy table — verify with the county assessor before closing.
Climate risk First Street
- Flood 5/10 Major FEMA zone X (unshaded) · 67% chance over 30 yrs
- Wildfire 4/10 Moderate
- Heat 9/10 Extreme 7 d/yr ≥110°F today · 23 d/yr by 30 yrs out
- Wind 8/10 Severe 99% chance of damaging wind over 30 yrs
- Air quality 2/10 Low 2 unhealthy d/yr today · 2 by 30 yrs out
Nearby sold comps map
Loading sold comps map…
Walkable amenities ~0.75 mi
Loading nearby amenities…
Taxation est. · year 1
- Rental income
- $27,937
- − Mortgage interest
- −$14,284
- − Property taxes
- −$5,631
- − Insurance
- −$1,275
- − Repairs & maintenance
- −$2,235
- − Management
- −$2,235
- − HOA
- −$552
- − Depreciation
- −$7,418
- Taxable loss
- −$5,693
- Est. tax savings @ 24.0%
- +$1,366
- After-tax cash flow
- $-69/yr
For passive investors: Depreciation is non-cash, so a rental often shows a tax loss while cash-flowing — sheltering income. Rental losses are passive: they offset passive income freely, and up to $25,000/yr can offset ordinary (W-2) income if you actively participate and your MAGI is under $100k (phasing out to $0 by $150k); unused losses carry forward. On sale, claimed depreciation is recaptured at up to 25%, and gains may owe capital-gains tax (a 1031 exchange can defer both). Figures are a year-1 estimate at your 24.0% rate — not tax advice; consult a CPA.
Schools (NCES district)
- District
- Cypress-Fairbanks ISD
- NCES district ID
- 4816110
- Math proficiency
- 45% ▼ -12.00%
- Reading proficiency
- 52% ▼ -2.00%
- Median HH income
- $72,025
- Composite
- 43.63/100
- National rank
- #2968
- State rank
- #161 of 826 in TX
Livability — Houston
- Score
- 74/100
- State rank
- #184
- US rank
- #4771
Category grades
Schools grade is shown separately in the Schools card above.
Census & demographics
- County
- Harris County · 4,702,590 people
- City population
- 3,226,434
- Metro
- Houston-The Woodlands-Sugar Land, TX
- Population (ZIP)
- 116,550
- Household income
- $143,934
- Rent vs Own
- Severe rent burden
- 1700.0
Population outlook (Harris County) Hauer SSP2
- Today (2025)
- 5,571,493 people
- By 2030
- 6,089,821 · +9.3%
- By 2040
- 7,142,806 · +28.2%
- By 2050
- 8,185,864 · +46.9%
- By 2075
- 10,574,329 · +89.8%
- By 2100
- 12,109,958 · +117.4%
Race, ethnicity, and origin ACS 2023
- Neighborhood character
- Highly diverse neighborhood (Simpson 0.73)
- Race & ethnicity
- White 39% Hispanic / Latino 27% Black 17% Two or more races 14% Asian 13%
- Hispanic origin (detail)
- Mexican 16%
- Common ancestry
- Lithuanian 2% Romanian 1% Italian 1%
- Foreign-born
- 21% · Canada, Vietnam, China
- Languages at home
- 66% English-only · Spanish 19% Other Indo-European 4% Vietnamese 4%
Political lean MEDSL · Harris
- 2024 margin
- Lean D (+5.5) · D 52.0% · R 46.4% · Other 1.6%
- 2008→2024 swing
- +3.9pp toward D · 2008: 1.6pp · 2024: 5.5pp
- All cycles
- 2024: D+5.5 2020: D+13.3 2016: D+12.4 2012: D+0.1 2008: D+1.6
Not yet ingested
- Civics
- —
Market trends
- HPI YoY
- ▼ -87.83%
- Current HPI
- 220.2136
- Rent YoY
- ▼ -1.27%
- Metro
- Houston-The Woodlands-Sugar Land, TX
- State GDP YoY
- ▲ 3.95%
- F500 in state
- 110
Industry mix (Fortune 500 HQ in TX)
| Industry | F500 HQs | Revenue |
|---|---|---|
| Energy | 16 | $1,198B |
|
||
| Technology | 5 | $198B |
|
||
| Engineering / Construction | 4 | $72B |
|
||
| Energy Services | 3 | $60B |
|
||
| Utilities | 3 | $41B |
|
||
| Healthcare | 2 | $330B |
|
||
Price history
+145.3% since first listed23 events — show timeline
- 2026-06-18 Price Changed $255,000 HARMLS
- 2026-06-01 Price Changed $265,000 HARMLS
- 2026-05-05 Listed $270,000 HARMLS
- 2025-01-24 Rental Removed $1,850 HARMLS
- 2025-01-24 Listing Removed — HARMLS
- 2025-01-15 Listed for Rent $1,850 HARMLS
- 2025-01-13 Listed $260,000 HARMLS
- 2025-01-07 Rental Removed $1,850 HARMLS
- 2025-01-06 Listing Removed — HARMLS
- 2024-12-11 Relisted — HARMLS
- 2024-12-04 Pending — HARMLS
- 2024-12-03 Relisted — HARMLS
- 2024-11-28 Pending — HARMLS
- 2024-11-18 Listed $265,000 HARMLS
- 2024-11-09 Listed for Rent $1,850 HARMLS
- 2020-08-07 Sold (Public Records) — Public Records
- 2020-08-06 Sold (MLS) — HARMLS
- 2020-07-13 Pending — HARMLS
- 2020-07-06 Pending — HARMLS
- 2020-07-01 Listed $182,000 HARMLS
- 2009-04-13 Sold (MLS) — HARMLS
- 2009-02-27 Listing Removed — HARMLS
- 2009-02-13 Listed $103,952 HARMLS
Property tax history
+7.1%/yrLatest (2025): $5,631 · -0.5% YoY. Source: county tax records.
Cash-flow waterfall
monthlySold comps — $/sqft
last 12 mo · ≤1 miLoading sold comps…