 Duplex
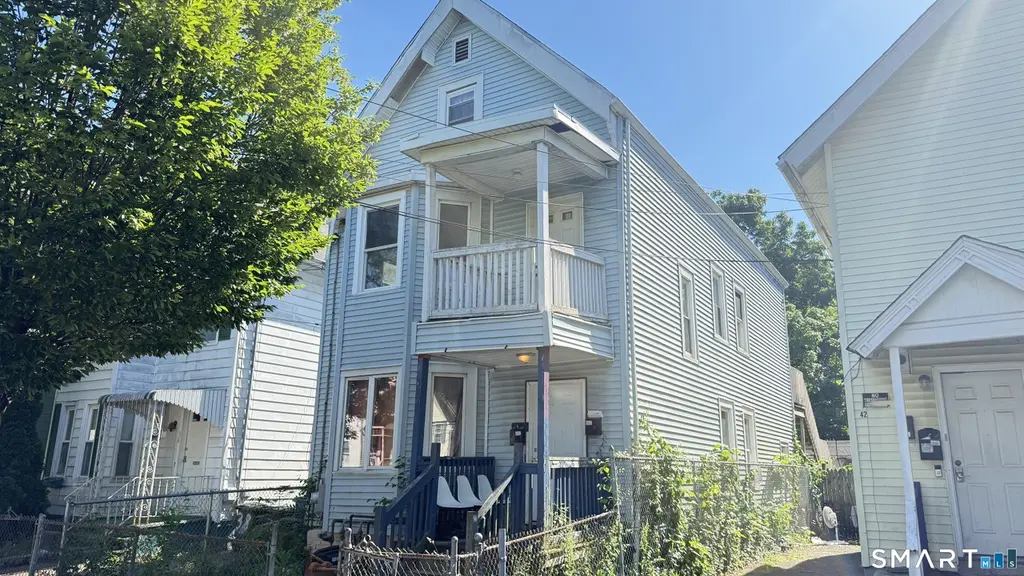
40 Stevens St · New Haven, CT
Flood risk 1/10 · Minimal
- FEMA flood zone
- X (unshaded)
- Chance of flooding over 30 yrs
- 0.0%
- Est. flood insurance / yr
- $473 – $860
Fire risk 1/10 · Minimal
- Est. fire insurance / yr
- $829 – $1,539
Heat risk 7/10 · Major
- Hot days now (above 99°F)
- 7 days/yr
- Hot days in 30 yrs
- 17 days/yr
Wind risk 6/10 · Moderate
- Chance of severe wind over 30 yrs
- 55.0%
Air-quality risk 5/10 · Moderate
- Unhealthy air days now
- 6 days/yr
- Unhealthy air days in 30 yrs
- 8 days/yr
Risk factors via First Street. Map © Google.
Why this score? — see what drove the B grade
The composite is a weighted blend of 9 inputs, each scored 0–100. Each bar is that input's sub-score; the figure is the points it added to the 100-point composite (weight × sub-score).
- Cash flow +27.3/30.0
- Appreciation +9.9/10.0
- DSCR +9.5/10.0
- ARV discount +8.2/15.0
- 1% rule +7.5/10.0
- Livability +4.0/5.0
- Rent growth +3.3/5.0
- Condition / age +2.5/5.0
- Schools +1.5/10.0
$365,000
🖨 Deal sheet 📄 Offer letter ✓ Due diligence
Multi-family units
County records classify this as Multi-Family (2-4 Unit). Listing-text estimate: 2 units. confirmed
Listing remarks MLS
Tranquil West River Neighborhood. Replacement windows. Both units fully occupied with lease. 1st floor unit features 3 bedrooms. 2nd Unit is fully occupied and is combined with the the 3rd floor to make a 5 bedroom apartment. Rents are good and are below market. All good mechanics. 3 blocks from YNHH, Rt. 10, and Rt. 34. Minutes to downtown New Haven and many local parks. West River Park is walking distance. Walk to bus line. Good tenants happy to stay.
Key facts
- Local parks
- Replacement windows
- 3,049 sq ft lot
Tags
Property features AI
Exterior
- Utilities: Public water connected; Public sewer connected
- Home design: Multi-family property (2-family)
- Construction: Frame construction; Stone foundation; Blue exterior color
- Exterior features: Vinyl siding; Asphalt shingle roof
Interior
- Bedrooms: Four bedrooms
- Bathrooms: Two full bathrooms
- Heating & cooling: Hot air heating; Natural gas fuel; 30-gallon hot water tank
- Interior features: Ten total rooms; Full unfinished basement; Walk-up attic
Neighborhood map
What this means for you Summary
Snapshot
- This is a 1×2bd/1.0ba + 1×3bd/1.0ba units multifamily listed at $365k.
Deal economics
- At list price, monthly cash flow is $1k ($13k/yr) — positive. Per door: $528/mo.
- The deal already cash-flows at list — no discount required.
- Meets the 1% rule at list price ($5k rent vs $365k).
- Cap rate 9.8% vs local median 4.8% in New Haven — top-decile yield for the area; either an underpriced asset or a hidden risk that comps aren't pricing in. Stress-test before assuming the spread holds.
Location & tenants
- Location reads 79/100 on livability (#31 in CT, #2,190 nationally) — a middle-class / working-renter tenant base. Strengths: amenities A+, commute A+, health & safety A+; Watch: schools D+, employment D, crime F.
- New Haven School District (urban): math 12% / reading 25% proficiency, ranked #147 of 153 in CT (top 96%) — low school quality limits family demand, transient renter base, plan for 1-2y turnover; 66% free/reduced lunch — lower-income household profile, screen leases tightly.
- Market conditions: Rents rising (+3.3%/yr); 46 active listings in the ZIP; 31 comparable units currently listed for rent nearby; rentals at typical pace (median 23d on market — plan ~3-4 weeks tenant-placement turnaround); 1,059 units permitted in South Central Connecticut Planning Region in 2024 (779 in 5+ unit buildings).
- At $4,579/mo this rent would consume 111% of the median local household income ($50k/yr) (locally 1321% of renters already pay >50% of income on rent) — very limited rent-growth headroom before tenants either downsize or default.
Forward outlook
- In year one you build about $38k of equity ($3k loan paydown + $36k appreciation (9.8% local appreciation)).
- At projected returns (9.8% appreciation + 3.3% rent growth), your $102k cash investment doubles in ~2 years — after that, you're playing with house money.
- By year 2, paydown + projected appreciation supports a ~$62k cash-out refi (75% LTV) — recoverable capital for the next deal without selling this one.
Negotiation context
- Only 12 days on market — expect competitive offers; lowballing is unlikely to land.
- 5 sale attempts since 22y ago with the ask held roughly flat each time — persistent listings suggest the price (not the market) is what's stuck; bring a comps-based counter.
- Current owner paid $171k; list at $365k implies a 113% gain — meaningful room to come down on a strong offer.
Risks & watch-outs
- Watch-outs: built in 1905 — expect roof / HVAC / electrical / plumbing capex.
- Climate carrying-cost: major wind risk, 55% chance of damaging wind over 30y; extreme-heat days projected 7→17/yr by 2055 (HVAC capex compounding) — expect insurance premiums to compound above CPI over the hold.
Questions for the listing agent
- Can we see the unit-by-unit rent roll, current vacancy, and any below-market leases? What's the average tenancy length?
- What capital expenditures (roof, boiler, parking lot, exteriors) have been made in the last 5 years, and what's planned in the next 2?
- Built in 1905 — when were the roof, HVAC, electrical panel, plumbing, and water heater last replaced?
- Is there a deadline driving the sale (1031 exchange, divorce, estate, relocation)? That informs how much negotiation room exists.
- Schools are D-rated, which usually means shorter tenancies and higher turnover. Who's the typical renter profile here, and what's been the actual vacancy rate?
- Crime grade is F in this area — have there been break-ins, vandalism, or insurance claims at this property in the last 3 years? What carrier currently insures it and at what premium?
- What's the average days-on-market for RENTAL listings here right now (not sales)? A rising rental-DOM trend means longer vacancies and softer asking-rent achievability than the comps imply.
- What's the recent tenant-quality profile in this submarket — average credit score on applications, eviction rate, late-payment / NSF rate, and stable-employment percentage? A property-management company in the area should have these aggregated.
- How much new apartment / multifamily construction is in the pipeline within 1–3 miles? Heavy new supply (>2% of stock underway) typically softens rents 12–24 months out; light construction supports rent growth.
Investment metrics
- 1% rule
- 1.25% ✓
- Cap rate
- 9.76%
- Cash-on-cash
- 12.39%
- DSCR
- 1.55
- GRM
- 6.6
CMA / ARV
- ARV (on-the-fly)
- $370,440
- Comps found
- 8
Show comp detail 8 sales within ~0.75 mi
| Address | Dist | Beds/Ba | Sqft | Sold | Price | $/sf | Match |
|---|---|---|---|---|---|---|---|
| 38 Auburn St | 0.22mi | 5/3.0 (+1) | 2,547 (-4%) | 12mo | $470,000 | $185 | 65 |
| 203 West St | 0.19mi | 4/3.0 | 2,288 (-14%) | 11mo | $435,000 | $190 | 55 |
| 866 Congress Ave | 0.30mi | 5/3.0 (+1) | 2,341 (-12%) | 23mo | $255,000 | $109 | 39 |
| 201 Winthrop Ave | 0.44mi | 5/3.0 (+1) | 3,008 (+14%) | 12mo | $330,000 | $110 | 37 |
| 189 Putnam St | 0.66mi | 5/3.0 (+1) | 2,450 (-7%) | 15mo | $320,000 | $131 | 35 |
| 800 George St | 0.64mi | 5/3.0 (+1) | 2,282 (-14%) | 4mo | $320,000 | $140 | 34 |
| 173 Rosette St | 0.73mi | 5/2.0 (+1) | 2,312 (-13%) | 13mo | $212,625 | $92 | 29 |
| 706 George St | 0.52mi | 5/3.0 (+1) | 2,318 (-12%) | 23mo | $520,000 | $224 | 27 |
Match score weights: distance 35% · size 25% · config 20% · recency 20%. Top-matched comps best support the ARV.
Projected returns pro-forma
9.81% appreciation · 3.3% rent growth · sell at horizon
- IRR
- 33.2%
- Equity multiple
- 3.57×
- Total profit
- $262,715
- Equity at exit
- $323,762
- IRR
- 28.8%
- Equity multiple
- 8.07×
- Total profit
- $722,593
- Equity at exit
- $692,889
Cash invested: $102,200 (down + closing). Projections, not guarantees.
Landlord ↔ Tenant lean methodology
- Overall (STATE)
- 27 Tenant-Leaning
- State Connecticut
- 27 Tenant-Leaning · D+7
- County
- — inherits STATE
- City
- — inherits STATE
ZIP-level market 06519
- Home prices YoY
- 2.7%
- Rents YoY
- 3.3%
- Active inventory
- 46
- Price-to-rent
- 13.8×
Monthly cashflow live
- Estimated rent
- $4,579 high interval (Pro) →
- Mortgage (P&I)
- −$1,914
- Tax from tax record
- −$496 /mo · $5,953/yr
- Insurance
- −$152
- HOA
- −$0
- Vacancy / Maint / Mgmt
- −$962
- Net cashflow
- $1,055
Break-even live
2-unit breakdown (identical units grouped — click to expand)
| Units | Beds | Baths | Est. rent |
|---|---|---|---|
| 1× unit | 2 | 1 | $2,210 |
| 1× unit | 3 | 1 | $2,369 |
| Total (2 units) | $4,579 | ||
UW: 25.0% down · 7.5% · 30yr · 1.5% tax · 5.0% vac · 8.0% maint · 8.0% mgmt
Financing live
Cash to close
- Down payment
- $91,250
- Closing costs
- $10,950
- Reserves months
- —
- Total cash needed
- —
Loan-product check · same deal, 3 products live
Conventional
25% down · 7.5% · 30yr
- Down + closing
- —
- Monthly P&I
- —
- Monthly cashflow
- —
- DSCR
- —
- Eligible?
- —
Personal DTI + credit; lowest rate.
DSCR
20% down · 8.5% · 30yr
- Down + closing
- —
- Monthly P&I
- —
- Monthly cashflow
- —
- DSCR
- —
- Eligible?
- —
No personal income docs; deal must DSCR.
Hard money
10% down · 12.0% · 12mo
- Down + closing
- —
- Monthly P&I
- —
- Monthly cashflow
- —
- DSCR
- —
- Eligible?
- —
Short-term bridge; refi at stabilization.
Rent comps 31 comps
| Address | Beds | Baths | Sqft | Rent | $/sqft | DOM | Units | Dist |
|---|---|---|---|---|---|---|---|---|
| 69 Adeline St Unit D New Haven, CT | 3.0 | 1.5 | 2600 | $2,250 | $0.87 | 23d | 1 | 0.46mi |
| 41 Howe St New Haven, CT | 4.0 | 2.0 | 1795 | $3,750 | $2.09 | 43d | 1 | 0.56mi |
| 41 Howe St Apt 2 New Haven, CT | 3.0 | 1.0 | 1795 | $3,200 | $1.78 | 23d | 1 | 0.56mi |
| 41 Howe St Apt 2 New Haven, CT | 3.0 | 1.0 | 1795 | $3,200 | $1.78 | 43d | 1 | 0.56mi |
| 120 Dwight St New Haven, CT | 3.0 | 2.0 | 1750 | $3,175 | $1.81 | 21d | 2 | 0.57mi |
| 43 Howe St New Haven, CT | 4.0 | 2.0 | 1995 | $4,995 | $2.50 | 14d | 1 | 0.58mi |
| 1494 Chapel St Unit 1R New Haven, CT | 3.0 | 1.0 | 1800 | $2,000 | $1.11 | 3d | 1 | 0.67mi |
| 5 Oak Pl West Haven, CT | 3.0 | 1.0 | 2300 | $1,900 | $0.83 | 2d | 1 | 0.69mi |
| 66 Kensington St Unit 2 New Haven, CT | 3.0 | 2.0 | 1800 | $2,100 | $1.17 | 23d | 1 | 0.73mi |
| 82 Gilbert St West Haven, CT | 3.0 | 1.0 | 2641 | $2,400 | $0.91 | 43d | 1 | 0.75mi |
| 83 Norton St Unit 2 New Haven, CT | 3.0 | 1.0 | 2869 | $1,695 | $0.59 | 14d | 1 | 0.81mi |
| 161 Lamberton St #3 New Haven, CT | 3.0 | 1.0 | 3435 | $1,975 | $0.57 | 3d | 1 | 0.82mi |
| 36 Cassius St New Haven, CT | 4.0 | 1.5 | 1872 | $2,300 | $1.23 | 43d | 1 | 0.90mi |
| 34 Cassius St Unit 36 New Haven, CT | 5.0 | 2.0 | 1872 | $2,300 | $1.23 | 43d | 1 | 0.90mi |
| 52 Goffe St New Haven, CT | 3.0 | 2.0 | 1935 | $2,600 | $1.34 | 23d | 1 | 0.95mi |
| 117 Maple St New Haven, CT | 3.0 | 1.5 | 2421 | $3,995 | $1.65 | 3d | 1 | 0.99mi |
| 47 Dickerman St Unit 1 New Haven, CT | 3.0 | 1.0 | 3729 | $2,100 | $0.56 | 43d | 1 | 1.01mi |
| 347 Sherman Ave New Haven, CT | 5.0 | 3.0 | 3153 | $2,300 | $0.73 | 43d | 1 | 1.11mi |
| 119 Carmel St Unit 3 New Haven, CT | 3.0 | 1.0 | 3282 | $1,900 | $0.58 | 43d | 1 | 1.26mi |
| 355 Norton St Unit 1 New Haven, CT | 5.0 | 2.5 | 2500 | $3,300 | $1.32 | 21d | 1 | 1.29mi |
| 49 Hubinger St New Haven, CT | 4.0 | 1.5 | 2000 | $2,950 | $1.48 | 2d | 1 | 1.31mi |
| 1519 Ella T Grasso Blvd Unit N/A New Haven, CT | 5.0 | 2.0 | 2750 | $4,450 | $1.62 | 23d | 1 | 1.32mi |
| 56 Mansfield St Unit 1 New Haven, CT | 3.0 | 1.0 | 2759 | $2,800 | $1.01 | 43d | 1 | 1.34mi |
| 50 Admiral St New Haven, CT | 5.0 | 2.0 | 2157 | $2,700 | $1.25 | 19d | 1 | 1.35mi |
| 54 Trumbull St Unit 54-1 New Haven, CT | 5.0 | 2.5 | 2250 | $6,695 | $2.98 | 14d | 1 | 1.36mi |
| 55 Admiral St Unit 2 New Haven, CT | 5.0 | 3.0 | 2000 | $3,295 | $1.65 | 23d | 1 | 1.38mi |
| 50 Wood St West Haven, CT | 3.0 | 1.0 | 2314 | $2,400 | $1.04 | 2d | 1 | 1.40mi |
| 30 Trumbull St New Haven, CT | 5.0 | 4.0 | 2668 | $5,000 | $1.87 | 3d | 1 | 1.42mi |
| 432 Norton Pkwy New Haven, CT | 5.0 | 3.0 | 2493 | $4,195 | $1.68 | 43d | 1 | 1.45mi |
| 134 Mansfield St New Haven, CT | 5.0 | 2.0 | 1960 | $5,500 | $2.81 | 23d | 1 | 1.45mi |
| 239 Bradley St Unit 1 New Haven, CT | 3.0 | 1.0 | 1982 | $3,650 | $1.84 | 43d | 1 | 1.46mi |
Listing history 11 events
-
2026-06-17status $365,000 Under Contract 12 DOM
-
2026-06-17days on market $365,000 Active 12 DOM
-
2026-06-16days on market $365,000 Active 11 DOM
-
2026-06-15days on market $365,000 Active 10 DOM
-
2026-06-14days on market $365,000 Active 8 DOM
-
2026-06-13days on market $365,000 Active 7 DOM
-
2026-06-10days on market $365,000 Active 5 DOM
-
2026-06-09days on market $365,000 Active 4 DOM
-
2026-06-08days on market $365,000 Active 3 DOM
-
2026-06-07remarks 699-char remark
-
2026-06-07$365,000 Active 2 DOM
ⓘ Source: listings_history table (triggers on properties + properties_extension) + one-shot
backfill from property_details.listing_events for pre-trigger history.
Tax reassessment forecast CT · Partial reset (capped growth)
- Current annual tax
- $5,953 · $496/mo
- Projected year-2 tax
- $6,882 · $574/mo
- Expected delta
- +$929/yr (+$77/mo · 15.6%)
ⓘ Screening estimate from a state-policy table — verify with the county assessor before closing.
Climate risk First Street
- Flood 1/10 Low FEMA zone X (unshaded) · 0% chance over 30 yrs
- Wildfire 1/10 Low
- Heat 7/10 Severe 7 d/yr ≥99°F today · 17 d/yr by 30 yrs out
- Wind 6/10 Major 55% chance of damaging wind over 30 yrs
- Air quality 5/10 Major 6 unhealthy d/yr today · 8 by 30 yrs out
Nearby sold comps map
Loading sold comps map…
Walkable amenities ~0.75 mi
Loading nearby amenities…
Taxation est. · year 1
- Rental income
- $54,948
- − Mortgage interest
- −$20,446
- − Property taxes
- −$5,953
- − Insurance
- −$1,825
- − Repairs & maintenance
- −$4,396
- − Management
- −$4,396
- − Depreciation
- −$10,618
- Taxable income
- $7,314
- Est. tax owed @ 24.0%
- −$1,755
- After-tax cash flow
- $10,906/yr
For passive investors: Depreciation is non-cash, so a rental often shows a tax loss while cash-flowing — sheltering income. Rental losses are passive: they offset passive income freely, and up to $25,000/yr can offset ordinary (W-2) income if you actively participate and your MAGI is under $100k (phasing out to $0 by $150k); unused losses carry forward. On sale, claimed depreciation is recaptured at up to 25%, and gains may owe capital-gains tax (a 1031 exchange can defer both). Figures are a year-1 estimate at your 24.0% rate — not tax advice; consult a CPA.
Schools (NCES district)
- District
- New Haven School District
- NCES district ID
- 0902790
- Math proficiency
- 12% ▼ -10.00%
- Reading proficiency
- 25% ▼ -10.00%
- Median HH income
- $38,058
- Composite
- 15.48/100
- National rank
- #9308
- State rank
- #147 of 153 in CT
Livability — New Haven
- Score
- 79/100
- State rank
- #31
- US rank
- #2190
Category grades
Schools grade is shown separately in the Schools card above.
Census & demographics
- Census place
- New Haven, CT
- County
- New Haven County · 688,236 people
- City population
- 132,813
- Metro
- New Haven-Milford, CT
- Population (ZIP)
- 15,605
- Household income
- $49,619
- Rent vs Own
- Severe rent burden
- 1321.0
Population outlook (South Central Connecticut County) Hauer SSP2
- By 2040
- 608,362
Race, ethnicity, and origin ACS 2023
- Neighborhood character
- Diverse neighborhood (Simpson 0.67)
- Race & ethnicity
- Hispanic / Latino 49% Black 26% White 15% Two or more races 13% Asian 4% Native American 1%
- Hispanic origin (detail)
- Mexican 15% Puerto Rican 25% Dominican 3%
- Common ancestry
- Romanian 1% Lithuanian 1%
- Foreign-born
- 25% · Canada, Jamaica, China
- Languages at home
- 50% English-only · Spanish 42% Other Indo-European 4% Arabic 1%
Political lean MEDSL · South Central Connecticut
- 2024 margin
- Strong D (+20.1) · D 59.0% · R 38.9% · Other 2.1%
- All cycles
- 2024: D+20.1
Not yet ingested
- Civics
- —
Market trends
- HPI YoY
- ▲ 9.81%
- Current HPI
- 377.4885
- Rent YoY
- ▲ 3.30%
- Metro
- New Haven-Milford, CT
- State GDP YoY
- ▲ 1.06%
- F500 in state
- 38
Industry mix (Fortune 500 HQ in CT)
| Industry | F500 HQs | Revenue |
|---|---|---|
| Industrial Machinery | 4 | $38B |
|
||
| Insurance | 3 | $71B |
|
||
| Financial Services | 2 | $25B |
|
||
| Transportation / Logistics | 2 | $18B |
|
||
| Healthcare | 1 | $247B |
|
||
| Telecommunications | 1 | $55B |
|
||
Price history
+284.6% since first listed15 events — show timeline
- 2026-06-05 Listed $365,000 Smart MLS
- 2020-03-05 Sold (MLS) $171,000 Smart MLS
- 2020-01-06 Sold (Public Records) $171,000 Public Records
- 2019-11-27 Pending — Smart MLS
- 2019-10-08 Contingent — Smart MLS
- 2019-09-27 Relisted — Smart MLS
- 2019-09-16 Contingent — Smart MLS
- 2019-09-05 Listed $167,000 Smart MLS
- 2018-04-03 Sold (MLS) $135,750 Smart MLS
- 2018-02-12 Pending — Smart MLS
- 2018-01-25 Contingent — Smart MLS
- 2017-09-05 Listed $139,000 Smart MLS
- 2004-07-06 Sold (Public Records) $117,000 Public Records
- 2004-05-05 Sold (MLS) $115,000 Smart MLS
- 2004-03-04 Listed $94,900 Smart MLS
Property tax history
+6.7%/yrLatest (2023): $5,953 · -6.4% YoY. Source: county tax records.
Cash-flow waterfall
monthlySold comps — $/sqft
last 12 mo · ≤1 miLoading sold comps…