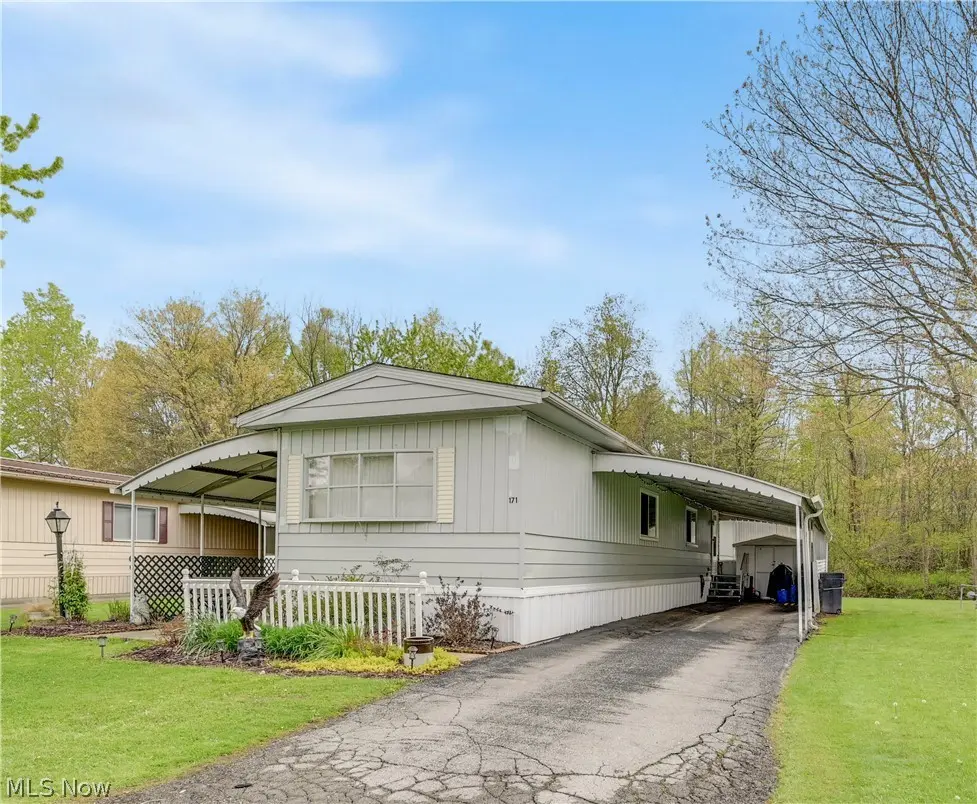
171 Brook Dr · Brookfield Center, OH
Flood risk No data
- FEMA flood zone
- —
- Chance of flooding over 30 yrs
- —
- Est. flood insurance / yr
- —
Fire risk No data
- Est. fire insurance / yr
- —
Heat risk No data
- Hot days now (above threshold)
- —
- Hot days in 30 yrs
- —
Wind risk No data
- Chance of severe wind over 30 yrs
- —
Air-quality risk No data
- Unhealthy air days now
- —
- Unhealthy air days in 30 yrs
- —
Risk factors via First Street. Map © Google.
Why this score? — see what drove the A- grade
The composite is a weighted blend of 9 inputs, each scored 0–100. Each bar is that input's sub-score; the figure is the points it added to the 100-point composite (weight × sub-score).
- Cash flow +30.0/30.0
- 1% rule +10.0/10.0
- DSCR +10.0/10.0
- Appreciation +10.0/10.0
- ARV discount +7.5/15.0
- Condition / age +3.8/5.0
- Livability +3.7/5.0
- Schools +3.6/10.0
- Rent growth +2.5/5.0
$39,900
🖨 Deal sheet 📄 Offer letter ✓ Due diligence
Listing remarks
Wonderful 2-bedroom 1.5 bath home in Wyngate Manor. Located in a 55+ community in Brookfield, Ohio. Open kitchen to include all appliances and plenty of cabinets and counter space. Many updates in 2021-2022 - doors, windows, counter tops, cabinet refacing, back splash, hot water tank. Furnace and AC 2020. Custom blinds will stay. You will enjoy the covered patio and handy well desired carport. Large yard with scenic woods. 2 sheds for storage. Call today for more information about this affordable home!
Key facts
- Scenic woods
- Carport
- Large yard
Tags
Property features AI
Finance
- Financial info: Has land lease with monthly amount of $350; Pets allowed: cats and dogs (size limit applies)
- HOA & community: Association fees include trash and water
Exterior
- Parking: Carport (2 spaces); Driveway
- Utilities: Public water; Public sewer
- Home design: Single-story home; Above-grade living area recorded as 910 (assessor)
- Construction: Built per public records; Aluminum and vinyl siding; Asphalt/fiberglass roof
- Exterior features: Covered patio/porch; Storage; Shed(s)
Interior
- Kitchen: Dishwasher; Range; Refrigerator
- Bedrooms: 2 main-level bedrooms
- Bathrooms: 1 full bathroom; 1 half bathroom
- Heating & cooling: Central air conditioning; Forced air heating
- Interior features: Updated/remodeled condition; Total of 5 rooms
Neighborhood map
What this means for you Summary
Snapshot
- This is a 2-bed/1.5-bath single-family listed at $40k. Condition is rated good.
Deal economics
- At list price, monthly cash flow is $424 ($5k/yr) — positive.
- The deal already cash-flows at list — no discount required.
- Meets the 1% rule at list price ($886 rent vs $40k).
- Recommended offer: $39k (1.5% below list) — sets the bar for market timing.
Location & tenants
- Location reads 73/100 on livability (#315 in OH) — a middle-class / working-renter tenant base. Strengths: crime A+, cost of living A+, housing A+; Watch: employment D+, amenities F, commute F.
- Brookfield Local (rural): math 32% / reading 54% proficiency, ranked #524 of 656 in OH (top 80%) — families likely to look elsewhere, expect single-tenant / working-renter base with shorter leases.
- Market conditions: 25 active listings in the ZIP; 129 units permitted in Trumbull County in 2024 (0 in 5+ unit buildings).
- This rent is only 17% of the median local income ($62k/yr) — well below the 30% rent-burden line; pricing power to push rent on renewal without tenant pushback.
Forward outlook
- In year one you build about $4k of equity ($276 loan paydown + $4k appreciation (10.0% local appreciation)).
- Trumbull County population projected at -22% by 2050 — secular population decline; favor cash flow + early exit over multi-decade hold.
- At projected returns (10.0% appreciation + 3.0% rent growth), your $11k cash investment doubles in ~2 years — after that, you're playing with house money.
- By year 7, paydown + projected appreciation supports a ~$31k cash-out refi (75% LTV) — recoverable capital for the next deal without selling this one.
Negotiation context
- It's been on market 19 days — a 2% lower offer ($39k) is reasonable based on typical stale-listing flexibility.
Questions for the listing agent
- Is there a deadline driving the sale (1031 exchange, divorce, estate, relocation)? That informs how much negotiation room exists.
- Schools are B-rated — typically a magnet for longer-tenancy family renters. What's the average tenant stay here, and is there a school-zone premium baked into asking?
- What's the average days-on-market for RENTAL listings here right now (not sales)? A rising rental-DOM trend means longer vacancies and softer asking-rent achievability than the comps imply.
- What's the recent tenant-quality profile in this submarket — average credit score on applications, eviction rate, late-payment / NSF rate, and stable-employment percentage? A property-management company in the area should have these aggregated.
- How much new for-sale + rental construction is in the pipeline within 1–3 miles? Heavy new supply typically softens prices + rents 12–24 months out; constrained supply supports both.
Investment metrics
- 1% rule
- 2.22% ✓
- Cap rate
- 19.04%
- Cash-on-cash
- 45.52%
- DSCR
- 3.03
- GRM
- 3.8
CMA / ARV
- ARV (median comp)
- $86,897
- List price
- $39,900
- Delta
- -54.08%
- Verdict
- UNDERPRICED
- Comps
- 14 within 1.0 mi
Show comp detail 3 sales within ~0.75 mi
| Address | Dist | Beds/Ba | Sqft | Sold | Price | $/sf | Match |
|---|---|---|---|---|---|---|---|
| 180 Brook Dr | 0.09mi | 2/1.0 | 896 (-2%) | 21mo | $26,000 | $29 | 73 |
| 166 Brook Dr | 0.06mi | 2/2.0 | 980 (+8%) | 18mo | $33,000 | $34 | 67 |
| 6733 Warren Sharon Rd | 0.54mi | 2/1.0 | 956 (+5%) | 12mo | $94,000 | $98 | 55 |
Match score weights: distance 35% · size 25% · config 20% · recency 20%. Top-matched comps best support the ARV.
Projected returns pro-forma
10.0% appreciation · 3.0% rent growth · sell at horizon
- IRR
- 59.8%
- Equity multiple
- 5.36×
- Total profit
- $48,736
- Equity at exit
- $35,945
- IRR
- 53.3%
- Equity multiple
- 11.95×
- Total profit
- $122,320
- Equity at exit
- $77,517
Cash invested: $11,172 (down + closing). Projections, not guarantees.
Landlord ↔ Tenant lean methodology
- Overall (STATE)
- 73 Landlord-Friendly
- State Ohio
- 73 Landlord-Friendly · R+6
- County
- — inherits STATE
- City
- — inherits STATE
ZIP-level market 44403
- Home prices YoY
- 15.3%
- Active inventory
- 25
- Price-to-rent
- 3.8×
Monthly cashflow live
- Estimated rent
- $886 medium interval (Pro) →
- Mortgage (P&I)
- −$209
- Tax est. 1.5%
- −$50 /mo · $598/yr
- Insurance
- −$17
- HOA
- −$0
- Vacancy / Maint / Mgmt
- −$186
- Net cashflow
- $424
Break-even live
UW: 25.0% down · 7.5% · 30yr · 1.5% tax · 5.0% vac · 8.0% maint · 8.0% mgmt
Financing live
Cash to close
- Down payment
- $9,975
- Closing costs
- $1,197
- Reserves months
- —
- Total cash needed
- —
Loan-product check · same deal, 3 products live
Conventional
25% down · 7.5% · 30yr
- Down + closing
- —
- Monthly P&I
- —
- Monthly cashflow
- —
- DSCR
- —
- Eligible?
- —
Personal DTI + credit; lowest rate.
DSCR
20% down · 8.5% · 30yr
- Down + closing
- —
- Monthly P&I
- —
- Monthly cashflow
- —
- DSCR
- —
- Eligible?
- —
No personal income docs; deal must DSCR.
Hard money
10% down · 12.0% · 12mo
- Down + closing
- —
- Monthly P&I
- —
- Monthly cashflow
- —
- DSCR
- —
- Eligible?
- —
Short-term bridge; refi at stabilization.
Listing history 1 events
-
2026-05-01$39,900 Active 507-char remark
ⓘ Source: listings_history table (triggers on properties + properties_extension) + one-shot
backfill from property_details.listing_events for pre-trigger history.
Nearby sold comps map
Loading sold comps map…
Walkable amenities ~0.75 mi
Loading nearby amenities…
Taxation est. · year 1
- Rental income
- $10,626
- − Mortgage interest
- −$2,235
- − Property taxes
- −$598
- − Insurance
- −$200
- − Repairs & maintenance
- −$850
- − Management
- −$850
- − Depreciation
- −$1,161
- Taxable income
- $4,732
- Est. tax owed @ 24.0%
- −$1,136
- After-tax cash flow
- $3,950/yr
For passive investors: Depreciation is non-cash, so a rental often shows a tax loss while cash-flowing — sheltering income. Rental losses are passive: they offset passive income freely, and up to $25,000/yr can offset ordinary (W-2) income if you actively participate and your MAGI is under $100k (phasing out to $0 by $150k); unused losses carry forward. On sale, claimed depreciation is recaptured at up to 25%, and gains may owe capital-gains tax (a 1031 exchange can defer both). Figures are a year-1 estimate at your 24.0% rate — not tax advice; consult a CPA.
Condition & rehab AI · 2 photos
This 2-bedroom 1.5 bath home in a 55+ community is in good condition with recent updates and a well-maintained exterior. It offers a good investment opportunity with potential for value enhancement through minor cosmetic upgrades.
Value-add opportunities
- Both Painting exterior and interior walls — Fresh paint can enhance curb appeal and interior aesthetics.
- Both Landscaping improvements — Enhanced landscaping can improve curb appeal and attract potential buyers/tenants.
- Both New flooring — New flooring can improve the overall look and feel of the home, making it more appealing to buyers/tenants.
- Both Kitchen appliances — Upgrading appliances can make the kitchen more modern and appealing to potential buyers/tenants.
- Both Bathroom updates — Updating bathrooms can improve functionality and appeal, making the home more attractive to buyers/tenants.
Renovation cost estimate screening
Value-add ROI direction
- Both Painting exterior and interior walls — Fresh paint can enhance curb appeal and interior aesthetics. ↑
- Both Landscaping improvements — Enhanced landscaping can improve curb appeal and attract potential buyers/tenants. ↑
- Both New flooring — New flooring can improve the overall look and feel of the home, making it more appealing to buyers/tenants. ↑
- Both Kitchen appliances — Upgrading appliances can make the kitchen more modern and appealing to potential buyers/tenants. ↑
- Both Bathroom updates — Updating bathrooms can improve functionality and appeal, making the home more attractive to buyers/tenants. ↑
ⓘ Cost ranges are severity-bucket heuristics (US national rule-of-thumb). Get contractor quotes + a written scope before underwriting a rehab budget.
Schools (NCES district)
- District
- Brookfield Local
- NCES district ID
- 3905012
- Math proficiency
- 32% ▼ -24.00%
- Reading proficiency
- 54% ▼ -9.00%
- Median HH income
- $38,050
- Composite
- 35.75/100
- National rank
- #4850
- State rank
- #524 of 656 in OH
Livability — Brookfield Center
- Score
- 73/100
- State rank
- #315
- US rank
- #5164
Category grades
Schools grade is shown separately in the Schools card above.
Census & demographics
- County
- Trumbull · 193,293 people
- Metro
- Youngstown-Warren, OH
- Population (ZIP)
- 3,766
- Household income
- $62,312
- Rent vs Own
- Severe rent burden
- 10.5
Population outlook (Trumbull County) Hauer SSP2
- Today (2025)
- 191,696 people
- By 2030
- 184,015 · -4.0%
- By 2040
- 166,810 · -13.0%
- By 2050
- 149,857 · -21.8%
- By 2075
- 115,769 · -39.6%
- By 2100
- 83,617 · -56.4%
Race, ethnicity, and origin ACS 2023
- Neighborhood character
- Predominantly White (97%)
- Race & ethnicity
- White 97% Two or more races 1%
- Common ancestry
- Romanian 4% Serbian 2% Slovene 1%
- Foreign-born
- 0%
- Languages at home
- 99% English-only · Russian/Polish/Slavic 1%
Political lean MEDSL · Trumbull
- 2024 margin
- R (+16.8) · D 41.2% · R 58.0%
- 2008→2024 swing
- -39.2pp toward R · 2008: 22.4pp · 2024: -16.8pp
- All cycles
- 2024: R+16.8 2020: R+10.6 2016: R+6.4 2012: D+22.2 2008: D+22.4
Not yet ingested
- Civics
- —
Market trends
- HPI YoY
- ▲ 33.25%
- Current HPI
- 250.11
- Rent YoY
- —
- Metro
- —
- State GDP YoY
- ▲ 1.98%
- F500 in state
- 48
Industry mix (Fortune 500 HQ in OH)
| Industry | F500 HQs | Revenue |
|---|---|---|
| Insurance | 3 | $145B |
|
||
| Industrial Machinery | 3 | $49B |
|
||
| Financial Services | 3 | $24B |
|
||
| Consumer Goods | 2 | $93B |
|
||
| Aerospace / Defense | 2 | $47B |
|
||
| Utilities | 2 | $33B |
|
||
Price history
2 events — show timeline
- 2026-05-20 Pending — MLSNOW
- 2026-05-01 Listed $39,900 MLSNOW
Cash-flow waterfall
monthlySold comps — $/sqft
last 12 mo · ≤1 miLoading sold comps…