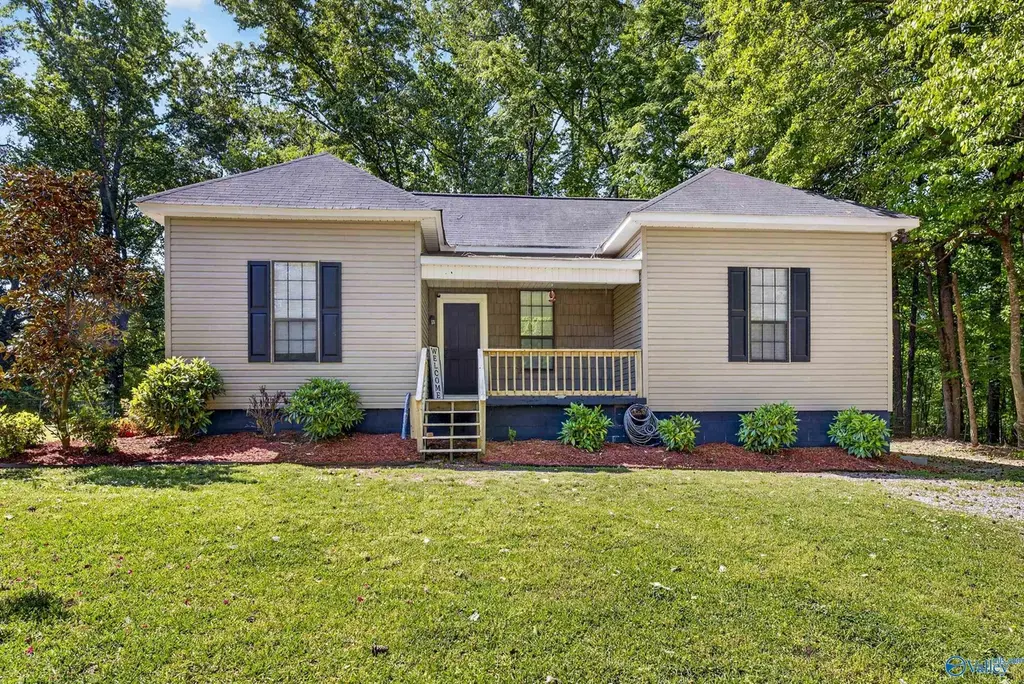
2547 Pinedale Dr · Southside, AL
Flood risk 1/10 · Minimal
- FEMA flood zone
- X (unshaded)
- Chance of flooding over 30 yrs
- 0.0%
- Est. flood insurance / yr
- $507 – $1,088
Fire risk 4/10 · Minor
- Est. fire insurance / yr
- $916 – $1,700
Heat risk 6/10 · Moderate
- Hot days now (above 106°F)
- 7 days/yr
- Hot days in 30 yrs
- 19 days/yr
Wind risk 4/10 · Minor
- Chance of severe wind over 30 yrs
- 22.0%
Air-quality risk 2/10 · Minimal
- Unhealthy air days now
- 1 days/yr
- Unhealthy air days in 30 yrs
- 2 days/yr
Risk factors via First Street. Map © Google.
Why this score? — see what drove the B grade
The composite is a weighted blend of 9 inputs, each scored 0–100. Each bar is that input's sub-score; the figure is the points it added to the 100-point composite (weight × sub-score).
- Cash flow +28.4/30.0
- ARV discount +15.0/15.0
- DSCR +10.0/10.0
- 1% rule +6.5/10.0
- Livability +3.4/5.0
- Schools +3.1/10.0
- Rent growth +2.5/5.0
- Condition / age +2.5/5.0
- Appreciation +0.0/10.0
$214,900
🖨 Deal sheet 📄 Offer letter ✓ Due diligence
Listing remarks MLS
Southside- Step into a home that perfectly balances character, charm, and spacious living. It offers 3 bedrooms and 3 bathrooms. The high ceiling and spacious living area will give you an airy, open feel. There is a nice workable kitchen for the chef in the family. It has two master suites, which is a rare find, providing privacy, flexibility, or premium guest accommodations. Enjoy your morning coffee on the covered front porch. On the back you will find a large deck the perfect spot for outdoor dining or relaxing under the stars.
Key facts
- 0.39 acre lot
- Built 1955
- Listed 57 days
Neighborhood map
What this means for you Summary
Snapshot
- This is a 3-bed/2.0-bath single-family listed at $215k.
Deal economics
- At list price, monthly cash flow is $694 ($8k/yr) — positive.
- The deal already cash-flows at list — no discount required.
- Meets the 1% rule at list price ($2k rent vs $215k).
- Recommended offer: $208k (3.0% below list) — sets the bar for market timing.
- Cap rate 10.2% vs local median 3.5% in Southside — top-decile yield for the area; either an underpriced asset or a hidden risk that comps aren't pricing in. Stress-test before assuming the spread holds.
Location & tenants
- Location reads 68/100 on livability (#73 in AL) — a middle-class / working-renter tenant base. Strengths: crime A+, cost of living A+, housing A+; Watch: amenities F, commute F, health & safety F.
- Etowah County (suburban): math 21% / reading 52% proficiency, ranked #36 of 129 in AL (top 28%) — families likely to look elsewhere, expect single-tenant / working-renter base with shorter leases.
- Market conditions: 81 active listings in the ZIP; 3 comparable units currently listed for rent nearby; rentals leasing fast (median 12d on market — plan ~1-2 weeks tenant-placement turnaround); 119 units permitted in Etowah County in 2024 (0 in 5+ unit buildings).
Forward outlook
- Local home prices are declining (-3.0%/yr); year-one equity from $1k of loan paydown is wiped out by about $6k of value loss. Plan a longer hold.
- Etowah County population projected at -12% by 2050 — secular population decline; favor cash flow + early exit over multi-decade hold.
- At projected returns (-3.0% appreciation + 3.0% rent growth), your $60k cash investment doubles in ~9 years — after that, you're playing with house money.
Negotiation context
- It's been on market 58 days — a 3% lower offer ($208k) is reasonable based on typical stale-listing flexibility.
- 2 sale attempts since 8y ago; this cycle's ask has dropped $15k (7%) from the opening price — seller is motivated, your offer sets the floor, not the list.
- Current owner paid $120k; list at $215k implies a 79% gain — meaningful room to come down on a strong offer.
Risks & watch-outs
- Watch-outs: built in 1955 — expect roof / HVAC / electrical / plumbing capex.
- Climate carrying-cost: extreme-heat days projected 7→19/yr by 2055 (HVAC capex compounding) — expect insurance premiums to compound above CPI over the hold.
Questions for the listing agent
- It's been on market 58 days. Have you received any prior offers? Is the seller open to a 3% concession, seller financing, or rate buy-down credit?
- Built in 1955 — when were the roof, HVAC, electrical panel, plumbing, and water heater last replaced?
- Is there a deadline driving the sale (1031 exchange, divorce, estate, relocation)? That informs how much negotiation room exists.
- What's the average days-on-market for RENTAL listings here right now (not sales)? A rising rental-DOM trend means longer vacancies and softer asking-rent achievability than the comps imply.
- What's the recent tenant-quality profile in this submarket — average credit score on applications, eviction rate, late-payment / NSF rate, and stable-employment percentage? A property-management company in the area should have these aggregated.
- How much new for-sale + rental construction is in the pipeline within 1–3 miles? Heavy new supply typically softens prices + rents 12–24 months out; constrained supply supports both.
Investment metrics
- 1% rule
- 1.15% ✓
- Cap rate
- 10.17%
- Cash-on-cash
- 13.83%
- DSCR
- 1.62
- GRM
- 7.2
CMA / ARV
- ARV (median comp)
- $272,842
- List price
- $214,900
- Delta
- -21.24%
- Verdict
- UNDERPRICED
- Comps
- 20 within 1.0 mi
Show comp detail 12 sales within ~0.75 mi
| Address | Dist | Beds/Ba | Sqft | Sold | Price | $/sf | Match |
|---|---|---|---|---|---|---|---|
| 2706 Bucks Island Rd | 0.35mi | 3/2.0 | 1,773 (-1%) | 7mo | $455,000 | $257 | 76 |
| 2753 Scott St | 0.38mi | 4/2.0 (+1) | 1,775 (-1%) | 2mo | $214,900 | $121 | 73 |
| 1571 Lee St | 0.27mi | 3/2.0 | 1,619 (-10%) | 5mo | $239,000 | $148 | 67 |
| 2434 Timberlake Dr | 0.15mi | 3/2.0 | 2,051 (+14%) | 8mo | $345,900 | $169 | 63 |
| 1310 Holiday Dr | 0.59mi | 3/2.0 | 1,727 (-4%) | 3mo | $209,000 | $121 | 63 |
| 2428 Timber Lake Dr | 0.29mi | 3/2.0 | 1,971 (+10%) | 13mo | $353,000 | $179 | 60 |
| 2432 Timberlake Dr | 0.28mi | 4/3.5 (+1) | 1,990 (+11%) | 2mo | $358,500 | $180 | 56 |
| 1691 Jordan Dr | 0.57mi | 3/1.5 | 1,862 (+4%) | 14mo | $85,000 | $46 | 54 |
| 1663 Beech Hollow Ln | 0.33mi | 3/2.0 | 2,025 (+13%) | 14mo | $369,000 | $182 | 52 |
| 2075 Jane Ln | 0.66mi | 3/2.0 | 1,603 (-11%) | 1mo | $249,900 | $156 | 50 |
| 1420 Holiday Dr | 0.60mi | 3/2.0 | 1,650 (-8%) | 11mo | $232,000 | $141 | 49 |
| 1601 Walden Dr | 0.50mi | 3/1.0 | 1,539 (-14%) | 11mo | $105,000 | $68 | 39 |
Match score weights: distance 35% · size 25% · config 20% · recency 20%. Top-matched comps best support the ARV.
Projected returns pro-forma
-3.0% appreciation · 3.0% rent growth · sell at horizon
- IRR
- 4.0%
- Equity multiple
- 1.15×
- Total profit
- $9,255
- Equity at exit
- $32,042
- IRR
- 13.5%
- Equity multiple
- 2.07×
- Total profit
- $64,541
- Equity at exit
- $18,581
Cash invested: $60,172 (down + closing). Projections, not guarantees.
Landlord ↔ Tenant lean methodology
- Overall (STATE)
- 90 Strongly Landlord-Friendly
- State Alabama
- 90 Strongly Landlord-Friendly · R+15
- County
- — inherits STATE
- City
- — inherits STATE
ZIP-level market 35907
- Home prices YoY
- -25.9%
- Active inventory
- 81
- Price-to-rent
- 7.2×
Monthly cashflow live
- Estimated rent
- $2,477 medium interval (Pro) →
- Mortgage (P&I)
- −$1,127
- Tax from tax record
- −$46 /mo · $557/yr
- Insurance
- −$90
- HOA
- −$0
- Vacancy / Maint / Mgmt
- −$520
- Net cashflow
- $694
Break-even live
UW: 25.0% down · 7.5% · 30yr · 1.5% tax · 5.0% vac · 8.0% maint · 8.0% mgmt
Financing live
Cash to close
- Down payment
- $53,725
- Closing costs
- $6,447
- Reserves months
- —
- Total cash needed
- —
Loan-product check · same deal, 3 products live
Conventional
25% down · 7.5% · 30yr
- Down + closing
- —
- Monthly P&I
- —
- Monthly cashflow
- —
- DSCR
- —
- Eligible?
- —
Personal DTI + credit; lowest rate.
DSCR
20% down · 8.5% · 30yr
- Down + closing
- —
- Monthly P&I
- —
- Monthly cashflow
- —
- DSCR
- —
- Eligible?
- —
No personal income docs; deal must DSCR.
Hard money
10% down · 12.0% · 12mo
- Down + closing
- —
- Monthly P&I
- —
- Monthly cashflow
- —
- DSCR
- —
- Eligible?
- —
Short-term bridge; refi at stabilization.
Rent comps 3 comps
| Address | Beds | Baths | Sqft | Rent | $/sqft | DOM | Units | Dist |
|---|---|---|---|---|---|---|---|---|
| 418 Riverton Dr Rainbow City, AL | 3.0 | 3.0 | 2342 | $3,800 | $1.62 | 23d | 1 | 0.99mi |
| 2214 Windsong Trl Gadsden, AL | 3.0 | 2.5 | 2200 | $2,000 | $0.91 | 3d | 1 | 1.01mi |
| 3166 Jenkins Cir S Gadsden, AL | 3.0 | 1.5 | 1350 | $1,385 | $1.03 | 11d | 1 | 1.28mi |
Listing history 20 events
-
2026-06-19days on market $214,900 Active 58 DOM
-
2026-06-18days on market $214,900 Active 57 DOM
-
2026-06-17days on market $214,900 Active 56 DOM
-
2026-06-16days on market $214,900 Active 55 DOM
-
2026-06-15days on market $214,900 Active 54 DOM
-
2026-06-14pricedays on market $214,900 Active 52 DOM
-
2026-06-13days on market $229,900 Active 51 DOM
-
2026-06-10days on market $229,900 Active 49 DOM
-
2026-06-09days on market $229,900 Active 48 DOM
-
2026-06-08days on market $229,900 Active 47 DOM
-
2026-06-07days on market $229,900 Active 46 DOM
-
2026-06-05days on market $229,900 Active 43 DOM
-
2026-06-03days on market $229,900 Active 42 DOM
-
2026-06-02days on market $229,900 Active 41 DOM
-
2026-06-01days on market $229,900 Active 40 DOM
-
2026-05-31days on market $229,900 Active 39 DOM
-
2026-05-30days on market $229,900 Active 38 DOM
-
2026-04-22$229,900 Active 536-char remark
Show marketing remark (536 chars)
Southside- Step into a home that perfectly balances character, charm, and spacious living. It offers 3 bedrooms and 3 bathrooms. The high ceiling and spacious living area will give you an airy, open feel. There is a nice workable kitchen for the chef in the family. It has two master suites, which is a rare find, providing privacy, flexibility, or premium guest accommodations. Enjoy your morning coffee on the covered front porch. On the back you will find a large deck the perfect spot for outdoor dining or relaxing under the stars.
-
2018-07-18soldstatus $120,000 338-char remark
Show marketing remark (338 chars)
Desirable location in Southside with a great view of the river. This home offers 3 bedrooms and 3 bath, new carpet and fresh paint and deck. Large rooms with 12ft ceilings throughout. Master bedroom with two walk in closets, bathroom with separate tub and shower, large laundry room. This would make someone an excellent starter home.
-
2018-03-05$124,900 338-char remark
Show marketing remark (338 chars)
Desirable location in Southside with a great view of the river. This home offers 3 bedrooms and 3 bath, new carpet and fresh paint and deck. Large rooms with 12ft ceilings throughout. Master bedroom with two walk in closets, bathroom with separate tub and shower, large laundry room. This would make someone an excellent starter home.
ⓘ Source: listings_history table (triggers on properties + properties_extension) + one-shot
backfill from property_details.listing_events for pre-trigger history.
Tax reassessment forecast AL · Resets to sale price
- Current annual tax
- $557 · $46/mo
- Projected year-2 tax
- $881 · $73/mo
- Expected delta
- +$324/yr (+$27/mo · 58.2%)
ⓘ Screening estimate from a state-policy table — verify with the county assessor before closing.
Climate risk First Street
- Flood 1/10 Low FEMA zone X (unshaded) · 0% chance over 30 yrs
- Wildfire 4/10 Moderate
- Heat 6/10 Major 7 d/yr ≥106°F today · 19 d/yr by 30 yrs out
- Wind 4/10 Moderate 22% chance of damaging wind over 30 yrs
- Air quality 2/10 Low 1 unhealthy d/yr today · 2 by 30 yrs out
Nearby sold comps map
Loading sold comps map…
Walkable amenities ~0.75 mi
Loading nearby amenities…
Taxation est. · year 1
- Rental income
- $29,720
- − Mortgage interest
- −$12,038
- − Property taxes
- −$557
- − Insurance
- −$1,074
- − Repairs & maintenance
- −$2,378
- − Management
- −$2,378
- − Depreciation
- −$6,252
- Taxable income
- $5,044
- Est. tax owed @ 24.0%
- −$1,210
- After-tax cash flow
- $7,113/yr
For passive investors: Depreciation is non-cash, so a rental often shows a tax loss while cash-flowing — sheltering income. Rental losses are passive: they offset passive income freely, and up to $25,000/yr can offset ordinary (W-2) income if you actively participate and your MAGI is under $100k (phasing out to $0 by $150k); unused losses carry forward. On sale, claimed depreciation is recaptured at up to 25%, and gains may owe capital-gains tax (a 1031 exchange can defer both). Figures are a year-1 estimate at your 24.0% rate — not tax advice; consult a CPA.
Schools (NCES district)
- District
- Etowah County
- NCES district ID
- 0101380
- Math proficiency
- 21% ▼ -28.00%
- Reading proficiency
- 52% ▼ -1.00%
- Median HH income
- $46,403
- Composite
- 31.12/100
- National rank
- #6062
- State rank
- #36 of 129 in AL
Livability — Southside
- Score
- 68/100
- State rank
- #73
- US rank
- #9908
Category grades
Schools grade is shown separately in the Schools card above.
Census & demographics
- Census place
- Southside, AL
- City population
- 9,299
- Population (ZIP)
- 9,299
Population outlook (Etowah County) Hauer SSP2
- Today (2025)
- 100,500 people
- By 2030
- 98,488 · -2.0%
- By 2040
- 93,731 · -6.7%
- By 2050
- 88,681 · -11.8%
- By 2075
- 76,746 · -23.6%
- By 2100
- 65,373 · -35.0%
Race, ethnicity, and origin ACS 2023
- Neighborhood character
- Predominantly White (90%)
- Race & ethnicity
- White 90% Black 4% Hispanic / Latino 3% Two or more races 2%
- Common ancestry
- Italian 2% Scottish 2% Slovak 1%
- Foreign-born
- 1% · Canada
- Languages at home
- 98% English-only · Spanish 2%
Political lean MEDSL · Etowah
- 2024 margin
- Solid R (+55.7) · D 21.8% · R 77.5%
- 2008→2024 swing
- -17.5pp toward R · 2008: -38.2pp · 2024: -55.7pp
- All cycles
- 2024: R+55.7 2020: R+50.2 2016: R+50.1 2012: R+38.4 2008: R+38.2
Not yet ingested
- Civics
- —
Market trends
- HPI YoY
- ▼ -72.98%
- Current HPI
- 208.5419
- Rent YoY
- —
- Metro
- —
- State GDP YoY
- ▲ 2.94%
- F500 in state
- 4
Industry mix (Fortune 500 HQ in AL)
| Industry | F500 HQs | Revenue |
|---|---|---|
| Financial Services | 1 | $8B |
|
||
| Healthcare | 1 | $5B |
|
||
Price history
+84.1% since first listed3 events — show timeline
- 2026-04-22 Listed $229,900 VMLS
- 2018-07-18 Sold (MLS) $120,000 VMLS
- 2018-03-05 Listed $124,900 VMLS
Property tax history
-1.4%/yrLatest (2025): $557 · +0.0% YoY. Source: county tax records.
Cash-flow waterfall
monthlySold comps — $/sqft
last 12 mo · ≤1 miLoading sold comps…