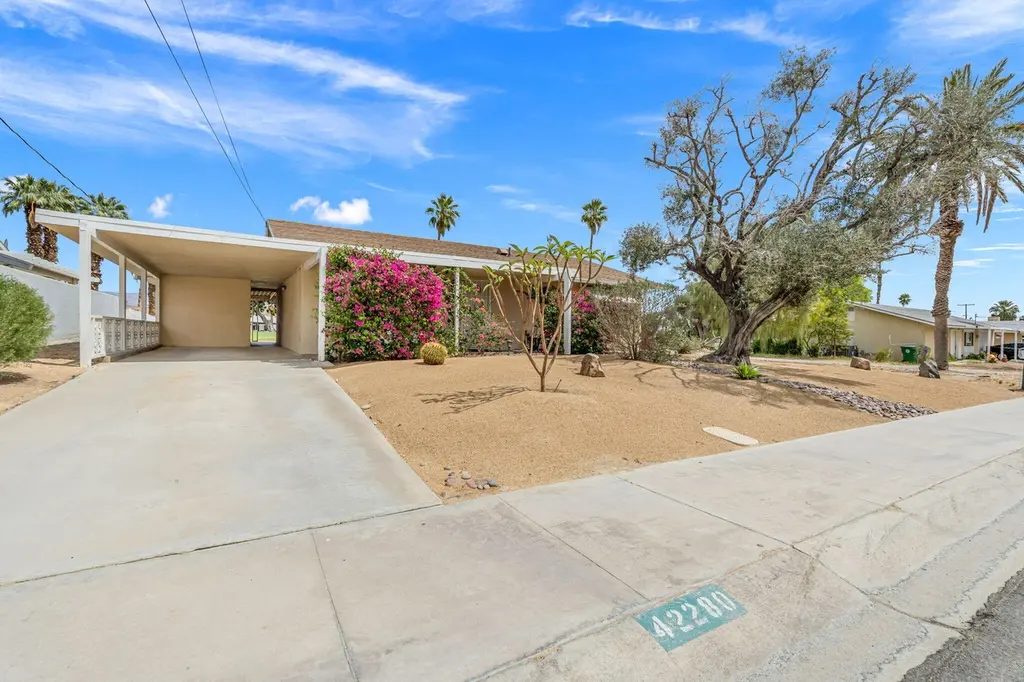
42280 Kansas St · Palm Desert, CA
Flood risk 1/10 · Minimal
- FEMA flood zone
- X (unshaded)
- Chance of flooding over 30 yrs
- 0.0%
- Est. flood insurance / yr
- $507 – $1,088
Fire risk 2/10 · Minimal
- Est. fire insurance / yr
- $659 – $1,223
Heat risk 9/10 · Severe
- Hot days now (above 114°F)
- 7 days/yr
- Hot days in 30 yrs
- 19 days/yr
Wind risk 1/10 · Minimal
- Chance of severe wind over 30 yrs
- —
Air-quality risk 4/10 · Minor
- Unhealthy air days now
- 4 days/yr
- Unhealthy air days in 30 yrs
- 5 days/yr
Risk factors via First Street. Map © Google.
Why this score? — see what drove the D grade
The composite is a weighted blend of 9 inputs, each scored 0–100. Each bar is that input's sub-score; the figure is the points it added to the 100-point composite (weight × sub-score).
- Cash flow +13.7/30.0
- ARV discount +10.2/15.0
- DSCR +4.1/10.0
- Schools +3.8/10.0
- 1% rule +2.6/10.0
- Livability +2.6/5.0
- Condition / age +2.5/5.0
- Rent growth +2.4/5.0
- Appreciation +0.0/10.0
$399,000
🖨 Deal sheet 📄 Offer letter ✓ Due diligence
Listing remarks
This beautifully updated 2-bedroom, 2-bath home is ideally located on the golf course, offering stunning eastern mountain views and a premium setting. In addition to its exceptional location, the home features highly desirable and unique attributes, including protected open space to the west--providing added privacy, abundant natural light, and unobstructed surroundings--as well as a premier tee box view that delivers front-row scenery and an elevated sense of resort-style living. With fresh interior and exterior paint and brand-new flooring throughout, the home showcases a clean, modern aesthetic. The upgraded kitchen includes newer countertops, a new dishwasher, stainless steel double sin
Key facts
- Upgraded kitchen
- Protected open space
- Premier tee box view
Tags
Property features AI
Finance
- Other: Listing terms include Conventional, FHA, Cash to New Loan, Cash; Will not consider lease; Short term rental status unknown; Disclosures: Homeowners Association
- HOA & community: No monthly association fees reported; Development has a golf course; Not a gated community
Exterior
- Parking: Total 4 parking spaces; 2 covered carport spaces; Attached carport; Driveway parking; On-street parking
- Utilities: PUD: Yes; Sewer: In street on bond
- Home design: Single family residence, detached; One story (ground level)
- Construction: Year built per assessor
- Exterior features: Community pool (in-ground); In-ground spa/hot tub (heated by gas); Community pool accessories unknown; Sprinklers; No fencing; No security features noted; Golf course and mountain views; Fee simple land
Interior
- Kitchen: Dishwasher; Electric cooktop
- Flooring: Laminate flooring
- Bathrooms: 2 full bathrooms
- Heating & cooling: Forced air heating; Air conditioning
- Interior features: Unfurnished; Living Room; Remodeled kitchen
Neighborhood map
What this means for you Summary
Snapshot
- This is a 2-bed/2.0-bath single-family listed at $399k.
Deal economics
- At list price, monthly cash flow is $28 ($338/yr) — positive.
- The deal already cash-flows at list — no discount required.
- To meet the 1% rule (rent ≥ 1% of price), the offer needs to be $305k (23.5% below list).
- Recommended offer: $305k (23.5% below list) — sets the bar for 1% rule.
- Cap rate 6.4% vs local median 3.5% in Palm Desert — top-decile yield for the area; either an underpriced asset or a hidden risk that comps aren't pricing in. Stress-test before assuming the spread holds.
Location & tenants
- Location reads 51/100 on livability (#1,050 in CA) — a working-class tenant base; expect higher turnover. Strengths: schools A-, employment B+, housing B; Watch: crime D, amenities F, commute F.
- Desert Sands Unified (suburban): math 31% / reading 56% proficiency, ranked #199 of 517 in CA (top 38%) — families likely to look elsewhere, expect single-tenant / working-renter base with shorter leases.
- Market conditions: Rents soft (-0.3%/yr); 626 active listings in the ZIP; 40 comparable units currently listed for rent nearby; rentals lingering (median 44d on market — plan ~5-8 weeks vacancy on turnover, expect pricing pressure); 50% of comp listings sitting > 30 days — soft ceiling on asking rent; solid renter incomes; 9,195 units permitted in Riverside County in 2024 (1,512 in 5+ unit buildings).
- This rent runs 41% of the median local income ($88k/yr) — at the standard rent-burdened threshold; future hikes will face affordability resistance.
Forward outlook
- Local home prices are declining (-3.0%/yr); year-one equity from $3k of loan paydown is wiped out by about $12k of value loss. Plan a longer hold.
- Riverside County population projected at +22% by 2050 — long-run rental-demand tailwind backs the buy-and-hold thesis.
Negotiation context
- Only 9 days on market — expect competitive offers; lowballing is unlikely to land.
- 3 sale attempts since 2y ago with the ask held roughly flat each time — persistent listings suggest the price (not the market) is what's stuck; bring a comps-based counter.
Risks & watch-outs
- Climate carrying-cost: extreme-heat days projected 7→19/yr by 2055 (HVAC capex compounding) — expect insurance premiums to compound above CPI over the hold.
Questions for the listing agent
- Built in 1961 — when were the roof, HVAC, electrical panel, plumbing, and water heater last replaced?
- Is there a deadline driving the sale (1031 exchange, divorce, estate, relocation)? That informs how much negotiation room exists.
- Schools are A-rated — typically a magnet for longer-tenancy family renters. What's the average tenant stay here, and is there a school-zone premium baked into asking?
- Crime grade is D in this area — have there been break-ins, vandalism, or insurance claims at this property in the last 3 years? What carrier currently insures it and at what premium?
- The area grade is low — what's the realistic commute time and amenity access for the typical tenant pool here? Any planned neighborhood developments (good or bad) we should know about?
- What's the average days-on-market for RENTAL listings here right now (not sales)? A rising rental-DOM trend means longer vacancies and softer asking-rent achievability than the comps imply.
- What's the recent tenant-quality profile in this submarket — average credit score on applications, eviction rate, late-payment / NSF rate, and stable-employment percentage? A property-management company in the area should have these aggregated.
- How much new for-sale + rental construction is in the pipeline within 1–3 miles? Heavy new supply typically softens prices + rents 12–24 months out; constrained supply supports both.
Investment metrics
- 1% rule
- 0.76% ✗
- Cap rate
- 6.38%
- Cash-on-cash
- 0.30%
- DSCR
- 1.01
- GRM
- 10.9
CMA / ARV
- ARV (median comp)
- $424,038
- List price
- $399,000
- Delta
- -5.90%
- Verdict
- FAIR
- Comps
- 20 within 1.0 mi
Show comp detail 12 sales within ~0.75 mi
| Address | Dist | Beds/Ba | Sqft | Sold | Price | $/sf | Match |
|---|---|---|---|---|---|---|---|
| 42585 Iowa St | 0.19mi | 2/2.0 | 1,064 (0%) | 4mo | $385,000 | $362 | 88 |
| 77225 California Dr | 0.32mi | 2/2.0 | 1,064 (0%) | 1mo | $394,000 | $370 | 85 |
| 42660 Wisconsin Ave | 0.23mi | 2/2.0 | 1,064 (0%) | 7mo | $382,500 | $359 | 83 |
| 42720 Kansas St | 0.27mi | 2/2.0 | 1,064 (0%) | 8mo | $395,000 | $371 | 81 |
| 43000 Connecticut St | 0.39mi | 2/2.0 | 1,064 (0%) | 8mo | $419,500 | $394 | 75 |
| 42935 Texas | 0.47mi | 2/2.0 | 1,061 (-0%) | 8mo | $392,000 | $369 | 71 |
| 42970 Texas Ave | 0.50mi | 2/2.0 | 1,140 (+7%) | 1mo | $385,000 | $338 | 64 |
| 77385 Minnesota Ave | 0.33mi | 2/2.0 | 1,162 (+9%) | 15mo | $418,000 | $360 | 57 |
| 42815 Warner Trl | 0.48mi | 2/2.0 | 1,200 (+13%) | 11mo | $416,500 | $347 | 47 |
| 42720 Virginia Ave | 0.60mi | 3/2.0 (+1) | 1,158 (+9%) | 15mo | $480,000 | $415 | 40 |
| 77575 California Dr | 0.51mi | 3/1.0 (+1) | 924 (-13%) | 8mo | $365,000 | $395 | 39 |
| 42885 Virginia Ave | 0.68mi | 3/2.0 (+1) | 1,204 (+13%) | 16mo | $450,000 | $374 | 28 |
Match score weights: distance 35% · size 25% · config 20% · recency 20%. Top-matched comps best support the ARV.
Projected returns pro-forma
-3.0% appreciation · 0.0% rent growth · sell at horizon
- IRR
- -18.8%
- Equity multiple
- 0.36×
- Total profit
- $-71,988
- Equity at exit
- $59,492
- IRR
- -17.8%
- Equity multiple
- 0.14×
- Total profit
- $-95,687
- Equity at exit
- $34,498
Cash invested: $111,720 (down + closing). Projections, not guarantees.
Landlord ↔ Tenant lean methodology
- Overall (STATE)
- 18 Strongly Tenant-Friendly
- State California
- 18 Strongly Tenant-Friendly · D+13
- County
- — inherits STATE
- City
- — inherits STATE
ZIP-level market 92211
- Rents YoY
- -0.3%
- Active inventory
- 626
- Price-to-rent
- 10.9×
Monthly cashflow live
- Estimated rent
- $3,052 high interval (Pro) →
- Mortgage (P&I)
- −$2,092
- Tax from tax record
- −$124 /mo · $1,490/yr
- Insurance
- −$166
- HOA
- −$0
- Vacancy / Maint / Mgmt
- −$641
- Net cashflow
- $28
Break-even live
UW: 25.0% down · 7.5% · 30yr · 1.5% tax · 5.0% vac · 8.0% maint · 8.0% mgmt
Financing live
Cash to close
- Down payment
- $99,750
- Closing costs
- $11,970
- Reserves months
- —
- Total cash needed
- —
Loan-product check · same deal, 3 products live
Conventional
25% down · 7.5% · 30yr
- Down + closing
- —
- Monthly P&I
- —
- Monthly cashflow
- —
- DSCR
- —
- Eligible?
- —
Personal DTI + credit; lowest rate.
DSCR
20% down · 8.5% · 30yr
- Down + closing
- —
- Monthly P&I
- —
- Monthly cashflow
- —
- DSCR
- —
- Eligible?
- —
No personal income docs; deal must DSCR.
Hard money
10% down · 12.0% · 12mo
- Down + closing
- —
- Monthly P&I
- —
- Monthly cashflow
- —
- DSCR
- —
- Eligible?
- —
Short-term bridge; refi at stabilization.
Rent comps 40 comps
| Address | Beds | Baths | Sqft | Rent | $/sqft | DOM | Units | Dist |
|---|---|---|---|---|---|---|---|---|
| 77160 Minnesota Ave Palm Desert, CA | 3.0 | 2.0 | 1330 | $2,900 | $2.18 | 43d | 1 | 0.09mi |
| 77179 Pauma Valley Way Palm Desert, CA | 2.0 | 2.0 | 940 | $3,200 | $3.40 | 24d | 1 | 0.13mi |
| 76923 Turendot St Palm Desert, CA | 2.0 | 2.0 | 1380 | $2,200 | $1.59 | 18d | 1 | 0.18mi |
| 42680 Wisconsin Ave Palm Desert, CA | 2.0 | 1.5 | 1064 | $2,400 | $2.26 | 43d | 1 | 0.21mi |
| 76915 Scimitar Way Palm Desert, CA | 2.0 | 2.5 | 1350 | $2,800 | $2.07 | 12d | 1 | 0.23mi |
| 42315 Liolios Dr Palm Desert, CA | 2.0 | 2.0 | 1410 | $5,000 | $3.55 | 23d | 1 | 0.24mi |
| 41691 Kansas St Palm Desert, CA | 2.0 | 2.0 | 1091 | $5,000 | $4.58 | 43d | 1 | 0.26mi |
| 77310 Minnesota Ave Palm Desert, CA | 2.0 | 2.0 | 1216 | $3,000 | $2.47 | 23d | 1 | 0.26mi |
| 77355 Minnesota Ave Palm Desert, CA | 2.0 | 2.0 | 1342 | $3,600 | $2.68 | 5d | 1 | 0.31mi |
| 77385 Michigan Dr Palm Desert, CA | 2.0 | 2.0 | 1200 | $2,700 | $2.25 | 43d | 1 | 0.33mi |
| 41869 Preston Trl Palm Desert, CA | 2.0 | 2.0 | 1360 | $5,500 | $4.04 | 43d | 1 | 0.34mi |
| 77380 Minnesota Ave Palm Desert, CA | 2.0 | 2.0 | 1064 | $2,750 | $2.58 | 43d | 1 | 0.34mi |
| 41417 Princeville Ln Palm Desert, CA | 2.0 | 2.0 | 1360 | $2,500 | $1.84 | 43d | 1 | 0.41mi |
| 42192 Sultan Ave Palm Desert, CA | 2.0 | 2.0 | 1230 | $2,800 | $2.28 | 24d | 1 | 0.41mi |
| 41640 Jupiter Hills Ct Unit 35-15 Palm Desert, CA | 2.0 | 2.0 | 1300 | $2,700 | $2.08 | 18d | 1 | 0.42mi |
| 42297 Sultan Ave Palm Desert, CA | 2.0 | 2.0 | 1230 | $3,200 | $2.60 | 43d | 1 | 0.46mi |
| 41773 Preston Trl Palm Desert, CA | 2.0 | 2.0 | 1091 | $6,000 | $5.50 | 43d | 1 | 0.48mi |
| 41450 Inverness Way Palm Desert, CA | 2.0 | 2.0 | 1184 | $4,900 | $4.14 | 43d | 1 | 0.49mi |
| 41694 Preston Trl Palm Desert, CA | 2.0 | 2.0 | 1360 | $5,000 | $3.68 | 43d | 1 | 0.50mi |
| 42275 Omar Pl Palm Desert, CA | 2.0 | 2.0 | 1139 | $4,500 | $3.95 | 43d | 1 | 0.50mi |
| 76706 New York Ave Palm Desert, CA | 3.0 | 2.0 | 1482 | $3,500 | $2.36 | 43d | 1 | 0.55mi |
| 77605 California Dr Palm Desert, CA | 3.0 | 2.0 | 1330 | $2,400 | $1.80 | 5d | 1 | 0.55mi |
| 42654 Sand Dune Dr Palm Desert, CA | 2.0 | 2.0 | 1340 | $2,500 | $1.87 | 43d | 1 | 0.57mi |
| 43035 Tennessee Ave Palm Desert, CA | 2.0 | 2.0 | 1238 | $2,600 | $2.10 | 10d | 1 | 0.59mi |
| 77655 California Dr Palm Desert, CA | 3.0 | 2.0 | 1330 | $1,300 | $0.98 | 5d | 1 | 0.61mi |
| 76574 Sheba Way Palm Desert, CA | 2.0 | 2.0 | 1380 | $2,500 | $1.81 | 43d | 1 | 0.61mi |
| 43420 Illinois Ave Palm Desert, CA | 2.0 | 2.0 | 1258 | $2,500 | $1.99 | 5d | 1 | 0.65mi |
| 43420 Illinois Ave Palm Desert, CA | 2.0 | 2.0 | 1258 | $2,500 | $1.99 | 43d | 1 | 0.65mi |
| 76550 New York Ave Palm Desert, CA | 3.0 | 2.0 | 1482 | $4,500 | $3.04 | 43d | 1 | 0.66mi |
| 43320 Texas Ave Palm Desert, CA | 3.0 | 2.0 | 1200 | $2,395 | $2.00 | 43d | 1 | 0.69mi |
| 43160 Virginia Ave Palm Desert, CA | 3.0 | 2.0 | 1402 | $2,795 | $1.99 | 5d | 1 | 0.71mi |
| 77054 California Dr Palm Desert, CA | 2.0 | 2.0 | 1140 | $3,000 | $2.63 | 15d | 1 | 0.71mi |
| 40960 La Costa Cir W Palm Desert, CA | 3.0 | 2.0 | 1333 | $2,599 | $1.95 | 24d | 1 | 0.72mi |
| 77805 California Dr Palm Desert, CA | 1.0 | 1.0 | 750 | $1,500 | $2.00 | 24d | 1 | 0.74mi |
| 40981 Preston Trl Palm Desert, CA | 2.0 | 3.0 | 1184 | $2,995 | $2.53 | 43d | 1 | 0.76mi |
| 40963 Preston Trl Unit 3911 Palm Desert, CA | 2.0 | 2.0 | 1184 | $2,650 | $2.24 | 12d | 1 | 0.77mi |
| 77584 Woodhaven Dr N Palm Desert, CA | 2.0 | 2.0 | 1392 | $4,995 | $3.59 | 24d | 1 | 0.77mi |
| 40963 Preston Trl Palm Desert, CA | 2.0 | 2.0 | 1184 | $2,650 | $2.24 | 24d | 1 | 0.77mi |
| 77835 California Dr Unit C1 Palm Desert, CA | 1.0 | 1.0 | 750 | $1,700 | $2.27 | 20d | 1 | 0.77mi |
| 43381 Virginia Ave Palm Desert, CA | 2.0 | 2.0 | 1269 | $4,500 | $3.55 | 44d | 1 | 0.79mi |
Listing history 18 events
-
2026-06-18days on market $399,000 Active 9 DOM
-
2026-06-17days on market $399,000 Active 8 DOM
-
2026-06-16days on market $399,000 Active 7 DOM
-
2026-06-15days on market $399,000 Active 6 DOM
-
2026-06-13days on market $399,000 Active 4 DOM
-
2026-06-10days on market $399,000 Active 1 DOM
-
2026-06-08days on market $399,000 Active 66 DOM
-
2026-06-07days on market $399,000 Active 65 DOM
-
2026-06-04days on market $399,000 Active 62 DOM
-
2026-06-03days on market $399,000 Active 61 DOM
-
2026-06-02days on market $399,000 Active 60 DOM
-
2026-06-01days on market $399,000 Active 59 DOM
-
2026-05-31days on market $399,000 Active 58 DOM
-
2026-05-13price $399,000 1539-char remark
-
2026-04-03$425,000 Active 1539-char remark
-
2025-01-25historical $2,195
-
2025-01-08price $2,195
-
2024-10-04$2,200
ⓘ Source: listings_history table (triggers on properties + properties_extension) + one-shot
backfill from property_details.listing_events for pre-trigger history.
Tax reassessment forecast CA · Resets to sale price
- Current annual tax
- $1,490 · $124/mo
- Projected year-2 tax
- $3,032 · $253/mo
- Expected delta
- +$1,543/yr (+$129/mo · 103.6%)
ⓘ Screening estimate from a state-policy table — verify with the county assessor before closing.
Climate risk First Street
- Flood 1/10 Low FEMA zone X (unshaded) · 0% chance over 30 yrs
- Wildfire 2/10 Low
- Heat 9/10 Extreme 7 d/yr ≥114°F today · 19 d/yr by 30 yrs out
- Wind 1/10 Low
- Air quality 4/10 Moderate 4 unhealthy d/yr today · 5 by 30 yrs out
Nearby sold comps map
Loading sold comps map…
Walkable amenities ~0.75 mi
Loading nearby amenities…
Taxation est. · year 1
- Rental income
- $36,622
- − Mortgage interest
- −$22,350
- − Property taxes
- −$1,490
- − Insurance
- −$1,995
- − Repairs & maintenance
- −$2,930
- − Management
- −$2,930
- − Depreciation
- −$11,607
- Taxable loss
- −$6,679
- Est. tax savings @ 24.0%
- +$1,603
- After-tax cash flow
- $1,941/yr
For passive investors: Depreciation is non-cash, so a rental often shows a tax loss while cash-flowing — sheltering income. Rental losses are passive: they offset passive income freely, and up to $25,000/yr can offset ordinary (W-2) income if you actively participate and your MAGI is under $100k (phasing out to $0 by $150k); unused losses carry forward. On sale, claimed depreciation is recaptured at up to 25%, and gains may owe capital-gains tax (a 1031 exchange can defer both). Figures are a year-1 estimate at your 24.0% rate — not tax advice; consult a CPA.
Schools (NCES district)
- District
- Desert Sands Unified
- NCES district ID
- 0611110
- Math proficiency
- 31% ▼ -4.00%
- Reading proficiency
- 56% ▲ 7.00%
- Median HH income
- $54,957
- Composite
- 37.77/100
- National rank
- #4346
- State rank
- #199 of 517 in CA
Livability — Palm Desert
- Score
- 51/100
- State rank
- #1050
- US rank
- #25164
Category grades
Schools grade is shown separately in the Schools card above.
Census & demographics
- Census place
- Palm Desert, CA
- County
- Riverside County · 2,287,001 people
- City population
- 58,615
- Metro
- Riverside-San Bernardino-Ontario, CA
- Population (ZIP)
- 28,092
- Household income
- $88,477
- Rent vs Own
- Severe rent burden
- 1181.0
Population outlook (Riverside County) Hauer SSP2
- Today (2025)
- 2,664,475 people
- By 2030
- 2,802,692 · +5.2%
- By 2040
- 3,050,904 · +14.5%
- By 2050
- 3,256,783 · +22.2%
- By 2075
- 3,655,058 · +37.2%
- By 2100
- 3,766,594 · +41.4%
Race, ethnicity, and origin ACS 2023
- Neighborhood character
- Predominantly White (75%)
- Race & ethnicity
- White 75% Hispanic / Latino 16% Two or more races 11% Asian 4% Black 3% Native American 1%
- Hispanic origin (detail)
- Mexican 12%
- Common ancestry
- Scotch-Irish 3% Slovak 3% Romanian 3%
- Foreign-born
- 16% · Canada, China
- Languages at home
- 85% English-only · Spanish 9% Other Indo-European 2% Tagalog/Filipino 1%
Political lean MEDSL · Riverside
- 2024 margin
- Toss-up / Even · D 48.0% · R 49.3% · Other 2.6%
- 2008→2024 swing
- -3.6pp toward R · 2008: 2.3pp · 2024: -1.3pp
- All cycles
- 2024: R+1.3 2020: D+8.0 2016: D+4.3 2012: R+0.4 2008: D+2.3
Not yet ingested
- Civics
- —
Market trends
- HPI YoY
- ▼ -166.92%
- Current HPI
- 233.4619
- Rent YoY
- ▼ -0.30%
- Metro
- Riverside-San Bernardino-Ontario, CA
- State GDP YoY
- ▲ 3.21%
- F500 in state
- 116
Industry mix (Fortune 500 HQ in CA)
| Industry | F500 HQs | Revenue |
|---|---|---|
| Technology | 27 | $1,492B |
|
||
| Financial Services | 3 | $174B |
|
||
| Retail | 3 | $44B |
|
||
| Insurance | 3 | $26B |
|
||
| Media / Entertainment | 2 | $115B |
|
||
| Pharmaceuticals / Biotech | 2 | $62B |
|
||
Price history
+17581.8% since first listed8 events — show timeline
- 2026-06-19 Price Changed $389,000 GPSMLS
- 2026-06-09 Listed $399,000 GPSMLS
- 2026-06-08 Listing Removed — GPSMLS
- 2026-05-13 Price Changed $399,000 GPSMLS
- 2026-04-03 Listed $425,000 GPSMLS
- 2025-01-25 Rental Removed $2,195 CRMLS
- 2025-01-08 Price Changed $2,195 CRMLS
- 2024-10-04 Listed for Rent $2,200 CRMLS
Property tax history
+3.3%/yrLatest (2025): $1,490 · +4.8% YoY. Source: county tax records.
Cash-flow waterfall
monthlySold comps — $/sqft
last 12 mo · ≤1 miLoading sold comps…