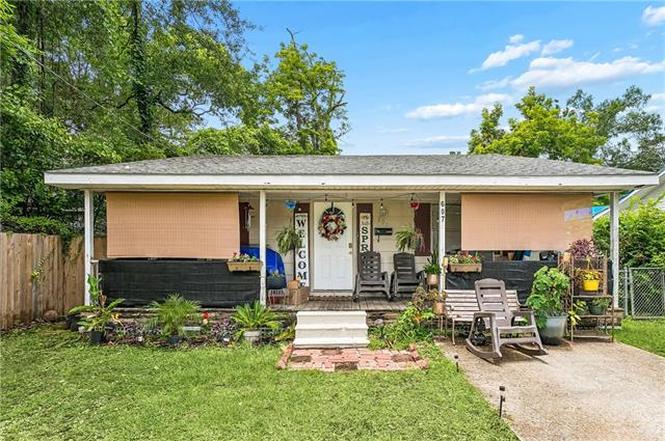
607 E Illinois St · Hammond, LA
Flood risk 1/10 · Minimal
- FEMA flood zone
- X (unshaded)
- Chance of flooding over 30 yrs
- 0.0%
- Est. flood insurance / yr
- $507 – $1,088
Fire risk 4/10 · Minor
- Est. fire insurance / yr
- $1,269 – $2,357
Heat risk 8/10 · Major
- Hot days now (above 109°F)
- 7 days/yr
- Hot days in 30 yrs
- 21 days/yr
Wind risk 9/10 · Severe
- Chance of severe wind over 30 yrs
- 99.0%
Air-quality risk 2/10 · Minimal
- Unhealthy air days now
- 0 days/yr
- Unhealthy air days in 30 yrs
- 1 days/yr
Risk factors via First Street. Map © Google.
Why this score? — see what drove the C grade
The composite is a weighted blend of 9 inputs, each scored 0–100. Each bar is that input's sub-score; the figure is the points it added to the 100-point composite (weight × sub-score).
- Cash flow +26.9/30.0
- DSCR +9.3/10.0
- 1% rule +6.1/10.0
- Livability +3.5/5.0
- ARV discount +3.0/15.0
- Rent growth +2.6/5.0
- Condition / age +2.5/5.0
- Schools +2.0/10.0
- Appreciation +0.0/10.0
$140,000
🖨 Deal sheet 📄 Offer letter ✓ Due diligence
Listing remarks MLS
3 bed 2 bath with new roof and new AC! Flood zone X and has never flooded.
Key facts
- Never flooded
- New roof
- 4,791 sq ft lot
Tags
Property features AI
Exterior
- Utilities: Electric service: Entergy
- Home design: Single family residence
- Construction: Composition roof
- Exterior features: Chain link fencing; Workshop (outbuilding)
Interior
- Kitchen: Dishwasher; Refrigerator
- Bedrooms: Two bedrooms (Bedroom 1, Bedroom 2)
- Bathrooms: Two full bathrooms
- Heating & cooling: Central heating; Central air conditioning
- Interior features: Living Room; Kitchen; Bedroom 1; Bedroom 2
Neighborhood map
What this means for you Summary
Snapshot
- This is a 3-bed/2.0-bath single-family listed at $140k.
Deal economics
- At list price, monthly cash flow is $387 ($5k/yr) — positive.
- The deal already cash-flows at list — no discount required.
- Meets the 1% rule at list price ($2k rent vs $140k).
- Cap rate 9.6% vs local median 5.0% in Hammond — top-decile yield for the area; either an underpriced asset or a hidden risk that comps aren't pricing in. Stress-test before assuming the spread holds.
Location & tenants
- Location reads 69/100 on livability (#77 in LA) — a middle-class / working-renter tenant base. Strengths: cost of living A+, health & safety A+; Watch: amenities C-, commute D+, schools D.
- Tangipahoa Parish (rural): math 18% / reading 29% proficiency, ranked #63 of 98 in LA (top 64%) — low school quality limits family demand, transient renter base, plan for 1-2y turnover; 73% free/reduced lunch — lower-income household profile, screen leases tightly.
- Market conditions: Rents flat; 329 active listings in the ZIP; 12 comparable units currently listed for rent nearby; rentals lingering (median 44d on market — plan ~5-8 weeks vacancy on turnover, expect pricing pressure); 100% of comp listings sitting > 30 days — soft ceiling on asking rent; 1,085 units permitted in Tangipahoa Parish in 2024 (378 in 5+ unit buildings).
- This rent runs 36% of the median local income ($51k/yr) — at the standard rent-burdened threshold; future hikes will face affordability resistance.
Forward outlook
- Local home prices are declining (-3.0%/yr); year-one equity from $968 of loan paydown is wiped out by about $4k of value loss. Plan a longer hold.
- Tangipahoa County population projected at +22% by 2050 — long-run rental-demand tailwind backs the buy-and-hold thesis.
Negotiation context
- Only 2 days on market — expect competitive offers; lowballing is unlikely to land.
- 9 sale attempts since 26y ago; this cycle's ask is 17% above the opening price — seller raised mid-cycle; expect resistance to lowballs.
- Current owner paid $120k; 17% above their basis — modest negotiation headroom, anchor on the comps not their cost.
Risks & watch-outs
- Climate carrying-cost: severe wind risk, 99% chance of damaging wind over 30y; extreme-heat days projected 7→21/yr by 2055 (HVAC capex compounding) — expect insurance premiums to compound above CPI over the hold.
Questions for the listing agent
- Is there a deadline driving the sale (1031 exchange, divorce, estate, relocation)? That informs how much negotiation room exists.
- Schools are D-rated, which usually means shorter tenancies and higher turnover. Who's the typical renter profile here, and what's been the actual vacancy rate?
- Crime grade is F in this area — have there been break-ins, vandalism, or insurance claims at this property in the last 3 years? What carrier currently insures it and at what premium?
- What's the average days-on-market for RENTAL listings here right now (not sales)? A rising rental-DOM trend means longer vacancies and softer asking-rent achievability than the comps imply.
- What's the recent tenant-quality profile in this submarket — average credit score on applications, eviction rate, late-payment / NSF rate, and stable-employment percentage? A property-management company in the area should have these aggregated.
- How much new for-sale + rental construction is in the pipeline within 1–3 miles? Heavy new supply typically softens prices + rents 12–24 months out; constrained supply supports both.
Investment metrics
- 1% rule
- 1.11% ✓
- Cap rate
- 9.61%
- Cash-on-cash
- 11.84%
- DSCR
- 1.53
- GRM
- 7.5
CMA / ARV
- ARV (on-the-fly)
- $127,296
- Comps found
- 12
Show comp detail 12 sales within ~0.75 mi
| Address | Dist | Beds/Ba | Sqft | Sold | Price | $/sf | Match |
|---|---|---|---|---|---|---|---|
| 707 E Louisiana Ave | 0.11mi | 3/2.0 | 1,028 (-6%) | 1mo | $140,000 | $136 | 85 |
| 803 S Chestnut St | 0.07mi | 3/1.0 | 1,133 (+4%) | 2mo | $155,000 | $137 | 85 |
| 506 S Olives St | 0.16mi | 3/2.0 | 1,008 (-7%) | 7mo | $65,250 | $65 | 75 |
| 809 S Chestnut St | 0.09mi | 3/2.0 | 1,150 (+6%) | 15mo | $151,500 | $132 | 74 |
| 406 E Iowa Ave | 0.13mi | 2/2.0 (-1) | 1,000 (-8%) | 2mo | $245,000 | $245 | 73 |
| 805 E Illinois St | 0.15mi | 3/1.0 | 1,041 (-4%) | 12mo | $112,500 | $108 | 72 |
| 303 E Park Ave | 0.24mi | 2/2.0 (-1) | 1,128 (+4%) | 14mo | $185,000 | $164 | 66 |
| 801 S Chestnut St | 0.06mi | 3/1.0 | 1,235 (+14%) | 13mo | $135,000 | $109 | 60 |
| 1006 S Chestnut St | 0.18mi | 3/1.0 | 1,198 (+10%) | 14mo | $135,000 | $113 | 59 |
| 601 S Cherry St | 0.25mi | 3/1.0 | 1,176 (+8%) | 19mo | $128,000 | $109 | 55 |
| 305 Noah James Dr | 0.39mi | 2/1.0 (-1) | 1,030 (-5%) | 14mo | $120,000 | $117 | 52 |
| 506 E Church St | 0.65mi | 3/1.0 | 1,174 (+8%) | 7mo | $49,000 | $42 | 46 |
Match score weights: distance 35% · size 25% · config 20% · recency 20%. Top-matched comps best support the ARV.
Projected returns pro-forma
-3.0% appreciation · 0.33% rent growth · sell at horizon
- IRR
- -1.5%
- Equity multiple
- 0.94×
- Total profit
- $-2,165
- Equity at exit
- $20,874
- IRR
- 5.4%
- Equity multiple
- 1.35×
- Total profit
- $13,844
- Equity at exit
- $12,105
Cash invested: $39,200 (down + closing). Projections, not guarantees.
Landlord ↔ Tenant lean methodology
- Overall (STATE)
- 90 Strongly Landlord-Friendly
- State Louisiana
- 90 Strongly Landlord-Friendly · R+12
- County
- — inherits STATE
- City
- — inherits STATE
ZIP-level market 70403
- Home prices YoY
- -34.1%
- Rents YoY
- 0.3%
- Active inventory
- 329
- Price-to-rent
- 7.5×
Monthly cashflow live
- Estimated rent
- $1,547 high interval (Pro) →
- Mortgage (P&I)
- −$734
- Tax from tax record
- −$43 /mo · $516/yr
- Insurance
- −$58
- HOA
- −$0
- Vacancy / Maint / Mgmt
- −$325
- Net cashflow
- $387
Break-even live
UW: 25.0% down · 7.5% · 30yr · 1.5% tax · 5.0% vac · 8.0% maint · 8.0% mgmt
Financing live
Cash to close
- Down payment
- $35,000
- Closing costs
- $4,200
- Reserves months
- —
- Total cash needed
- —
Loan-product check · same deal, 3 products live
Conventional
25% down · 7.5% · 30yr
- Down + closing
- —
- Monthly P&I
- —
- Monthly cashflow
- —
- DSCR
- —
- Eligible?
- —
Personal DTI + credit; lowest rate.
DSCR
20% down · 8.5% · 30yr
- Down + closing
- —
- Monthly P&I
- —
- Monthly cashflow
- —
- DSCR
- —
- Eligible?
- —
No personal income docs; deal must DSCR.
Hard money
10% down · 12.0% · 12mo
- Down + closing
- —
- Monthly P&I
- —
- Monthly cashflow
- —
- DSCR
- —
- Eligible?
- —
Short-term bridge; refi at stabilization.
Rent comps 12 comps
| Address | Beds | Baths | Sqft | Rent | $/sqft | DOM | Units | Dist |
|---|---|---|---|---|---|---|---|---|
| 402 S Cherry St Hammond, LA | 3.0 | 2.0 | 1400 | $1,700 | $1.21 | 43d | 1 | 0.33mi |
| 100 S Cypress St Hammond, LA | 2.0 | 2.5 | 1100 | $1,750 | $1.59 | 43d | 1 | 0.55mi |
| 1002 S Pine St Hammond, LA | 3.0 | 2.5 | 1324 | $1,500 | $1.13 | 43d | 1 | 0.63mi |
| 221 W Thomas St Unit A Hammond, LA | 3.0 | 1.0 | 1400 | $2,050 | $1.46 | 43d | 1 | 0.68mi |
| 309 Hewitt Rd Unit B Hammond, LA | 2.0 | 1.0 | 806 | $1,350 | $1.67 | 43d | 1 | 0.77mi |
| 44347 Simpson Pl Unit 1 Hammond, LA | 2.0 | 1.0 | 960 | $950 | $0.99 | 43d | 1 | 0.79mi |
| 408 E Michigan St Hammond, LA | 2.0 | 1.0 | 1222 | $1,350 | $1.10 | 43d | 1 | 0.80mi |
| 1600 Bauerle Rd Hammond, LA | 1.0–2.0 | 1.0–2.0 | 884 | $1,751 | $1.98 | 43d | 4 | 0.97mi |
| 207 S Laurel St Unit B Hammond, LA | 3.0 | 2.0 | 1100 | $1,350 | $1.23 | 43d | 1 | 1.05mi |
| 16218 E Minnesota Park Rd Unit 3B Hammond, LA | 2.0 | 2.5 | 1095 | $1,450 | $1.32 | 43d | 1 | 1.10mi |
| 204 W Clark St Hammond, LA | 2.0 | 1.0 | 840 | $900 | $1.07 | 43d | 1 | 1.40mi |
| 17597 Tangi Lake Dr Hammond, LA | 1.0–3.0 | 1.0–2.5 | 1075 | $1,500 | $1.40 | 43d | 1 | 1.46mi |
Listing history 3 events
-
2026-06-19days on market $140,000 Coming Soon 2 DOM
-
2026-06-17remarks 371-char remark
-
2026-06-17$140,000 Coming Soon 1 DOM
ⓘ Source: listings_history table (triggers on properties + properties_extension) + one-shot
backfill from property_details.listing_events for pre-trigger history.
Tax reassessment forecast LA · Resets to sale price
- Current annual tax
- $516 · $43/mo
- Projected year-2 tax
- $770 · $64/mo
- Expected delta
- +$254/yr (+$21/mo · 49.3%)
ⓘ Screening estimate from a state-policy table — verify with the county assessor before closing.
Climate risk First Street
- Flood 1/10 Low FEMA zone X (unshaded) · 0% chance over 30 yrs
- Wildfire 4/10 Moderate
- Heat 8/10 Severe 7 d/yr ≥109°F today · 21 d/yr by 30 yrs out
- Wind 9/10 Extreme 99% chance of damaging wind over 30 yrs
- Air quality 2/10 Low 0 unhealthy d/yr today · 1 by 30 yrs out
Nearby sold comps map
Loading sold comps map…
Walkable amenities ~0.75 mi
Loading nearby amenities…
Taxation est. · year 1
- Rental income
- $18,564
- − Mortgage interest
- −$7,842
- − Property taxes
- −$516
- − Insurance
- −$700
- − Repairs & maintenance
- −$1,485
- − Management
- −$1,485
- − Depreciation
- −$4,073
- Taxable income
- $2,463
- Est. tax owed @ 24.0%
- −$591
- After-tax cash flow
- $4,049/yr
For passive investors: Depreciation is non-cash, so a rental often shows a tax loss while cash-flowing — sheltering income. Rental losses are passive: they offset passive income freely, and up to $25,000/yr can offset ordinary (W-2) income if you actively participate and your MAGI is under $100k (phasing out to $0 by $150k); unused losses carry forward. On sale, claimed depreciation is recaptured at up to 25%, and gains may owe capital-gains tax (a 1031 exchange can defer both). Figures are a year-1 estimate at your 24.0% rate — not tax advice; consult a CPA.
Schools (NCES district)
- District
- Tangipahoa Parish
- NCES district ID
- 2201680
- Math proficiency
- 18% ▼ -32.00%
- Reading proficiency
- 29% ▼ -31.00%
- Median HH income
- $41,283
- Composite
- 19.94/100
- National rank
- #8676
- State rank
- #63 of 98 in LA
Livability — Hammond
- Score
- 69/100
- State rank
- #77
- US rank
- #8868
Category grades
Schools grade is shown separately in the Schools card above.
Census & demographics
- Census place
- Hammond, LA
- County
- Tangipahoa Parish · 85,958 people
- City population
- 51,394
- Metro
- Hammond, LA
- Population (ZIP)
- 30,173
- Household income
- $50,976
- Rent vs Own
- Severe rent burden
- 1201.0
Population outlook (Tangipahoa County) Hauer SSP2
- Today (2025)
- 144,204 people
- By 2030
- 151,413 · +5.0%
- By 2040
- 164,374 · +14.0%
- By 2050
- 175,427 · +21.7%
- By 2075
- 195,165 · +35.3%
- By 2100
- 201,641 · +39.8%
Race, ethnicity, and origin ACS 2023
- Neighborhood character
- Diverse neighborhood (Simpson 0.56)
- Race & ethnicity
- White 55% Black 37% Hispanic / Latino 6% Two or more races 6%
- Hispanic origin (detail)
- Mexican 3%
- Common ancestry
- Lithuanian 9% Serbian 1% Slovak 1%
- Foreign-born
- 3% · Canada
- Languages at home
- 95% English-only · Spanish 4% Arabic 1%
Political lean MEDSL · Tangipahoa
- 2024 margin
- Solid R (+37.4) · D 30.6% · R 68.0% · Other 1.3%
- 2008→2024 swing
- -6.5pp toward R · 2008: -30.9pp · 2024: -37.4pp
- All cycles
- 2024: R+37.4 2020: R+32.8 2016: R+32.6 2012: R+27.7 2008: R+30.9
Not yet ingested
- Civics
- —
Market trends
- HPI YoY
- ▼ -66.04%
- Current HPI
- 127.4535
- Rent YoY
- ▲ 0.33%
- Metro
- Hammond, LA
- State GDP YoY
- ▲ 3.29%
- F500 in state
- 10
Industry mix (Fortune 500 HQ in LA)
| Industry | F500 HQs | Revenue |
|---|---|---|
| Telecommunications | 2 | $23B |
|
||
| Utilities | 1 | $12B |
|
||
| Wholesale / Distribution | 1 | $5B |
|
||
| Advertising | 1 | $2B |
|
||
Price history
+428.3% since first listed20 events — show timeline
- 2026-06-17 Coming Soon $140,000 AcadianaMLS
- 2022-06-15 Sold (Public Records) $120,000 Public Records
- 2022-06-15 Sold (MLS) $120,000 GSREIN
- 2022-06-14 Listed $120,000 AcadianaMLS
- 2022-06-14 Listed $120,000 GSREIN
- 2015-12-11 Sold (MLS) $35,400 GSREIN
- 2015-12-08 Pending — GSREIN
- 2015-11-13 Price Changed $39,600 GSREIN
- 2015-09-15 Listed $45,000 GSREIN
- 2015-09-14 Listed $39,600 AcadianaMLS
- 2007-04-25 Sold (Public Records) $109,900 Public Records
- 2007-04-24 Sold (MLS) $109,900 GSREIN
- 2006-11-02 Listed $111,500 AcadianaMLS
- 2006-11-02 Listed $111,500 GSREIN
- 2006-04-10 Sold (MLS) $104,000 GSREIN
- 2006-02-15 Listed $109,900 AcadianaMLS
- 2006-02-15 Listed $109,900 GSREIN
- 2004-07-01 Sold (Public Records) — Public Records
- 2002-07-17 Sold (MLS) $18,000 GSREIN
- 2000-10-10 Listed $26,500 GSREIN
Property tax history
-3.7%/yrLatest (2025): $516 · +0.5% YoY. Source: county tax records.
Cash-flow waterfall
monthlySold comps — $/sqft
last 12 mo · ≤1 miLoading sold comps…