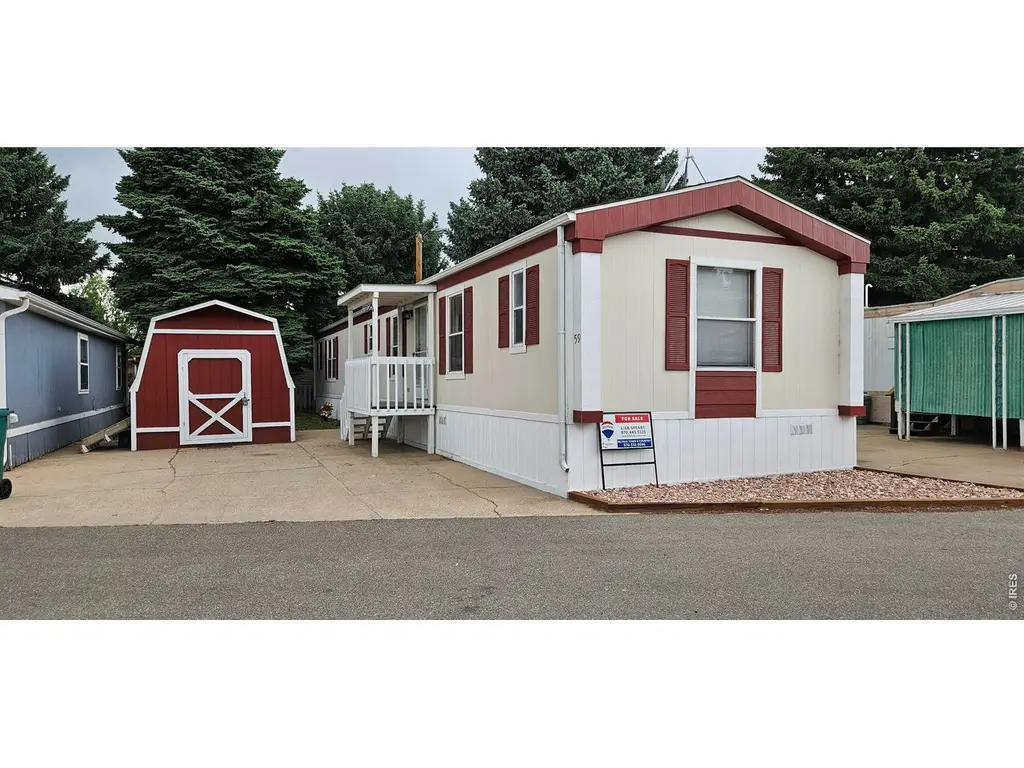
230 N 2nd St #59 · Berthoud, CO
Flood risk 1/10 · Minimal
- FEMA flood zone
- X (unshaded)
- Chance of flooding over 30 yrs
- 0.0%
- Est. flood insurance / yr
- $507 – $1,088
Fire risk 6/10 · Moderate
- Est. fire insurance / yr
- $939 – $1,743
Heat risk 3/10 · Minor
- Hot days now (above 92°F)
- 7 days/yr
- Hot days in 30 yrs
- 18 days/yr
Wind risk 1/10 · Minimal
- Chance of severe wind over 30 yrs
- —
Air-quality risk 4/10 · Minor
- Unhealthy air days now
- 6 days/yr
- Unhealthy air days in 30 yrs
- 7 days/yr
Risk factors via First Street. Map © Google.
Why this score? — see what drove the B grade
The composite is a weighted blend of 9 inputs, each scored 0–100. Each bar is that input's sub-score; the figure is the points it added to the 100-point composite (weight × sub-score).
- Cash flow +30.0/30.0
- ARV discount +13.0/15.0
- 1% rule +10.0/10.0
- DSCR +10.0/10.0
- Livability +3.5/5.0
- Schools +3.4/10.0
- Rent growth +2.5/5.0
- Condition / age +2.5/5.0
- Appreciation +0.0/10.0
$65,000
🖨 Deal sheet 📄 Offer letter ✓ Due diligence
Listing remarks MLS
Come see this well cared for home located in Blue Spruce Village in the heart of Berthoud. Short waking distance to the beautiful downtown with great restaurants, local shops and Breweries, yet close to HWY 56 if you need easy access to I-25! 3 bedroom, 2 bath with open living and kitchen with a cute little dinning space. Large primary bedroom with en-suite bathroom with oversized tub, double sinks, and stand up shower. All appliances are about 3 years old, new furnace installed in 2018 and newer roof! The rear side porch has been redone as well. The shed gives up a great space for storage with extra space above in the rafters. The home is dated, but has good bones and will make a great home! Buyers must be pre-approved by the park and complete a full credit/background check through a third-party vendor.
Key facts
- 1026.46 acre lot
- Built 2002
- Listed 69 days
Property features AI
Finance
- Financial info: Annual tax amount listed (not included per instructions)
Exterior
- Parking: No garage; No designated parking features listed
- Utilities: City water with meter installed; Natural gas available; Electricity available; No water rights
- Home design: Manufactured in park (mobile home); Built by Crestview
- Construction: Frame construction; Composition exterior; Composition roof; Under carriage: HUD
- Exterior features: Land lease; Paved lot; Asphalt road frontage on a city street; Minimal flood risk or C floodplain
Interior
- Kitchen: Gas range; Dishwasher; Refrigerator; Disposal
- Bedrooms: 3 bedrooms
- Heating & cooling: Forced air heating; Evaporative cooling
- Interior features: Eat-in kitchen; Separate dining room; Window coverings; Fire alarm
- Laundry & utility: Washer; Dryer
Neighborhood map
What this means for you Summary
Snapshot
- This is a 3-bed/2.0-bath manufactured listed at $65k.
Deal economics
- At list price, monthly cash flow is $2k ($21k/yr) — positive.
- The deal already cash-flows at list — no discount required.
- Meets the 1% rule at list price ($3k rent vs $65k).
- Recommended offer: $61k (6.0% below list) — sets the bar for market timing.
- Cap rate 38.1% vs local median 3.2% in Berthoud — top-decile yield for the area; either an underpriced asset or a hidden risk that comps aren't pricing in. Stress-test before assuming the spread holds.
Location & tenants
- Location reads 69/100 on livability (#100 in CO) — a middle-class / working-renter tenant base. Strengths: employment A+, housing A+; Watch: amenities F, cost of living F, health & safety F.
- Thompson School District R-2J (suburban): math 28% / reading 48% proficiency, ranked #28 of 86 in CO (top 33%) — families likely to look elsewhere, expect single-tenant / working-renter base with shorter leases.
- Zoned schools: Ivy Stockwell Elementary School (math 47% / reading 57%, grade C-, #174 of 966 statewide, top 20%, 402 students, 21% FRL); Berthoud High School (math 37% / reading 62%, grade D, #115 of 381 statewide, top 34%, 691 students, 15% FRL).
- Zoned-school proficiency averages 51% at this address vs 38% district-wide (+13 pts) — the actual schools serving this property are materially stronger than the Thompson School District R-2J average implies; a family-tenant draw the district grade alone would hide.
- Market conditions: 357 active listings in the ZIP; 1 comparable units currently listed for rent nearby; high-income renter base; 1,786 units permitted in Larimer County in 2024 (402 in 5+ unit buildings).
Forward outlook
- Local home prices are declining (-3.0%/yr); year-one equity from $449 of loan paydown is wiped out by about $2k of value loss. Plan a longer hold.
- Larimer County population projected at +51% by 2050 — long-run rental-demand tailwind backs the buy-and-hold thesis.
- At projected returns (-3.0% appreciation + 3.0% rent growth), your $18k cash investment doubles in ~1 year — after that, you're playing with house money.
Negotiation context
- It's been on market 69 days — a 6% lower offer ($61k) is reasonable based on typical stale-listing flexibility.
- 3 sale attempts since 3y ago; this cycle's ask has dropped $4k (6%) from the opening price — seller is motivated, your offer sets the floor, not the list.
Risks & watch-outs
- Climate carrying-cost: major wildfire risk — expect insurance premiums to compound above CPI over the hold.
Questions for the listing agent
- It's been on market 69 days. Have you received any prior offers? Is the seller open to a 6% concession, seller financing, or rate buy-down credit?
- Why hasn't it sold? Are there any deal-killer items the seller is aware of (foundation, flood, title, zoning, code violations)?
- Is there a deadline driving the sale (1031 exchange, divorce, estate, relocation)? That informs how much negotiation room exists.
- Schools are A-rated — typically a magnet for longer-tenancy family renters. What's the average tenant stay here, and is there a school-zone premium baked into asking?
- What's the average days-on-market for RENTAL listings here right now (not sales)? A rising rental-DOM trend means longer vacancies and softer asking-rent achievability than the comps imply.
- What's the recent tenant-quality profile in this submarket — average credit score on applications, eviction rate, late-payment / NSF rate, and stable-employment percentage? A property-management company in the area should have these aggregated.
- How much new for-sale + rental construction is in the pipeline within 1–3 miles? Heavy new supply typically softens prices + rents 12–24 months out; constrained supply supports both.
Investment metrics
- 1% rule
- 4.13% ✓
- Cap rate
- 38.11%
- Cash-on-cash
- 113.62%
- DSCR
- 6.06
- GRM
- 2.0
CMA / ARV
- ARV (on-the-fly)
- $73,984
- Comps found
- 9
Show comp detail 9 sales within ~0.75 mi
| Address | Dist | Beds/Ba | Sqft | Sold | Price | $/sf | Match |
|---|---|---|---|---|---|---|---|
| 230 N 2nd St #83 | 0.00mi | 3/2.0 | 1,056 (-3%) | 1mo | $55,000 | $52 | 94 |
| 230 N 2nd St #4 | 0.00mi | 2/1.5 (-1) | 1,056 (-3%) | 13mo | $49,000 | $46 | 77 |
| 230 N 2nd St N #80 | 0.00mi | 2/2.0 (-1) | 960 (-12%) | 0mo | $82,000 | $85 | 75 |
| 235 N 2nd St #17 | 0.15mi | 3/2.0 | 1,216 (+12%) | 2mo | $83,000 | $68 | 72 |
| 230 N 2nd St #7 | 0.00mi | 3/2.0 | 924 (-15%) | 6mo | $66,999 | $73 | 70 |
| 230 N 2nd St #50 | 0.00mi | 3/2.0 | 1,216 (+12%) | 12mo | $70,000 | $58 | 70 |
| 227 N 2nd St #20 | 0.09mi | 2/1.0 (-1) | 960 (-12%) | 3mo | $72,000 | $75 | 64 |
| 230 N 2nd St #9 | 0.00mi | 2/2.0 (-1) | 960 (-12%) | 18mo | $84,000 | $88 | 61 |
| 230 N 2nd St #10 | 0.00mi | 2/1.0 (-1) | 980 (-10%) | 18mo | $52,000 | $53 | 59 |
Match score weights: distance 35% · size 25% · config 20% · recency 20%. Top-matched comps best support the ARV.
Projected returns pro-forma
-3.0% appreciation · 3.0% rent growth · sell at horizon
- IRR
- —
- Equity multiple
- 6.45×
- Total profit
- $99,224
- Equity at exit
- $9,692
- IRR
- —
- Equity multiple
- 13.51×
- Total profit
- $227,754
- Equity at exit
- $5,620
Cash invested: $18,200 (down + closing). Projections, not guarantees.
Landlord ↔ Tenant lean methodology
- Overall (STATE)
- 38 Tenant-Leaning
- State Colorado
- 38 Tenant-Leaning · D+4
- County
- — inherits STATE
- City
- — inherits STATE
ZIP-level market 80513
- Active inventory
- 357
- Price-to-rent
- 2.0×
Monthly cashflow live
- Estimated rent
- $2,683 medium interval (Pro) →
- Mortgage (P&I)
- −$341
- Tax from tax record
- −$28 /mo · $337/yr
- Insurance
- −$27
- HOA
- −$0
- Vacancy / Maint / Mgmt
- −$563
- Net cashflow
- $1,723
Break-even live
UW: 25.0% down · 7.5% · 30yr · 1.5% tax · 5.0% vac · 8.0% maint · 8.0% mgmt
Financing live
Cash to close
- Down payment
- $16,250
- Closing costs
- $1,950
- Reserves months
- —
- Total cash needed
- —
Loan-product check · same deal, 3 products live
Conventional
25% down · 7.5% · 30yr
- Down + closing
- —
- Monthly P&I
- —
- Monthly cashflow
- —
- DSCR
- —
- Eligible?
- —
Personal DTI + credit; lowest rate.
DSCR
20% down · 8.5% · 30yr
- Down + closing
- —
- Monthly P&I
- —
- Monthly cashflow
- —
- DSCR
- —
- Eligible?
- —
No personal income docs; deal must DSCR.
Hard money
10% down · 12.0% · 12mo
- Down + closing
- —
- Monthly P&I
- —
- Monthly cashflow
- —
- DSCR
- —
- Eligible?
- —
Short-term bridge; refi at stabilization.
Rent comps 1 comps
| Address | Beds | Baths | Sqft | Rent | $/sqft | DOM | Units | Dist |
|---|---|---|---|---|---|---|---|---|
| 1155 Summit Vista Dr Berthoud, CO | 3.0 | 2.5 | 1377 | $2,650 | $1.92 | 13d | 1 | 0.93mi |
Listing history 24 events
-
2026-06-18days on market $65,000 Active 69 DOM
-
2026-06-17days on market $65,000 Active 68 DOM
-
2026-06-16days on market $65,000 Active 67 DOM
-
2026-06-15days on market $65,000 Active 66 DOM
-
2026-06-14days on market $65,000 Active 64 DOM
-
2026-06-13days on market $65,000 Active 63 DOM
-
2026-06-10days on market $65,000 Active 61 DOM
-
2026-06-09days on market $65,000 Active 60 DOM
-
2026-06-08days on market $65,000 Active 59 DOM
-
2026-06-07days on market $65,000 Active 58 DOM
-
2026-06-03days on market $65,000 Active 54 DOM
-
2026-06-02days on market $65,000 Active 53 DOM
-
2026-06-01days on market $65,000 Active 52 DOM
-
2026-06-01price $65,000 Active 51 DOM
-
2026-05-31days on market $69,000 Active 51 DOM
-
2026-05-30days on market $69,000 Active 50 DOM
-
2026-04-10$69,000 Active
-
2026-03-16historical
-
2026-03-04price $69,900
-
2026-01-29price $74,500
-
2026-01-09$79,000 Active
-
2023-08-30soldstatus $60,000 Sold 815-char remark
Show marketing remark (815 chars)
Come see this well cared for home located in Blue Spruce Village in the heart of Berthoud. Short waking distance to the beautiful downtown with great restaurants, local shops and Breweries, yet close to HWY 56 if you need easy access to I-25! 3 bedroom, 2 bath with open living and kitchen with a cute little dinning space. Large primary bedroom with en-suite bathroom with oversized tub, double sinks, and stand up shower. All appliances are about 3 years old, new furnace installed in 2018 and newer roof! The rear side porch has been redone as well. The shed gives up a great space for storage with extra space above in the rafters. The home is dated, but has good bones and will make a great home! Buyers must be pre-approved by the park and complete a full credit/background check through a third-party vendor.
-
2023-08-05historical Active - Backup 815-char remark
Show marketing remark (815 chars)
Come see this well cared for home located in Blue Spruce Village in the heart of Berthoud. Short waking distance to the beautiful downtown with great restaurants, local shops and Breweries, yet close to HWY 56 if you need easy access to I-25! 3 bedroom, 2 bath with open living and kitchen with a cute little dinning space. Large primary bedroom with en-suite bathroom with oversized tub, double sinks, and stand up shower. All appliances are about 3 years old, new furnace installed in 2018 and newer roof! The rear side porch has been redone as well. The shed gives up a great space for storage with extra space above in the rafters. The home is dated, but has good bones and will make a great home! Buyers must be pre-approved by the park and complete a full credit/background check through a third-party vendor.
-
2023-08-01$60,000 Active 815-char remark
Show marketing remark (815 chars)
Come see this well cared for home located in Blue Spruce Village in the heart of Berthoud. Short waking distance to the beautiful downtown with great restaurants, local shops and Breweries, yet close to HWY 56 if you need easy access to I-25! 3 bedroom, 2 bath with open living and kitchen with a cute little dinning space. Large primary bedroom with en-suite bathroom with oversized tub, double sinks, and stand up shower. All appliances are about 3 years old, new furnace installed in 2018 and newer roof! The rear side porch has been redone as well. The shed gives up a great space for storage with extra space above in the rafters. The home is dated, but has good bones and will make a great home! Buyers must be pre-approved by the park and complete a full credit/background check through a third-party vendor.
ⓘ Source: listings_history table (triggers on properties + properties_extension) + one-shot
backfill from property_details.listing_events for pre-trigger history.
Tax reassessment forecast CO · Resets to sale price
- Current annual tax
- $337 · $28/mo
- Projected year-2 tax
- $358 · $30/mo
- Expected delta
- +$20/yr (+$2/mo · 6.1%)
ⓘ Screening estimate from a state-policy table — verify with the county assessor before closing.
Climate risk First Street
- Flood 1/10 Low FEMA zone X (unshaded) · 0% chance over 30 yrs
- Wildfire 6/10 Major
- Heat 3/10 Moderate 7 d/yr ≥92°F today · 18 d/yr by 30 yrs out
- Wind 1/10 Low
- Air quality 4/10 Moderate 6 unhealthy d/yr today · 7 by 30 yrs out
Nearby sold comps map
Loading sold comps map…
Walkable amenities ~0.75 mi
Loading nearby amenities…
Taxation est. · year 1
- Rental income
- $32,190
- − Mortgage interest
- −$3,641
- − Property taxes
- −$337
- − Insurance
- −$325
- − Repairs & maintenance
- −$2,575
- − Management
- −$2,575
- − Depreciation
- −$1,891
- Taxable income
- $20,846
- Est. tax owed @ 24.0%
- −$5,003
- After-tax cash flow
- $15,675/yr
For passive investors: Depreciation is non-cash, so a rental often shows a tax loss while cash-flowing — sheltering income. Rental losses are passive: they offset passive income freely, and up to $25,000/yr can offset ordinary (W-2) income if you actively participate and your MAGI is under $100k (phasing out to $0 by $150k); unused losses carry forward. On sale, claimed depreciation is recaptured at up to 25%, and gains may owe capital-gains tax (a 1031 exchange can defer both). Figures are a year-1 estimate at your 24.0% rate — not tax advice; consult a CPA.
Schools (NCES district)
- District
- Thompson School District R-2J
- NCES district ID
- 0805400
- Math proficiency
- 28% ▼ -7.00%
- Reading proficiency
- 48% ▬ 0.00%
- Median HH income
- $63,040
- Composite
- 34.01/100
- National rank
- #5313
- State rank
- #28 of 86 in CO
Livability — Berthoud
- Score
- 69/100
- State rank
- #100
- US rank
- #8538
Category grades
Schools grade is shown separately in the Schools card above.
Census & demographics
- Census place
- Berthoud, CO
- County
- Larimer County · 338,255 people
- City population
- 18,271
- Metro
- Fort Collins, CO
- Population (ZIP)
- 18,271
- Household income
- $126,726
- Rent vs Own
- Severe rent burden
- 55.0
Population outlook (Larimer County) Hauer SSP2
- Today (2025)
- 415,361 people
- By 2030
- 457,762 · +10.2%
- By 2040
- 542,310 · +30.6%
- By 2050
- 627,048 · +51.0%
- By 2075
- 833,722 · +100.7%
- By 2100
- 952,590 · +129.3%
Race, ethnicity, and origin ACS 2023
- Neighborhood character
- Predominantly White (86%)
- Race & ethnicity
- White 86% Hispanic / Latino 10% Two or more races 6%
- Hispanic origin (detail)
- Mexican 6% Puerto Rican 1%
- Common ancestry
- Slovak 6% Romanian 4% Lithuanian 4%
- Foreign-born
- 4% · Canada, China, Vietnam
- Languages at home
- 95% English-only · Spanish 4% Other Indo-European 1%
Political lean MEDSL · Larimer
- 2024 margin
- D (+17.6) · D 57.4% · R 39.8% · Other 2.9%
- 2008→2024 swing
- +7.9pp toward D · 2008: 9.7pp · 2024: 17.6pp
- All cycles
- 2024: D+17.6 2020: D+15.4 2016: D+4.9 2012: D+5.2 2008: D+9.7
Not yet ingested
- Civics
- —
Market trends
- HPI YoY
- ▼ -411.30%
- Current HPI
- 260.0027
- Rent YoY
- —
- Metro
- Fort Collins, CO
- State GDP YoY
- ▲ 1.95%
- F500 in state
- 14
Industry mix (Fortune 500 HQ in CO)
| Industry | F500 HQs | Revenue |
|---|---|---|
| Technology Distribution | 1 | $31B |
|
||
| Food / Agriculture | 1 | $18B |
|
||
| Packaging | 1 | $14B |
|
||
| Healthcare | 1 | $13B |
|
||
| Energy | 1 | $10B |
|
||
| Technology | 1 | $4B |
|
||
Price history
+15.0% since first listed8 events — show timeline
- 2026-04-10 Listed $69,000 IRES
- 2026-03-16 Listing Removed — IRES
- 2026-03-04 Price Changed $69,900 IRES
- 2026-01-29 Price Changed $74,500 IRES
- 2026-01-09 Listed $79,000 IRES
- 2023-08-30 Sold (MLS) $60,000 IRES
- 2023-08-05 Contingent — IRES
- 2023-08-01 Listed $60,000 IRES
Property tax history
+3.4%/yrLatest (2025): $337 · +250.5% YoY. Source: county tax records.
Cash-flow waterfall
monthlySold comps — $/sqft
last 12 mo · ≤1 miLoading sold comps…