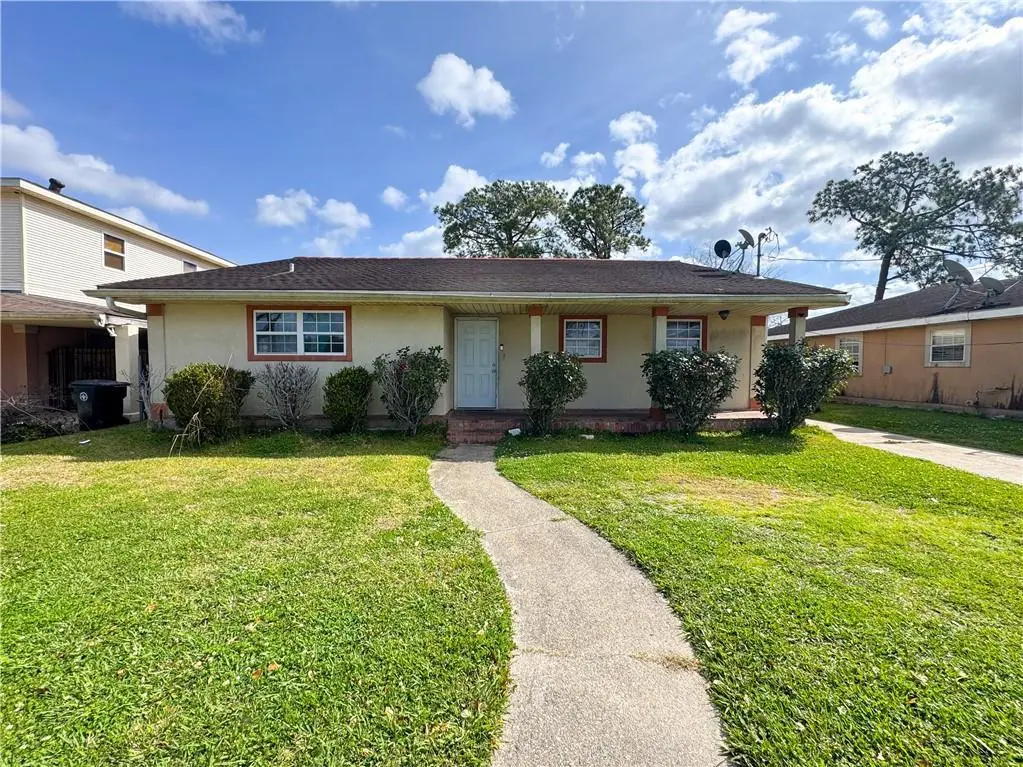
6611 E Hermes St · New Orleans, LA
Flood risk 9/10 · Severe
- FEMA flood zone
- X (shaded)
- Chance of flooding over 30 yrs
- 0.76%
- Est. flood insurance / yr
- $507 – $1,088
Fire risk 1/10 · Minimal
- Est. fire insurance / yr
- $1,269 – $2,357
Heat risk 10/10 · Severe
- Hot days now (above 107°F)
- 7 days/yr
- Hot days in 30 yrs
- 21 days/yr
Wind risk 10/10 · Severe
- Chance of severe wind over 30 yrs
- 99.0%
Air-quality risk 3/10 · Minor
- Unhealthy air days now
- 3 days/yr
- Unhealthy air days in 30 yrs
- 3 days/yr
Risk factors via First Street. Map © Google.
Why this score? — see what drove the C grade
The composite is a weighted blend of 9 inputs, each scored 0–100. Each bar is that input's sub-score; the figure is the points it added to the 100-point composite (weight × sub-score).
- Cash flow +22.5/30.0
- ARV discount +11.9/15.0
- DSCR +7.2/10.0
- 1% rule +5.3/10.0
- Livability +4.0/5.0
- Condition / age +2.5/5.0
- Rent growth +2.4/5.0
- Schools +1.6/10.0
- Appreciation +0.0/10.0
$175,000
🖨 Deal sheet 📄 Offer letter ✓ Due diligence
Listing remarks MLS
Well-maintained 3-bedroom, 2-bath single-family home offering strong appeal for both owner-occupants and investors. It features no carpet throughout for easy maintenance, a large pantry providing excellent storage, and comfortably sized bedrooms. Situated on a spacious fenced lot with a large yard and long driveway for ample off-street parking. Property is currently tenant-occupied with a Section 8 tenant producing reliable rental income, making this a solid turnkey investment opportunity. Also well-suited as a starter home for future owner occupancy.
Key facts
- No carpet
- Large yard
- Large pantry
Tags
Neighborhood map
What this means for you Summary
Snapshot
- This is a 3-bed/2.0-bath single-family listed at $175k.
Deal economics
- At list price, monthly cash flow is $229 ($3k/yr) — positive.
- The deal already cash-flows at list — no discount required.
- Meets the 1% rule at list price ($2k rent vs $175k).
- Recommended offer: $159k (9.0% below list) — sets the bar for market timing.
- Cap rate 8.3% vs local median 4.4% in New Orleans — top-decile yield for the area; either an underpriced asset or a hidden risk that comps aren't pricing in. Stress-test before assuming the spread holds.
Location & tenants
- Location reads 81/100 on livability (#3 in LA, #1,383 nationally) — a professional / high-income tenant draw. Strengths: amenities A+, commute A+, health & safety A+; Watch: crime C-, employment D.
- Orleans Parish (urban): math 11% / reading 27% proficiency, ranked #69 of 98 in LA (top 70%) — low school quality limits family demand, transient renter base, plan for 1-2y turnover; 68% free/reduced lunch — lower-income household profile, screen leases tightly.
- Market conditions: Rents soft (-0.2%/yr); 224 active listings in the ZIP; 17 comparable units currently listed for rent nearby; rentals at typical pace (median 24d on market — plan ~3-4 weeks tenant-placement turnaround); lower-income renter base — watch delinquency; 710 units permitted in Orleans Parish in 2024 (244 in 5+ unit buildings).
- At $1,803/mo this rent would consume 52% of the median local household income ($42k/yr) (locally 1767% of renters already pay >50% of income on rent) — very limited rent-growth headroom before tenants either downsize or default.
Forward outlook
- Local home prices are declining (-3.0%/yr); year-one equity from $1k of loan paydown is wiped out by about $5k of value loss. Plan a longer hold.
- Orleans County population projected at +61% by 2050 — long-run rental-demand tailwind backs the buy-and-hold thesis.
Negotiation context
- It's been on market 111 days — a 9% lower offer ($159k) is reasonable based on typical stale-listing flexibility.
- 8 sale attempts since 16y ago with the ask held roughly flat each time — persistent listings suggest the price (not the market) is what's stuck; bring a comps-based counter.
- Current owner paid $48k; list at $175k implies a 261% gain — meaningful room to come down on a strong offer.
Risks & watch-outs
- Watch-outs: flood insurance adds $66/mo.
- Climate carrying-cost: severe flood risk; severe wind risk, 99% chance of damaging wind over 30y; extreme-heat days projected 7→21/yr by 2055 (HVAC capex compounding) — expect insurance premiums to compound above CPI over the hold.
Questions for the listing agent
- It's been on market 111 days. Have you received any prior offers? Is the seller open to a 9% concession, seller financing, or rate buy-down credit?
- Built in 1970 — when were the roof, HVAC, electrical panel, plumbing, and water heater last replaced?
- What's the actual annual flood-insurance premium (NFIP or private), and is the property in a SFHA with mandatory coverage?
- Why hasn't it sold? Are there any deal-killer items the seller is aware of (foundation, flood, title, zoning, code violations)?
- Is there a deadline driving the sale (1031 exchange, divorce, estate, relocation)? That informs how much negotiation room exists.
- What's the average days-on-market for RENTAL listings here right now (not sales)? A rising rental-DOM trend means longer vacancies and softer asking-rent achievability than the comps imply.
- What's the recent tenant-quality profile in this submarket — average credit score on applications, eviction rate, late-payment / NSF rate, and stable-employment percentage? A property-management company in the area should have these aggregated.
- How much new for-sale + rental construction is in the pipeline within 1–3 miles? Heavy new supply typically softens prices + rents 12–24 months out; constrained supply supports both.
Investment metrics
- 1% rule
- 1.03% ✓
- Cap rate
- 8.32%
- Cash-on-cash
- 7.23%
- DSCR
- 1.32
- GRM
- 8.1
CMA / ARV
- ARV (on-the-fly)
- $193,968
- Comps found
- 12
Show comp detail 12 sales within ~0.75 mi
| Address | Dist | Beds/Ba | Sqft | Sold | Price | $/sf | Match |
|---|---|---|---|---|---|---|---|
| 6721 Dorchester Dr | 0.65mi | 3/2.0 | 1,800 (+0%) | 2mo | $209,000 | $116 | 68 |
| 4942 Virgilian St | 0.22mi | 3/2.0 | 2,010 (+12%) | 12mo | $65,000 | $32 | 60 |
| 6775 Deanne St | 0.37mi | 3/2.0 | 1,660 (-8%) | 13mo | $65,000 | $39 | 59 |
| 6651 Foch St | 0.19mi | 4/2.0 (+1) | 1,635 (-9%) | 18mo | $172,000 | $105 | 56 |
| 6953 E Laverne St | 0.23mi | 2/1.0 (-1) | 1,560 (-13%) | 4mo | $87,000 | $56 | 55 |
| 4741 Lafon Dr | 0.70mi | 3/2.0 | 1,838 (+2%) | 12mo | $199,000 | $108 | 54 |
| 4414 Ray Ave | 0.65mi | 3/2.0 | 1,612 (-10%) | 2mo | $133,000 | $83 | 51 |
| 7180 W Laverne St | 0.43mi | 3/2.0 | 1,540 (-14%) | 10mo | $260,000 | $169 | 48 |
| 7530 Newcastle St | 0.65mi | 3/2.0 | 1,922 (+7%) | 13mo | $115,000 | $60 | 47 |
| 6701 Morrison Rd | 0.52mi | 3/3.0 | 2,000 (+11%) | 8mo | $255,000 | $128 | 46 |
| 4800 Camelia St | 0.72mi | 3/2.0 | 1,580 (-12%) | 3mo | $180,000 | $114 | 44 |
| 7400 Newcastle St | 0.56mi | 4/3.0 (+1) | 2,009 (+12%) | 12mo | $235,500 | $117 | 35 |
Match score weights: distance 35% · size 25% · config 20% · recency 20%. Top-matched comps best support the ARV.
Projected returns pro-forma
-3.0% appreciation · 0.0% rent growth · sell at horizon
- IRR
- -11.0%
- Equity multiple
- 0.61×
- Total profit
- $-19,065
- Equity at exit
- $26,093
- IRR
- -6.7%
- Equity multiple
- 0.63×
- Total profit
- $-18,200
- Equity at exit
- $15,131
Cash invested: $49,000 (down + closing). Projections, not guarantees.
Landlord ↔ Tenant lean methodology
- Overall (STATE)
- 90 Strongly Landlord-Friendly
- State Louisiana
- 90 Strongly Landlord-Friendly · R+12
- County
- — inherits STATE
- City
- — inherits STATE
ZIP-level market 70126
- Home prices YoY
- -17.0%
- Rents YoY
- -0.2%
- Active inventory
- 224
- Price-to-rent
- 8.1×
Monthly cashflow live
- Estimated rent
- $1,803 high interval (Pro) →
- Mortgage (P&I)
- −$918
- Tax from tax record
- −$139 /mo · $1,666/yr
- Insurance
- −$73
- Flood insurance flood zone
- −$66 /mo · $798/yr
- HOA
- −$0
- Vacancy / Maint / Mgmt
- −$379
- Net cashflow
- $229
Break-even live
UW: 25.0% down · 7.5% · 30yr · 1.5% tax · 5.0% vac · 8.0% maint · 8.0% mgmt
Financing live
Cash to close
- Down payment
- $43,750
- Closing costs
- $5,250
- Reserves months
- —
- Total cash needed
- —
Loan-product check · same deal, 3 products live
Conventional
25% down · 7.5% · 30yr
- Down + closing
- —
- Monthly P&I
- —
- Monthly cashflow
- —
- DSCR
- —
- Eligible?
- —
Personal DTI + credit; lowest rate.
DSCR
20% down · 8.5% · 30yr
- Down + closing
- —
- Monthly P&I
- —
- Monthly cashflow
- —
- DSCR
- —
- Eligible?
- —
No personal income docs; deal must DSCR.
Hard money
10% down · 12.0% · 12mo
- Down + closing
- —
- Monthly P&I
- —
- Monthly cashflow
- —
- DSCR
- —
- Eligible?
- —
Short-term bridge; refi at stabilization.
Rent comps 17 comps
| Address | Beds | Baths | Sqft | Rent | $/sqft | DOM | Units | Dist |
|---|---|---|---|---|---|---|---|---|
| 6628 Harbourview Dr New Orleans, LA | 3.0 | 2.5 | 1520 | $1,700 | $1.12 | 3d | 1 | 0.22mi |
| 4819 21 Francis Dr New Orleans, LA | 3.0 | 1.0 | 1272 | $1,880 | $1.48 | 3d | 1 | 0.22mi |
| 4745 Francis Dr New Orleans, LA | 3.0 | 2.0 | 1311 | $1,550 | $1.18 | 15d | 1 | 0.28mi |
| 4522 Shalimar Dr New Orleans, LA | 3.0 | 2.0 | 1350 | $1,850 | $1.37 | 23d | 1 | 0.55mi |
| 5920 Boeing St New Orleans, LA | 3.0 | 1.5 | 1340 | $1,400 | $1.04 | 23d | 1 | 0.62mi |
| 7530 Newcastle St New Orleans, LA | 3.0 | 2.0 | 1913 | $1,800 | $0.94 | 23d | 1 | 0.65mi |
| 4409 Skyview Dr New Orleans, LA | 4.0 | 2.5 | 1560 | $1,700 | $1.09 | 15d | 1 | 0.66mi |
| 4441 Cessna Ct New Orleans, LA | 3.0 | 1.5 | 1400 | $1,600 | $1.14 | 23d | 1 | 0.66mi |
| 7404 Sussex Pl New Orleans, LA | 2.0 | 1.5 | 1400 | $1,450 | $1.04 | 2d | 1 | 0.74mi |
| 7611 Mayfair Pl New Orleans, LA | 2.0 | 1.5 | 1440 | $1,450 | $1.01 | 3d | 1 | 0.80mi |
| 5704 Count Ln New Orleans, LA | 3.0 | 1.5 | 1572 | $1,700 | $1.08 | 23d | 1 | 0.84mi |
| 5611 Rickert Dr New Orleans, LA | 3.0 | 2.5 | 2155 | $2,900 | $1.35 | 43d | 1 | 0.98mi |
| 5747 Pauline Dr New Orleans, LA | 3.0 | 1.0 | 1300 | $1,400 | $1.08 | 11d | 1 | 1.18mi |
| 5925 Pauline Dr New Orleans, LA | 3.0 | 2.0 | 1566 | $2,325 | $1.48 | 15d | 1 | 1.21mi |
| 4828 Eastview Dr New Orleans, LA | 4.0 | 2.0 | 1260 | $1,675 | $1.33 | 23d | 1 | 1.31mi |
| 4722 Mithra St New Orleans, LA | 3.0 | 1.5 | 1295 | $1,600 | $1.24 | 23d | 1 | 1.36mi |
| 7608 Laine Ave New Orleans, LA | 3.0 | 2.5 | 2060 | $1,950 | $0.95 | 23d | 1 | 1.44mi |
Listing history 25 events
-
2026-06-18days on market $175,000 Active 111 DOM
-
2026-06-17days on market $175,000 Active 110 DOM
-
2026-06-16days on market $175,000 Active 109 DOM
-
2026-06-15days on market $175,000 Active 108 DOM
-
2026-06-13days on market $175,000 Active 106 DOM
-
2026-06-10days on market $175,000 Active 103 DOM
-
2026-06-09days on market $175,000 Active 102 DOM
-
2026-06-08days on market $175,000 Active 101 DOM
-
2026-06-07days on market $175,000 Active 100 DOM
-
2026-06-05days on market $175,000 Active 97 DOM
-
2026-06-03days on market $175,000 Active 96 DOM
-
2026-06-02days on market $175,000 Active 95 DOM
-
2026-06-01days on market $175,000 Active 94 DOM
-
2026-05-31days on market $175,000 Active 93 DOM
-
2026-02-27$175,000 Active 557-char remark
Show marketing remark (558 chars)
Well-maintained 3-bedroom, 2-bath single-family home offering strong appeal for both owner-occupants and investors. It features no carpet throughout for easy maintenance, a large pantry providing excellent storage, and comfortably sized bedrooms. Situated on a spacious fenced lot with a large yard and long driveway for ample off-street parking. Property is currently tenant-occupied with a Section 8 tenant producing reliable rental income, making this a solid turnkey investment opportunity. Also well-suited as a starter home for future owner occupancy.
-
2026-02-27$175,000 Active 558-char remark
Show marketing remark (558 chars)
Well-maintained 3-bedroom, 2-bath single-family home offering strong appeal for both owner-occupants and investors. It features no carpet throughout for easy maintenance, a large pantry providing excellent storage, and comfortably sized bedrooms. Situated on a spacious fenced lot with a large yard and long driveway for ample off-street parking. Property is currently tenant-occupied with a Section 8 tenant producing reliable rental income, making this a solid turnkey investment opportunity. Also well-suited as a starter home for future owner occupancy.
-
2013-03-01soldstatus $48,500
-
2013-01-14$53,410
-
2013-01-14$53,410
-
2012-08-10$58,410
-
2012-08-10$58,410
-
2011-03-18soldstatus $115,000
-
2010-07-09$132,000
-
2010-07-09$132,000
-
1980-10-31soldstatus $55,000
ⓘ Source: listings_history table (triggers on properties + properties_extension) + one-shot
backfill from property_details.listing_events for pre-trigger history.
Tax reassessment forecast LA · Resets to sale price
- Current annual tax
- $1,666 · $139/mo
- Projected year-2 tax
- $1,666 · $139/mo
- Expected delta
- $0/yr ($0/mo · 0.0%)
ⓘ Screening estimate from a state-policy table — verify with the county assessor before closing.
Climate risk First Street
- Flood 9/10 Extreme FEMA zone X (shaded) · 76% chance over 30 yrs
- Wildfire 1/10 Low
- Heat 10/10 Extreme 7 d/yr ≥107°F today · 21 d/yr by 30 yrs out
- Wind 10/10 Extreme 99% chance of damaging wind over 30 yrs
- Air quality 3/10 Moderate 3 unhealthy d/yr today · 3 by 30 yrs out
Nearby sold comps map
Loading sold comps map…
Walkable amenities ~0.75 mi
Loading nearby amenities…
Taxation est. · year 1
- Rental income
- $21,638
- − Mortgage interest
- −$9,803
- − Property taxes
- −$1,666
- − Insurance
- −$1,672
- − Repairs & maintenance
- −$1,731
- − Management
- −$1,731
- − Depreciation
- −$5,091
- Taxable loss
- −$56
- Est. tax savings @ 24.0%
- +$13
- After-tax cash flow
- $2,756/yr
For passive investors: Depreciation is non-cash, so a rental often shows a tax loss while cash-flowing — sheltering income. Rental losses are passive: they offset passive income freely, and up to $25,000/yr can offset ordinary (W-2) income if you actively participate and your MAGI is under $100k (phasing out to $0 by $150k); unused losses carry forward. On sale, claimed depreciation is recaptured at up to 25%, and gains may owe capital-gains tax (a 1031 exchange can defer both). Figures are a year-1 estimate at your 24.0% rate — not tax advice; consult a CPA.
Schools (NCES district)
- District
- Orleans Parish
- NCES district ID
- 2201170
- Math proficiency
- 11% ▼ -52.00%
- Reading proficiency
- 27% ▼ -46.00%
- Median HH income
- $37,011
- Composite
- 15.78/100
- National rank
- #9271
- State rank
- #69 of 98 in LA
Livability — New Orleans
- Score
- 81/100
- State rank
- #3
- US rank
- #1383
Category grades
Schools grade is shown separately in the Schools card above.
Census & demographics
- Census place
- New Orleans, LA
- County
- Orleans Parish · 338,817 people
- City population
- 338,817
- Metro
- New Orleans-Metairie, LA
- Population (ZIP)
- 27,047
- Household income
- $41,709
- Rent vs Own
- Severe rent burden
- 1767.0
Population outlook (Orleans County) Hauer SSP2
- Today (2025)
- 513,025 people
- By 2030
- 575,781 · +12.2%
- By 2040
- 700,174 · +36.5%
- By 2050
- 826,541 · +61.1%
- By 2075
- 1,123,374 · +119.0%
- By 2100
- 1,355,609 · +164.2%
Race, ethnicity, and origin ACS 2023
- Neighborhood character
- Predominantly Black (85%)
- Race & ethnicity
- Black 85% Hispanic / Latino 6% Two or more races 5% White 5%
- Hispanic origin (detail)
- Common ancestry
- Lithuanian 1% Italian 1%
- Foreign-born
- 4% · Canada, Vietnam
- Languages at home
- 94% English-only · Spanish 5% Other Indo-European 1%
Political lean MEDSL · Orleans
- 2024 margin
- Solid D (+67.0) · D 82.2% · R 15.2% · Other 2.7%
- 2008→2024 swing
- +6.7pp toward D · 2008: 60.3pp · 2024: 67.0pp
- All cycles
- 2024: D+67.0 2020: D+68.2 2016: D+66.2 2012: D+62.5 2008: D+60.3
Not yet ingested
- Civics
- —
Market trends
- HPI YoY
- ▼ -36.35%
- Current HPI
- 177.355
- Rent YoY
- ▼ -0.24%
- Metro
- New Orleans-Metairie, LA
- State GDP YoY
- ▲ 3.29%
- F500 in state
- 10
Industry mix (Fortune 500 HQ in LA)
| Industry | F500 HQs | Revenue |
|---|---|---|
| Telecommunications | 2 | $23B |
|
||
| Utilities | 1 | $12B |
|
||
| Wholesale / Distribution | 1 | $5B |
|
||
| Advertising | 1 | $2B |
|
||
Price history
+218.2% since first listed11 events — show timeline
- 2026-02-27 Listed $175,000 GSREIN
- 2026-02-27 Listed $175,000 AcadianaMLS
- 2013-03-01 Sold (MLS) $48,500 GSREIN
- 2013-01-14 Listed $53,410 AcadianaMLS
- 2013-01-14 Listed $53,410 GSREIN
- 2012-08-10 Listed $58,410 GSREIN
- 2012-08-10 Listed $58,410 AcadianaMLS
- 2011-03-18 Sold (Public Records) $115,000 Public Records
- 2010-07-09 Listed $132,000 GSREIN
- 2010-07-09 Listed $132,000 AcadianaMLS
- 1980-10-31 Sold (Public Records) $55,000 Public Records
Property tax history
-0.4%/yrLatest (2026): $1,666 · +1.1% YoY. Source: county tax records.
Cash-flow waterfall
monthlySold comps — $/sqft
last 12 mo · ≤1 miLoading sold comps…