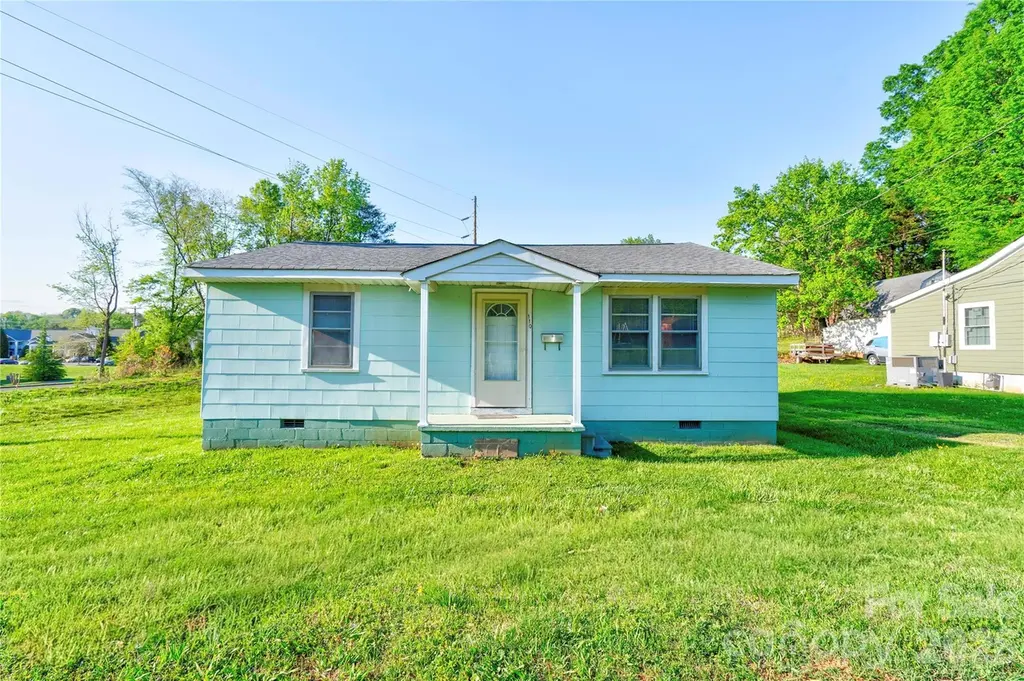
110 Owens St · Kings Mountain, NC
Flood risk 1/10 · Minimal
- FEMA flood zone
- X (unshaded)
- Chance of flooding over 30 yrs
- 0.0%
- Est. flood insurance / yr
- $507 – $1,088
Fire risk 3/10 · Minor
- Est. fire insurance / yr
- $906 – $1,684
Heat risk 6/10 · Moderate
- Hot days now (above 103°F)
- 7 days/yr
- Hot days in 30 yrs
- 17 days/yr
Wind risk 4/10 · Minor
- Chance of severe wind over 30 yrs
- 9.0%
Air-quality risk 3/10 · Minor
- Unhealthy air days now
- 3 days/yr
- Unhealthy air days in 30 yrs
- 3 days/yr
Risk factors via First Street. Map © Google.
Why this score? — see what drove the D grade
The composite is a weighted blend of 9 inputs, each scored 0–100. Each bar is that input's sub-score; the figure is the points it added to the 100-point composite (weight × sub-score).
- Cash flow +21.2/30.0
- DSCR +6.7/10.0
- 1% rule +4.6/10.0
- Schools +4.0/10.0
- Livability +3.2/5.0
- Rent growth +2.5/5.0
- Condition / age +2.5/5.0
- ARV discount +0.0/15.0
- Appreciation +0.0/10.0
$140,000
🖨 Deal sheet 📄 Offer letter ✓ Due diligence
Listing remarks
Welcome to 110 Owens Street in Kings Mountain. This is a two bedroom home and has had some recent updating. Roof in 2022 and new bath except for tub and kitchen counters in 2025. Seller say Gas Pack was installed in 2011. So many ways to add and dress up the charm of this home. .
Key facts
- New bath
- Roof in 2022
- Gas pack installed
Tags
Property features AI
Finance
- HOA & community: No HOA
Exterior
- Parking: Driveway
- Utilities: City water; Public sewer
- Home design: Single-family residential home; One story (entry level: main); Zoning: SU
- Construction: Site-built construction; Construction materials: Other (see remarks); Crawl space foundation; Built on one level
- Exterior features: Road access includes both dirt and paved surfaces; Publicly maintained road
Interior
- Kitchen: No appliances listed
- Bedrooms: 2 bedrooms on the main level
- Bathrooms: 1 full bathroom on the main level
- Heating & cooling: Forced air heating; Central air conditioning
- Interior features: Five total rooms
- Laundry & utility: Laundry located on the porch
Neighborhood map
What this means for you Summary
Snapshot
- This is a 2-bed/1.0-bath single-family listed at $140k.
Deal economics
- At list price, monthly cash flow is $202 ($2k/yr) — positive.
- The deal already cash-flows at list — no discount required.
- To meet the 1% rule (rent ≥ 1% of price), the offer needs to be $135k (3.9% below list).
- Recommended offer: $132k (6.0% below list) — sets the bar for market timing.
- Cap rate 8.0% vs local median 3.4% in Kings Mountain — top-decile yield for the area; either an underpriced asset or a hidden risk that comps aren't pricing in. Stress-test before assuming the spread holds.
Location & tenants
- Location reads 63/100 on livability (#404 in NC) — a middle-class / working-renter tenant base. Strengths: cost of living A+, housing A+; Watch: schools D, crime F, amenities F.
- Cleveland County Schools (rural): math 47% / reading 49% proficiency, ranked #76 of 178 in NC (top 43%) — families likely to look elsewhere, expect single-tenant / working-renter base with shorter leases.
- Market conditions: 194 active listings in the ZIP; 7 comparable units currently listed for rent nearby; rentals leasing fast (median 11d on market — plan ~1-2 weeks tenant-placement turnaround); 461 units permitted in Cleveland County in 2024 (38 in 5+ unit buildings).
Forward outlook
- Local home prices are declining (-3.0%/yr); year-one equity from $968 of loan paydown is wiped out by about $4k of value loss. Plan a longer hold.
- Cleveland County population projected at -15% by 2050 — secular population decline; favor cash flow + early exit over multi-decade hold.
Negotiation context
- It's been on market 77 days — a 6% lower offer ($132k) is reasonable based on typical stale-listing flexibility.
Risks & watch-outs
- Watch-outs: built in 1956 — expect roof / HVAC / electrical / plumbing capex.
- Climate carrying-cost: extreme-heat days projected 7→17/yr by 2055 (HVAC capex compounding) — expect insurance premiums to compound above CPI over the hold.
Questions for the listing agent
- It's been on market 77 days. Have you received any prior offers? Is the seller open to a 6% concession, seller financing, or rate buy-down credit?
- Built in 1956 — when were the roof, HVAC, electrical panel, plumbing, and water heater last replaced?
- Why hasn't it sold? Are there any deal-killer items the seller is aware of (foundation, flood, title, zoning, code violations)?
- Is there a deadline driving the sale (1031 exchange, divorce, estate, relocation)? That informs how much negotiation room exists.
- Schools are D-rated, which usually means shorter tenancies and higher turnover. Who's the typical renter profile here, and what's been the actual vacancy rate?
- Crime grade is F in this area — have there been break-ins, vandalism, or insurance claims at this property in the last 3 years? What carrier currently insures it and at what premium?
- The area grade is low — what's the realistic commute time and amenity access for the typical tenant pool here? Any planned neighborhood developments (good or bad) we should know about?
- What's the average days-on-market for RENTAL listings here right now (not sales)? A rising rental-DOM trend means longer vacancies and softer asking-rent achievability than the comps imply.
- What's the recent tenant-quality profile in this submarket — average credit score on applications, eviction rate, late-payment / NSF rate, and stable-employment percentage? A property-management company in the area should have these aggregated.
- How much new for-sale + rental construction is in the pipeline within 1–3 miles? Heavy new supply typically softens prices + rents 12–24 months out; constrained supply supports both.
Investment metrics
- 1% rule
- 0.96% ✗
- Cap rate
- 8.02%
- Cash-on-cash
- 6.17%
- DSCR
- 1.27
- GRM
- 8.7
CMA / ARV
- ARV (on-the-fly)
- $106,964
- Comps found
- 5
Show comp detail 5 sales within ~0.75 mi
| Address | Dist | Beds/Ba | Sqft | Sold | Price | $/sf | Match |
|---|---|---|---|---|---|---|---|
| 606 Mauney Ave | 0.12mi | 2/1.0 | 905 (+2%) | 9mo | $219,900 | $243 | 83 |
| 111 S Deal St | 0.24mi | 3/1.0 (+1) | 936 (+6%) | 10mo | $70,000 | $75 | 66 |
| 308 Carpenter St | 0.67mi | 2/1.0 | 960 (+9%) | 5mo | $172,000 | $179 | 50 |
| 412 E Ridge St | 0.45mi | 2/1.0 | 788 (-11%) | 20mo | $95,000 | $121 | 44 |
| 403 Branch St | 0.73mi | 3/1.0 (+1) | 1,008 (+14%) | 13mo | $120,000 | $119 | 27 |
Match score weights: distance 35% · size 25% · config 20% · recency 20%. Top-matched comps best support the ARV.
Projected returns pro-forma
-3.0% appreciation · 3.0% rent growth · sell at horizon
- IRR
- -6.8%
- Equity multiple
- 0.75×
- Total profit
- $-9,885
- Equity at exit
- $20,874
- IRR
- 2.8%
- Equity multiple
- 1.20×
- Total profit
- $7,750
- Equity at exit
- $12,105
Cash invested: $39,200 (down + closing). Projections, not guarantees.
Landlord ↔ Tenant lean methodology
- Overall (STATE)
- 85 Strongly Landlord-Friendly
- State North Carolina
- 85 Strongly Landlord-Friendly · R+3
- County
- — inherits STATE
- City
- — inherits STATE
ZIP-level market 28086
- Home prices YoY
- -28.6%
- Active inventory
- 194
- Price-to-rent
- 8.7×
Monthly cashflow live
- Estimated rent
- $1,345 high interval (Pro) →
- Mortgage (P&I)
- −$734
- Tax from tax record
- −$68 /mo · $822/yr
- Insurance
- −$58
- HOA
- −$0
- Vacancy / Maint / Mgmt
- −$282
- Net cashflow
- $202
Break-even live
UW: 25.0% down · 7.5% · 30yr · 1.5% tax · 5.0% vac · 8.0% maint · 8.0% mgmt
Financing live
Cash to close
- Down payment
- $35,000
- Closing costs
- $4,200
- Reserves months
- —
- Total cash needed
- —
Loan-product check · same deal, 3 products live
Conventional
25% down · 7.5% · 30yr
- Down + closing
- —
- Monthly P&I
- —
- Monthly cashflow
- —
- DSCR
- —
- Eligible?
- —
Personal DTI + credit; lowest rate.
DSCR
20% down · 8.5% · 30yr
- Down + closing
- —
- Monthly P&I
- —
- Monthly cashflow
- —
- DSCR
- —
- Eligible?
- —
No personal income docs; deal must DSCR.
Hard money
10% down · 12.0% · 12mo
- Down + closing
- —
- Monthly P&I
- —
- Monthly cashflow
- —
- DSCR
- —
- Eligible?
- —
Short-term bridge; refi at stabilization.
Rent comps 7 comps
| Address | Beds | Baths | Sqft | Rent | $/sqft | DOM | Units | Dist |
|---|---|---|---|---|---|---|---|---|
| 107 Cambridge Oaks Cir Kings Mountain, NC | 1.0–3.0 | 1.0–2.0 | 986 | $1,047 | $1.06 | 1d | 1 | 0.45mi |
| 140 W Mountain St Kings Mountain, NC | 1.0 | 1.0 | 560 | $1,450 | $2.59 | 3d | 1 | 0.60mi |
| 140 W Mountain St #204 Kings Mountain, NC | 1.0 | 1.0 | 560 | $1,450 | $2.59 | 11d | 1 | 0.60mi |
| 401 W Mountain St Kings Mountain, NC | 2.0 | 1.0 | 750 | $1,200 | $1.60 | 23d | 1 | 0.89mi |
| 806 Cleveland Ave Unit A Kings Mountain, NC | 1.0 | 1.0 | 600 | $950 | $1.58 | 14d | 1 | 1.14mi |
| 808 Cleveland Ave Unit B Kings Mountain, NC | 1.0 | 1.0 | 600 | $995 | $1.66 | 14d | 1 | 1.15mi |
| 914 Linwood Rd Kings Mountain, NC | 2.0 | 1.0 | 948 | $1,400 | $1.48 | 4d | 1 | 1.30mi |
Listing history 18 events
-
2026-06-19days on market $140,000 Active 77 DOM
-
2026-06-18days on market $140,000 Active 76 DOM
-
2026-06-17days on market $140,000 Active 75 DOM
-
2026-06-16days on market $140,000 Active 74 DOM
-
2026-06-15days on market $140,000 Active 73 DOM
-
2026-06-14days on market $140,000 Active 71 DOM
-
2026-06-13days on market $140,000 Active 70 DOM
-
2026-06-10days on market $140,000 Active 68 DOM
-
2026-06-09days on market $140,000 Active 67 DOM
-
2026-06-08days on market $140,000 Active 66 DOM
-
2026-06-07days on market $140,000 Active 65 DOM
-
2026-06-05days on market $140,000 Active 62 DOM
-
2026-06-03days on market $140,000 Active 61 DOM
-
2026-06-02days on market $140,000 Active 60 DOM
-
2026-06-01days on market $140,000 Active 59 DOM
-
2026-05-31days on market $140,000 Active 58 DOM
-
2026-05-30days on market $140,000 Active 57 DOM
-
2026-04-03$140,000 Active
ⓘ Source: listings_history table (triggers on properties + properties_extension) + one-shot
backfill from property_details.listing_events for pre-trigger history.
Tax reassessment forecast NC · Resets to sale price
- Current annual tax
- $822 · $68/mo
- Projected year-2 tax
- $1,148 · $96/mo
- Expected delta
- +$326/yr (+$27/mo · 39.7%)
ⓘ Screening estimate from a state-policy table — verify with the county assessor before closing.
Climate risk First Street
- Flood 1/10 Low FEMA zone X (unshaded) · 0% chance over 30 yrs
- Wildfire 3/10 Moderate
- Heat 6/10 Major 7 d/yr ≥103°F today · 17 d/yr by 30 yrs out
- Wind 4/10 Moderate 9% chance of damaging wind over 30 yrs
- Air quality 3/10 Moderate 3 unhealthy d/yr today · 3 by 30 yrs out
Nearby sold comps map
Loading sold comps map…
Walkable amenities ~0.75 mi
Loading nearby amenities…
Taxation est. · year 1
- Rental income
- $16,142
- − Mortgage interest
- −$7,842
- − Property taxes
- −$822
- − Insurance
- −$700
- − Repairs & maintenance
- −$1,291
- − Management
- −$1,291
- − Depreciation
- −$4,073
- Taxable income
- $123
- Est. tax owed @ 24.0%
- −$29
- After-tax cash flow
- $2,391/yr
For passive investors: Depreciation is non-cash, so a rental often shows a tax loss while cash-flowing — sheltering income. Rental losses are passive: they offset passive income freely, and up to $25,000/yr can offset ordinary (W-2) income if you actively participate and your MAGI is under $100k (phasing out to $0 by $150k); unused losses carry forward. On sale, claimed depreciation is recaptured at up to 25%, and gains may owe capital-gains tax (a 1031 exchange can defer both). Figures are a year-1 estimate at your 24.0% rate — not tax advice; consult a CPA.
Schools (NCES district)
- District
- Cleveland County Schools
- NCES district ID
- 3700900
- Math proficiency
- 47% ▬ 0.00%
- Reading proficiency
- 49% ▲ 4.00%
- Median HH income
- $38,501
- Composite
- 40.03/100
- National rank
- #3823
- State rank
- #76 of 178 in NC
Livability — Kings Mountain
- Score
- 63/100
- State rank
- #404
- US rank
- #15377
Category grades
Schools grade is shown separately in the Schools card above.
Census & demographics
- Census place
- Kings Mountain, NC
- County
- Cleveland County · 83,736 people
- City population
- 29,460
- Metro
- Shelby, NC
- Population (ZIP)
- 29,460
- Household income
- $62,414
- Rent vs Own
- Severe rent burden
- 726.0
Population outlook (Cleveland County) Hauer SSP2
- Today (2025)
- 93,671 people
- By 2030
- 91,157 · -2.7%
- By 2040
- 85,519 · -8.7%
- By 2050
- 79,708 · -14.9%
- By 2075
- 68,317 · -27.1%
- By 2100
- 57,145 · -39.0%
Race, ethnicity, and origin ACS 2023
- Neighborhood character
- Predominantly White (74%)
- Race & ethnicity
- White 74% Black 16% Two or more races 4% Hispanic / Latino 4% Asian 2%
- Common ancestry
- Slovak 3% Italian 2% Serbian 2%
- Foreign-born
- 5% · Canada
- Languages at home
- 93% English-only · Spanish 4% Other Asian/Pacific 2%
Political lean MEDSL · Cleveland
- 2024 margin
- Solid R (+35.0) · D 32.2% · R 67.2%
- 2008→2024 swing
- -15.1pp toward R · 2008: -19.9pp · 2024: -35.0pp
- All cycles
- 2024: R+35.0 2020: R+32.8 2016: R+30.6 2012: R+20.5 2008: R+19.9
Not yet ingested
- Civics
- —
Market trends
- HPI YoY
- ▼ -99.17%
- Current HPI
- 248.0613
- Rent YoY
- —
- Metro
- Shelby, NC
- State GDP YoY
- ▲ 3.28%
- F500 in state
- 26
Industry mix (Fortune 500 HQ in NC)
| Industry | F500 HQs | Revenue |
|---|---|---|
| Financial Services | 2 | $213B |
|
||
| Retail | 2 | $95B |
|
||
| Industrial Conglomerate | 1 | $38B |
|
||
| Metals / Steel | 1 | $35B |
|
||
| Utilities | 1 | $30B |
|
||
| Industrial Machinery | 1 | $19B |
|
||
Price history
1 event — show timeline
- 2026-04-03 Listed $140,000 CANOPYMLS as Distributed by MLS Grid
Property tax history
+16.9%/yrLatest (2025): $822 · +161.8% YoY. Source: county tax records.
Cash-flow waterfall
monthlySold comps — $/sqft
last 12 mo · ≤1 miLoading sold comps…