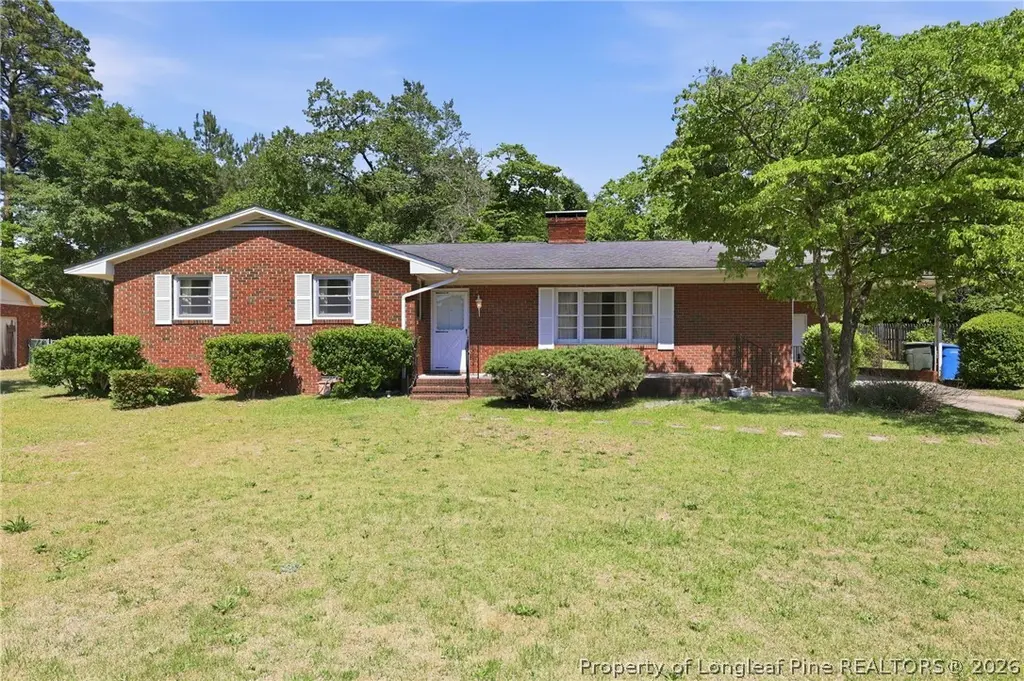
3130 Bancroft Ave · Fayetteville, NC
Flood risk 1/10 · Minimal
- FEMA flood zone
- X (unshaded)
- Chance of flooding over 30 yrs
- 0.0%
- Est. flood insurance / yr
- $473 – $860
Fire risk 4/10 · Minor
- Est. fire insurance / yr
- $906 – $1,684
Heat risk 7/10 · Major
- Hot days now (above 106°F)
- 7 days/yr
- Hot days in 30 yrs
- 16 days/yr
Wind risk 7/10 · Major
- Chance of severe wind over 30 yrs
- 75.0%
Air-quality risk 2/10 · Minimal
- Unhealthy air days now
- 0 days/yr
- Unhealthy air days in 30 yrs
- 1 days/yr
Risk factors via First Street. Map © Google.
Why this score? — see what drove the C+ grade
The composite is a weighted blend of 9 inputs, each scored 0–100. Each bar is that input's sub-score; the figure is the points it added to the 100-point composite (weight × sub-score).
- Cash flow +22.6/30.0
- ARV discount +15.0/15.0
- DSCR +7.2/10.0
- 1% rule +5.3/10.0
- Livability +3.8/5.0
- Rent growth +3.4/5.0
- Schools +3.1/10.0
- Condition / age +2.5/5.0
- Appreciation +0.0/10.0
$150,000
🖨 Deal sheet 📄 Offer letter ✓ Due diligence
Listing remarks
Solidly built home in the proud and well established E. E. Smith Golden Bulls community! New owners may wish to do updates and that is reflected in the list price. New AC unit installed in 2025, newer range, refrigerator and water heater. Three bedrooms with 2 full baths. Kitchen is open to a sitting room with one side of the two-sided fireplace. Sliding doors off the sitting room lead to the pretty backyard. Formal living room and dining area. Home features unfinished basement space which cab serve as storage. The metal building in the rear serves as additional storage. Shed appears to need to be torn down. Seller did not live in the property. Seller is selling the home AS IS. Keep that in
Key facts
- New ac unit
- Newer water heater
- Newer refrigerator
Tags
Property features AI
Exterior
- Parking: Attached carport; 1 covered space; 1 carport space
- Utilities: Public water; Public sewer
- Home design: Single family residence; Residential property in the STUBBS AC subdivision
- Construction: Brick veneer construction
- Exterior features: Cleared, level lot
Interior
- Kitchen: Refrigerator
- Bedrooms: 6 total rooms (bedroom count not specified)
- Flooring: Laminate; Wood; Carpet
- Bathrooms: 2 full bathrooms
- Heating & cooling: Central air; Electric cooling
- Interior features: Storage; Double-sided fireplace (1)
- Laundry & utility: Crawl space
Neighborhood map
What this means for you Summary
Snapshot
- This is a 3-bed/2.0-bath single-family listed at $150k.
Deal economics
- At list price, monthly cash flow is $256 ($3k/yr) — positive.
- The deal already cash-flows at list — no discount required.
- Meets the 1% rule at list price ($2k rent vs $150k).
- Cap rate 8.3% vs local median 4.9% in Fayetteville — top-decile yield for the area; either an underpriced asset or a hidden risk that comps aren't pricing in. Stress-test before assuming the spread holds.
Location & tenants
- Location reads 75/100 on livability (#45 in NC, #4,031 nationally) — a middle-class / working-renter tenant base. Strengths: commute A+, cost of living A+, housing A+; Watch: crime F, employment D-.
- Cumberland County Schools (urban): math 32% / reading 41% proficiency, ranked #126 of 178 in NC (top 71%) — families likely to look elsewhere, expect single-tenant / working-renter base with shorter leases.
- Zoned schools: Luther Nick Jeralds Middle (math 13% / reading 24%, grade F, #436 of 475 statewide, top 93%, 616 students, 100% FRL); E E Smith High (math 42% / reading 41%, grade F, #381 of 535 statewide, top 72%, 1,004 students, 99% FRL) — zoned schools average 99% FRL vs 55% district-wide (45 pts higher); higher-poverty schools than district average — tighter screening recommended.
- Market conditions: Rents rising (+3.5%/yr); 132 active listings in the ZIP; 29 comparable units currently listed for rent nearby; rentals at typical pace (median 24d on market — plan ~3-4 weeks tenant-placement turnaround); lower-income renter base — watch delinquency; 1,125 units permitted in Cumberland County in 2024 (104 in 5+ unit buildings).
- At $1,552/mo this rent would consume 48% of the median local household income ($39k/yr) (locally 1389% of renters already pay >50% of income on rent) — very limited rent-growth headroom before tenants either downsize or default.
Forward outlook
- Local home prices are declining (-3.0%/yr); year-one equity from $1k of loan paydown is wiped out by about $4k of value loss. Plan a longer hold.
Negotiation context
- Only 3 days on market — expect competitive offers; lowballing is unlikely to land.
Risks & watch-outs
- Climate carrying-cost: major wind risk, 75% chance of damaging wind over 30y; extreme-heat days projected 7→16/yr by 2055 (HVAC capex compounding) — expect insurance premiums to compound above CPI over the hold.
Questions for the listing agent
- Built in 1961 — when were the roof, HVAC, electrical panel, plumbing, and water heater last replaced?
- Is there a deadline driving the sale (1031 exchange, divorce, estate, relocation)? That informs how much negotiation room exists.
- Crime grade is F in this area — have there been break-ins, vandalism, or insurance claims at this property in the last 3 years? What carrier currently insures it and at what premium?
- What's the average days-on-market for RENTAL listings here right now (not sales)? A rising rental-DOM trend means longer vacancies and softer asking-rent achievability than the comps imply.
- What's the recent tenant-quality profile in this submarket — average credit score on applications, eviction rate, late-payment / NSF rate, and stable-employment percentage? A property-management company in the area should have these aggregated.
- How much new for-sale + rental construction is in the pipeline within 1–3 miles? Heavy new supply typically softens prices + rents 12–24 months out; constrained supply supports both.
Investment metrics
- 1% rule
- 1.03% ✓
- Cap rate
- 8.34%
- Cash-on-cash
- 7.30%
- DSCR
- 1.32
- GRM
- 8.1
CMA / ARV
- ARV (on-the-fly)
- $217,708
- Comps found
- 12
Show comp detail 12 sales within ~0.75 mi
| Address | Dist | Beds/Ba | Sqft | Sold | Price | $/sf | Match |
|---|---|---|---|---|---|---|---|
| 3420 Green Valley Rd | 0.35mi | 3/2.0 | 1,440 (-2%) | 1mo | $242,500 | $168 | 79 |
| 324 Bartow Dr | 0.51mi | 3/2.0 | 1,435 (-2%) | 1mo | $213,000 | $148 | 71 |
| 3513 Edna St | 0.50mi | 3/2.0 | 1,428 (-3%) | 8mo | $185,000 | $130 | 66 |
| 230 Chloe Dr | 0.11mi | 3/2.5 | 1,671 (+14%) | 9mo | $235,000 | $141 | 63 |
| 335 Bartow Dr | 0.56mi | 4/2.0 (+1) | 1,469 (-0%) | 10mo | $170,000 | $116 | 60 |
| 529 Grafton Ave | 0.38mi | 3/1.0 | 1,350 (-8%) | 7mo | $172,500 | $128 | 59 |
| 3513 Hastings Dr | 0.29mi | 3/2.0 | 1,252 (-15%) | 4mo | $215,000 | $172 | 58 |
| 3640 Hastings Dr | 0.65mi | 3/2.0 | 1,368 (-7%) | 2mo | $217,500 | $159 | 56 |
| 3644 Hastings Dr | 0.66mi | 3/2.0 | 1,350 (-8%) | 2mo | $229,977 | $170 | 54 |
| 125 Brainerd Ave | 0.72mi | 3/2.0 | 1,600 (+9%) | 9mo | $215,000 | $134 | 44 |
| 3597 St Andrews Ct | 0.55mi | 3/2.0 | 1,689 (+15%) | 7mo | $243,900 | $144 | 44 |
| 3026 Broadview Dr | 0.66mi | 3/2.5 | 1,668 (+13%) | 13mo | $284,900 | $171 | 34 |
Match score weights: distance 35% · size 25% · config 20% · recency 20%. Top-matched comps best support the ARV.
Projected returns pro-forma
-3.0% appreciation · 3.49% rent growth · sell at horizon
- IRR
- -4.6%
- Equity multiple
- 0.83×
- Total profit
- $-7,280
- Equity at exit
- $22,365
- IRR
- 5.6%
- Equity multiple
- 1.42×
- Total profit
- $17,734
- Equity at exit
- $12,969
Cash invested: $42,000 (down + closing). Projections, not guarantees.
Landlord ↔ Tenant lean methodology
- Overall (STATE)
- 85 Strongly Landlord-Friendly
- State North Carolina
- 85 Strongly Landlord-Friendly · R+3
- County
- — inherits STATE
- City
- — inherits STATE
ZIP-level market 28301
- Home prices YoY
- -12.5%
- Rents YoY
- 3.5%
- Active inventory
- 132
- Price-to-rent
- 8.1×
Monthly cashflow live
- Estimated rent
- $1,552 high interval (Pro) →
- Mortgage (P&I)
- −$787
- Tax from tax record
- −$122 /mo · $1,459/yr
- Insurance
- −$62
- HOA
- −$0
- Vacancy / Maint / Mgmt
- −$326
- Net cashflow
- $256
Break-even live
UW: 25.0% down · 7.5% · 30yr · 1.5% tax · 5.0% vac · 8.0% maint · 8.0% mgmt
Financing live
Cash to close
- Down payment
- $37,500
- Closing costs
- $4,500
- Reserves months
- —
- Total cash needed
- —
Loan-product check · same deal, 3 products live
Conventional
25% down · 7.5% · 30yr
- Down + closing
- —
- Monthly P&I
- —
- Monthly cashflow
- —
- DSCR
- —
- Eligible?
- —
Personal DTI + credit; lowest rate.
DSCR
20% down · 8.5% · 30yr
- Down + closing
- —
- Monthly P&I
- —
- Monthly cashflow
- —
- DSCR
- —
- Eligible?
- —
No personal income docs; deal must DSCR.
Hard money
10% down · 12.0% · 12mo
- Down + closing
- —
- Monthly P&I
- —
- Monthly cashflow
- —
- DSCR
- —
- Eligible?
- —
Short-term bridge; refi at stabilization.
Rent comps 29 comps
| Address | Beds | Baths | Sqft | Rent | $/sqft | DOM | Units | Dist |
|---|---|---|---|---|---|---|---|---|
| 3557 Hastings Dr Fayetteville, NC | 4.0 | 2.5 | 1652 | $1,795 | $1.09 | 23d | 1 | 0.41mi |
| 1659 Rock Creek Ln Fayetteville, NC | 4.0 | 2.5 | 1777 | $2,100 | $1.18 | 14d | 1 | 0.42mi |
| 633 Elk Ct Fayetteville, NC | 2.0 | 1.5 | 1000 | $1,000 | $1.00 | 23d | 1 | 0.51mi |
| 302 Law Rd Fayetteville, NC | 2.0 | 1.5 | 940 | $999 | $1.06 | 14d | 1 | 0.60mi |
| 118 Circle Ct Fayetteville, NC | 3.0 | 2.0 | 1496 | $1,550 | $1.04 | 14d | 1 | 0.67mi |
| 228 Eastwood Ave Fayetteville, NC | 3.0 | 2.0 | 1820 | $1,755 | $0.96 | 23d | 1 | 0.72mi |
| 2737 Kentberry Ave Fayetteville, NC | 2.0–3.0 | 2.0 | 1209 | $1,400 | $1.16 | 14d | 5 | 0.77mi |
| 2846 Copenhagen Dr Fayetteville, NC | 3.0 | 2.0 | 1100 | $1,600 | $1.45 | 23d | 1 | 1.00mi |
| 715 Ashburton Dr Fayetteville, NC | 3.0 | 2.0 | 1278 | $1,600 | $1.25 | 23d | 1 | 1.04mi |
| 733 Ashburton Dr Fayetteville, NC | 3.0 | 1.5 | 1118 | $1,300 | $1.16 | 23d | 1 | 1.04mi |
| 2061 Osceola Dr Fayetteville, NC | 3.0 | 1.0 | 928 | $1,300 | $1.40 | 23d | 1 | 1.05mi |
| 508 Stone Way Ct Fayetteville, NC | 3.0 | 2.0 | 1261 | $1,900 | $1.51 | 23d | 1 | 1.12mi |
| 4453 Oakmont Cir Fayetteville, NC | 3.0 | 1.0 | 1101 | $1,300 | $1.18 | 14d | 1 | 1.14mi |
| 2678 Rivercliff Rd Fayetteville, NC | 3.0 | 2.0 | 1260 | $1,500 | $1.19 | 23d | 1 | 1.14mi |
| 539 Crooked Creek Ct Fayetteville, NC | 3.0 | 2.0 | 1258 | $1,395 | $1.11 | 23d | 1 | 1.16mi |
| 3523 Rosehill Rd Fayetteville, NC | 4.0 | 1.0 | 1448 | $1,450 | $1.00 | 14d | 1 | 1.20mi |
| 398 Bainbridge Ct Fayetteville, NC | 3.0 | 2.0 | 900 | $990 | $1.10 | 23d | 1 | 1.29mi |
| 398 Bainbridge Ct Fayetteville, NC | 3.0 | 2.0 | 900 | $990 | $1.10 | 14d | 1 | 1.29mi |
| 3446 Sandystone Cir Fayetteville, NC | 3.0 | 2.5 | 1489 | $1,700 | $1.14 | 23d | 1 | 1.32mi |
| 3517 Gowan Ln Fayetteville, NC | 3.0 | 2.5 | 1792 | $1,750 | $0.98 | 23d | 1 | 1.34mi |
| 4016 Bankside Dr Fayetteville, NC | 3.0 | 2.5 | 1846 | $1,800 | $0.98 | 14d | 1 | 1.35mi |
| 1847 Blake St Fayetteville, NC | 3.0 | 2.0 | 900 | $990 | $1.10 | 14d | 1 | 1.36mi |
| 1847 Blake St Fayetteville, NC | 3.0 | 2.0 | 900 | $990 | $1.10 | 23d | 1 | 1.36mi |
| 505 Ashdown Pl Fayetteville, NC | 4.0 | 2.0 | 1410 | $1,750 | $1.24 | 14d | 1 | 1.38mi |
| 4549 Rustic Haven Dr Fayetteville, NC | 3.0 | 2.0 | 1682 | $1,825 | $1.09 | 14d | 1 | 1.46mi |
| 319 Idlewild Dr Fayetteville, NC | 2.0 | 2.0–2.5 | 1080 | $1,340 | $1.24 | 14d | 9 | 1.47mi |
| 319 Idlewild Dr Fayetteville, NC | 2.0 | 2.0–2.5 | 1080 | $1,350 | $1.25 | 23d | 3 | 1.48mi |
| 1608 Fayette Ave Fayetteville, NC | 2.0 | 1.0 | 900 | $875 | $0.97 | 23d | 1 | 1.49mi |
| 1608 Fayette Ave Fayetteville, NC | 2.0 | 1.0 | 900 | $875 | $0.97 | 14d | 1 | 1.49mi |
Listing history 1 events
-
2026-05-20$150,000 Active
ⓘ Source: listings_history table (triggers on properties + properties_extension) + one-shot
backfill from property_details.listing_events for pre-trigger history.
Tax reassessment forecast NC · Resets to sale price
- Current annual tax
- $1,459 · $122/mo
- Projected year-2 tax
- $1,459 · $122/mo
- Expected delta
- $0/yr ($0/mo · 0.0%)
ⓘ Screening estimate from a state-policy table — verify with the county assessor before closing.
Climate risk First Street
- Flood 1/10 Low FEMA zone X (unshaded) · 0% chance over 30 yrs
- Wildfire 4/10 Moderate
- Heat 7/10 Severe 7 d/yr ≥106°F today · 16 d/yr by 30 yrs out
- Wind 7/10 Severe 75% chance of damaging wind over 30 yrs
- Air quality 2/10 Low 0 unhealthy d/yr today · 1 by 30 yrs out
Nearby sold comps map
Loading sold comps map…
Walkable amenities ~0.75 mi
Loading nearby amenities…
Taxation est. · year 1
- Rental income
- $18,626
- − Mortgage interest
- −$8,402
- − Property taxes
- −$1,459
- − Insurance
- −$750
- − Repairs & maintenance
- −$1,490
- − Management
- −$1,490
- − Depreciation
- −$4,364
- Taxable income
- $671
- Est. tax owed @ 24.0%
- −$161
- After-tax cash flow
- $2,905/yr
For passive investors: Depreciation is non-cash, so a rental often shows a tax loss while cash-flowing — sheltering income. Rental losses are passive: they offset passive income freely, and up to $25,000/yr can offset ordinary (W-2) income if you actively participate and your MAGI is under $100k (phasing out to $0 by $150k); unused losses carry forward. On sale, claimed depreciation is recaptured at up to 25%, and gains may owe capital-gains tax (a 1031 exchange can defer both). Figures are a year-1 estimate at your 24.0% rate — not tax advice; consult a CPA.
Schools (NCES district)
- District
- Cumberland County Schools
- NCES district ID
- 3700011
- Math proficiency
- 32% ▼ -2.00%
- Reading proficiency
- 41% ▼ -1.00%
- Median HH income
- $44,168
- Composite
- 31.0/100
- National rank
- #6096
- State rank
- #126 of 178 in NC
Livability — Fayetteville
- Score
- 75/100
- State rank
- #45
- US rank
- #4031
Category grades
Schools grade is shown separately in the Schools card above.
Census & demographics
- Census place
- Fayetteville, NC
- County
- Cumberland County · 265,314 people
- City population
- 226,118
- Metro
- Fayetteville, NC
- Population (ZIP)
- 16,798
- Household income
- $39,198
- Rent vs Own
- Severe rent burden
- 1389.0
Population outlook (Cumberland County) Hauer SSP2
- Today (2025)
- 330,855 people
- By 2030
- 333,523 · +0.8%
- By 2040
- 335,583 · +1.4%
- By 2050
- 335,325 · +1.4%
- By 2075
- 342,853 · +3.6%
- By 2100
- 340,698 · +3.0%
Race, ethnicity, and origin ACS 2023
- Neighborhood character
- Predominantly Black (68%)
- Race & ethnicity
- Black 68% White 19% Two or more races 6% Hispanic / Latino 5%
- Common ancestry
- Serbian 1% Slovak 1% Romanian 1%
- Foreign-born
- 3% · Canada
- Languages at home
- 95% English-only · Spanish 3% French/Haitian/Cajun 1%
Political lean MEDSL · Cumberland
- 2024 margin
- D (+13.4) · D 56.1% · R 42.7% · Other 1.2%
- 2008→2024 swing
- -4.3pp toward R · 2008: 17.7pp · 2024: 13.4pp
- All cycles
- 2024: D+13.4 2020: D+16.6 2016: D+16.0 2012: D+19.7 2008: D+17.7
Not yet ingested
- Civics
- —
Market trends
- HPI YoY
- ▼ -37.92%
- Current HPI
- 265.98
- Rent YoY
- ▲ 3.49%
- Metro
- Fayetteville, NC
- State GDP YoY
- ▲ 3.28%
- F500 in state
- 26
Industry mix (Fortune 500 HQ in NC)
| Industry | F500 HQs | Revenue |
|---|---|---|
| Financial Services | 2 | $213B |
|
||
| Retail | 2 | $95B |
|
||
| Industrial Conglomerate | 1 | $38B |
|
||
| Metals / Steel | 1 | $35B |
|
||
| Utilities | 1 | $30B |
|
||
| Industrial Machinery | 1 | $19B |
|
||
Price history
1 event — show timeline
- 2026-05-20 Listed $150,000 LPRMLS
Property tax history
+5.6%/yrLatest (2025): $1,459 · +26.8% YoY. Source: county tax records.
Cash-flow waterfall
monthlySold comps — $/sqft
last 12 mo · ≤1 miLoading sold comps…