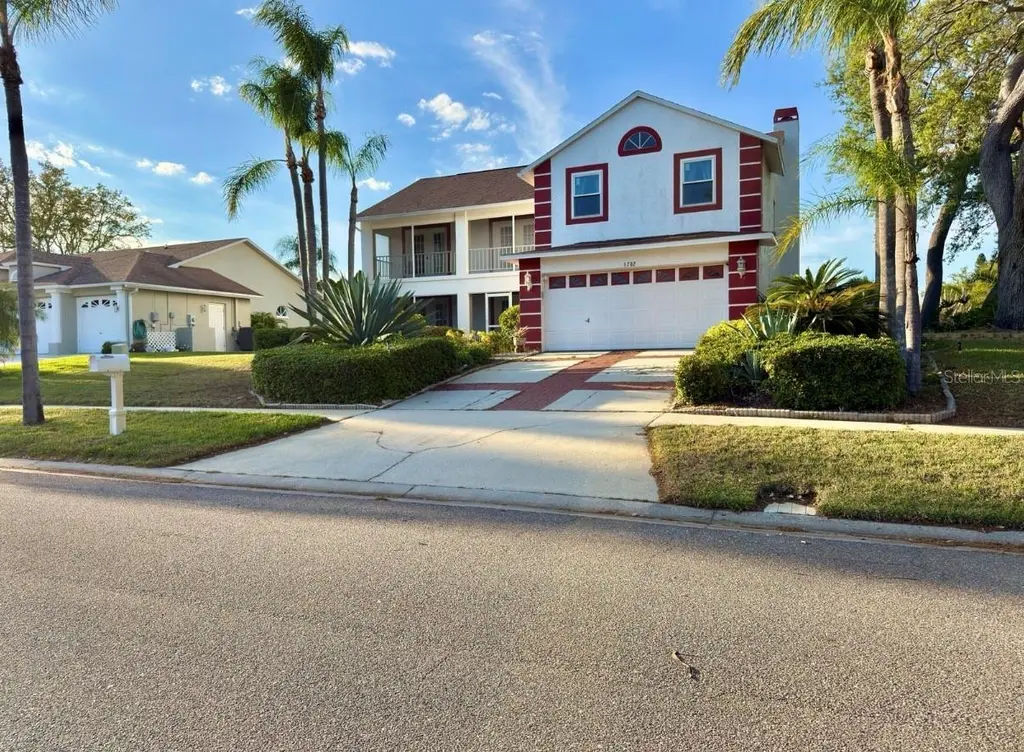
1702 Sunkissed Dr · Tarpon Springs, FL
Flood risk 5/10 · Moderate
- FEMA flood zone
- X (shaded)
- Chance of flooding over 30 yrs
- 0.37%
- Est. flood insurance / yr
- $507 – $1,088
Fire risk 1/10 · Minimal
- Est. fire insurance / yr
- $947 – $1,759
Heat risk 10/10 · Severe
- Hot days now (above 109°F)
- 7 days/yr
- Hot days in 30 yrs
- 27 days/yr
Wind risk 10/10 · Severe
- Chance of severe wind over 30 yrs
- 99.0%
Air-quality risk 3/10 · Minor
- Unhealthy air days now
- 3 days/yr
- Unhealthy air days in 30 yrs
- 3 days/yr
Risk factors via First Street. Map © Google.
Why this score? — see what drove the C grade
The composite is a weighted blend of 9 inputs, each scored 0–100. Each bar is that input's sub-score; the figure is the points it added to the 100-point composite (weight × sub-score).
- Cash flow +19.5/30.0
- ARV discount +15.0/15.0
- DSCR +6.2/10.0
- Schools +4.3/10.0
- 1% rule +4.2/10.0
- Livability +3.4/5.0
- Condition / age +2.5/5.0
- Rent growth +2.2/5.0
- Appreciation +0.0/10.0
$599,000
🖨 Deal sheet 📄 Offer letter ✓ Due diligence
Listing remarks
Spacious two-story home offering a flexible layout, generous living areas, and excellent outdoor space. The home features 4 bedrooms, a loft, large living areas, a 2-car garage and tons of natural light. The inviting curb appeal is highlighted by mature landscaping, tall palms, and a covered front entry. Inside the kitchen features stone countertops, stainless steel appliances, ample cabinet space and a functional breakfast bar/eat in kitchen that opens to the main living space. Large sliding glass doors allow tons of natural sunlight into the first floor. The large living room is centered around a fireplace and offers plenty of room for everyday living and entertaining. Upstairs, the expan
Key facts
- Stone countertops
- Mature landscaping
- Covered front entry
Tags
Property features AI
Finance
- Other: Homestead exemption indicated; Partially furnished
- HOA & community: Street lights
Exterior
- Parking: Attached 2-car garage
- Utilities: Public water; Public sewer; Cable connected; Electricity connected; Fiber optics
- Home design: Single family residence; Two stories; Entry faces south; Completed condition
- Construction: Block and stucco construction; Shingle roof; Slab foundation; Built as existing (year not specified)
- Exterior features: Covered, enclosed, front, rear and screened porches; Balcony; French doors; Sliding doors; Sidewalk; Shed(s); Mature landscaping with oak trees; Irrigation equipment; Corner lot on a cul-de-sac; oversized, landscaped, private and sloped with street dead-end
Interior
- Kitchen: Dishwasher; Disposal; Microwave; Stone counters; Eat-in kitchen
- Bedrooms: 4 bedrooms
- Flooring: Carpet; Tile
- Bathrooms: 2 full baths; 1 half bath
- Heating & cooling: Central heating (electric); Central air conditioning
- Interior features: Ceiling fans; Eat-in kitchen; Open floorplan; Stone counters; Window treatments; Family room; Formal dining room; Inside utility; Wood-burning fireplace
- Laundry & utility: Laundry closet; Washer; Dryer; Electric water heater
Neighborhood map
What this means for you Summary
Snapshot
- This is a 4-bed/3.0-bath single-family listed at $599k.
Deal economics
- At list price, monthly cash flow is $676 ($8k/yr) — positive.
- The deal already cash-flows at list — no discount required.
- To meet the 1% rule (rent ≥ 1% of price), the offer needs to be $550k (8.3% below list).
- Recommended offer: $550k (8.3% below list) — sets the bar for 1% rule.
- Cap rate 7.6% vs local median 3.4% in Tarpon Springs — top-decile yield for the area; either an underpriced asset or a hidden risk that comps aren't pricing in. Stress-test before assuming the spread holds.
Location & tenants
- Location reads 68/100 on livability (#502 in FL) — a middle-class / working-renter tenant base. Strengths: housing A+, cost of living A, schools A-; Watch: employment C-, amenities F, commute F.
- Pinellas (suburban): math 51% / reading 51% proficiency, ranked #31 of 73 in FL (top 42%) — acceptable for families but not a draw, mixed tenant base, ~2y average lease.
- Market conditions: Rents soft (-1.2%/yr); 399 active listings in the ZIP; 4 comparable units currently listed for rent nearby; rentals leasing fast (median 3d on market — plan ~1-2 weeks tenant-placement turnaround); 2,676 units permitted in Pinellas County in 2024 (1,422 in 5+ unit buildings).
- At $5,496/mo this rent would consume 88% of the median local household income ($75k/yr) (locally 721% of renters already pay >50% of income on rent) — very limited rent-growth headroom before tenants either downsize or default.
Forward outlook
- Local home prices are declining (-3.0%/yr); year-one equity from $4k of loan paydown is wiped out by about $18k of value loss. Plan a longer hold.
- Pinellas County population projected at +14% by 2050 — modest demand growth; plan on rents tracking national, not racing it.
Negotiation context
- It's been on market 49 days — a 3% lower offer ($581k) is reasonable based on typical stale-listing flexibility.
- Current owner paid $35k; list at $599k implies a 1611% gain — meaningful room to come down on a strong offer.
Risks & watch-outs
- Climate carrying-cost: moderate flood risk; severe wind risk, 99% chance of damaging wind over 30y; extreme-heat days projected 7→27/yr by 2055 (HVAC capex compounding) — expect insurance premiums to compound above CPI over the hold.
Questions for the listing agent
- It's been on market 49 days. Have you received any prior offers? Is the seller open to a 8% concession, seller financing, or rate buy-down credit?
- Is there a deadline driving the sale (1031 exchange, divorce, estate, relocation)? That informs how much negotiation room exists.
- Schools are A-rated — typically a magnet for longer-tenancy family renters. What's the average tenant stay here, and is there a school-zone premium baked into asking?
- What's the average days-on-market for RENTAL listings here right now (not sales)? A rising rental-DOM trend means longer vacancies and softer asking-rent achievability than the comps imply.
- What's the recent tenant-quality profile in this submarket — average credit score on applications, eviction rate, late-payment / NSF rate, and stable-employment percentage? A property-management company in the area should have these aggregated.
- How much new for-sale + rental construction is in the pipeline within 1–3 miles? Heavy new supply typically softens prices + rents 12–24 months out; constrained supply supports both.
Investment metrics
- 1% rule
- 0.92% ✗
- Cap rate
- 7.65%
- Cash-on-cash
- 4.84%
- DSCR
- 1.22
- GRM
- 9.1
CMA / ARV
- ARV (on-the-fly)
- $744,604
- Comps found
- 6
Show comp detail 6 sales within ~0.75 mi
| Address | Dist | Beds/Ba | Sqft | Sold | Price | $/sf | Match |
|---|---|---|---|---|---|---|---|
| 1726 Sunkissed Dr | 0.16mi | 4/4.0 | 2,694 (-5%) | 2mo | $1,100,000 | $408 | 78 |
| 422 Treasure Dr | 0.19mi | 4/3.0 | 2,718 (-4%) | 8mo | $500,000 | $184 | 77 |
| 1021 Hamilton Ave | 0.58mi | 4/3.0 | 2,557 (-10%) | 0mo | $670,000 | $262 | 56 |
| 1330 Belcher Dr | 0.73mi | 5/3.5 (+1) | 2,985 (+5%) | 2mo | $775,000 | $260 | 50 |
| 1112 N Florida Ave | 0.64mi | 4/3.0 | 2,444 (-14%) | 3mo | $550,000 | $225 | 44 |
| 244 S Beach Dr | 0.49mi | 4/4.0 | 3,128 (+10%) | 15mo | $1,208,000 | $386 | 43 |
Match score weights: distance 35% · size 25% · config 20% · recency 20%. Top-matched comps best support the ARV.
Projected returns pro-forma
-3.0% appreciation · 0.0% rent growth · sell at horizon
- IRR
- -11.9%
- Equity multiple
- 0.58×
- Total profit
- $-70,335
- Equity at exit
- $89,313
- IRR
- -7.4%
- Equity multiple
- 0.59×
- Total profit
- $-68,910
- Equity at exit
- $51,791
Cash invested: $167,720 (down + closing). Projections, not guarantees.
Landlord ↔ Tenant lean methodology
- Overall (STATE)
- 87 Strongly Landlord-Friendly
- State Florida
- 87 Strongly Landlord-Friendly · R+3
- County
- — inherits STATE
- City
- — inherits STATE
ZIP-level market 34689
- Rents YoY
- -1.2%
- Active inventory
- 399
- Price-to-rent
- 9.1×
Monthly cashflow live
- Estimated rent
- $5,496 medium interval (Pro) →
- Mortgage (P&I)
- −$3,141
- Tax from tax record
- −$275 /mo · $3,299/yr
- Insurance
- −$250
- HOA
- −$0
- Vacancy / Maint / Mgmt
- −$1,154
- Net cashflow
- $676
Break-even live
UW: 25.0% down · 7.5% · 30yr · 1.5% tax · 5.0% vac · 8.0% maint · 8.0% mgmt
Financing live
Cash to close
- Down payment
- $149,750
- Closing costs
- $17,970
- Reserves months
- —
- Total cash needed
- —
Loan-product check · same deal, 3 products live
Conventional
25% down · 7.5% · 30yr
- Down + closing
- —
- Monthly P&I
- —
- Monthly cashflow
- —
- DSCR
- —
- Eligible?
- —
Personal DTI + credit; lowest rate.
DSCR
20% down · 8.5% · 30yr
- Down + closing
- —
- Monthly P&I
- —
- Monthly cashflow
- —
- DSCR
- —
- Eligible?
- —
No personal income docs; deal must DSCR.
Hard money
10% down · 12.0% · 12mo
- Down + closing
- —
- Monthly P&I
- —
- Monthly cashflow
- —
- DSCR
- —
- Eligible?
- —
Short-term bridge; refi at stabilization.
Rent comps 4 comps
| Address | Beds | Baths | Sqft | Rent | $/sqft | DOM | Units | Dist |
|---|---|---|---|---|---|---|---|---|
| 512 Wayfarer Dr Unit 1244468P Tarpon Springs, FL | 3.0 | 2.0 | 2389 | $6,324 | $2.65 | 3d | 1 | 0.22mi |
| 1417 Poinsettia Ave Unit 1244469P Tarpon Springs, FL | 4.0 | 3.0 | 2098 | $6,739 | $3.21 | 7d | 1 | 0.47mi |
| 1334 Belcher Dr Tarpon Springs, FL | 3.0 | 2.0 | 2055 | $3,500 | $1.70 | 1d | 1 | 0.68mi |
| 1445 Riverside Dr Tarpon Springs, FL | 4.0 | 3.5 | 2736 | $9,000 | $3.29 | 2d | 1 | 1.02mi |
Listing history 16 events
-
2026-06-18days on market $599,000 Active 49 DOM
-
2026-06-17days on market $599,000 Active 48 DOM
-
2026-06-16days on market $599,000 Active 47 DOM
-
2026-06-15days on market $599,000 Active 46 DOM
-
2026-06-13days on market $599,000 Active 44 DOM
-
2026-06-09days on market $599,000 Active 40 DOM
-
2026-06-08days on market $599,000 Active 39 DOM
-
2026-06-07days on market $599,000 Active 38 DOM
-
2026-06-04days on market $599,000 Active 35 DOM
-
2026-06-03days on market $599,000 Active 34 DOM
-
2026-06-01days on market $599,000 Active 32 DOM
-
2026-05-31days on market $599,000 Active 31 DOM
-
2026-05-18price $599,000
-
2026-04-30$615,000 Active
-
1995-05-16soldstatus $35,000
-
1988-11-23soldstatus $50,000
ⓘ Source: listings_history table (triggers on properties + properties_extension) + one-shot
backfill from property_details.listing_events for pre-trigger history.
Tax reassessment forecast FL · Resets to sale price
- Current annual tax
- $3,299 · $275/mo
- Projected year-2 tax
- $4,972 · $414/mo
- Expected delta
- +$1,672/yr (+$139/mo · 50.7%)
ⓘ Screening estimate from a state-policy table — verify with the county assessor before closing.
Climate risk First Street
- Flood 5/10 Major FEMA zone X (shaded) · 37% chance over 30 yrs
- Wildfire 1/10 Low
- Heat 10/10 Extreme 7 d/yr ≥109°F today · 27 d/yr by 30 yrs out
- Wind 10/10 Extreme 99% chance of damaging wind over 30 yrs
- Air quality 3/10 Moderate 3 unhealthy d/yr today · 3 by 30 yrs out
Nearby sold comps map
Loading sold comps map…
Walkable amenities ~0.75 mi
Loading nearby amenities…
Taxation est. · year 1
- Rental income
- $65,948
- − Mortgage interest
- −$33,553
- − Property taxes
- −$3,299
- − Insurance
- −$2,995
- − Repairs & maintenance
- −$5,276
- − Management
- −$5,276
- − Depreciation
- −$17,425
- Taxable loss
- −$1,877
- Est. tax savings @ 24.0%
- +$450
- After-tax cash flow
- $8,560/yr
For passive investors: Depreciation is non-cash, so a rental often shows a tax loss while cash-flowing — sheltering income. Rental losses are passive: they offset passive income freely, and up to $25,000/yr can offset ordinary (W-2) income if you actively participate and your MAGI is under $100k (phasing out to $0 by $150k); unused losses carry forward. On sale, claimed depreciation is recaptured at up to 25%, and gains may owe capital-gains tax (a 1031 exchange can defer both). Figures are a year-1 estimate at your 24.0% rate — not tax advice; consult a CPA.
Schools (NCES district)
- District
- Pinellas
- NCES district ID
- 1201560
- Math proficiency
- 51% ▼ -5.00%
- Reading proficiency
- 51% ▼ -3.00%
- Median HH income
- $46,270
- Composite
- 43.27/100
- National rank
- #3046
- State rank
- #31 of 73 in FL
Livability — Tarpon Springs
- Score
- 68/100
- State rank
- #502
- US rank
- #9244
Category grades
Schools grade is shown separately in the Schools card above.
Census & demographics
- Census place
- Tarpon Springs, FL
- County
- Pinellas County · 939,478 people
- City population
- 27,324
- Metro
- Tampa-St. Petersburg-Clearwater, FL
- Population (ZIP)
- 27,324
- Household income
- $74,854
- Rent vs Own
- Severe rent burden
- 721.0
Population outlook (Pinellas County) Hauer SSP2
- Today (2025)
- 1,027,532 people
- By 2030
- 1,063,586 · +3.5%
- By 2040
- 1,125,020 · +9.5%
- By 2050
- 1,168,637 · +13.7%
- By 2075
- 1,265,188 · +23.1%
- By 2100
- 1,260,357 · +22.7%
Race, ethnicity, and origin ACS 2023
- Neighborhood character
- Predominantly White (80%)
- Race & ethnicity
- White 80% Hispanic / Latino 10% Two or more races 7% Black 6%
- Hispanic origin (detail)
- Mexican 2% Puerto Rican 4%
- Common ancestry
- Romanian 6% Lithuanian 3% Slovak 2%
- Foreign-born
- 10% · Canada, Jamaica, Dominican Republic
- Languages at home
- 84% English-only · Other Indo-European 6% Spanish 6% French/Haitian/Cajun 1%
Political lean MEDSL · Pinellas
- 2024 margin
- Lean R (+5.2) · D 46.9% · R 52.1%
- 2008→2024 swing
- -13.5pp toward R · 2008: 8.3pp · 2024: -5.2pp
- All cycles
- 2024: R+5.2 2020: D+0.2 2016: R+1.1 2012: D+5.6 2008: D+8.3
Not yet ingested
- Civics
- —
Market trends
- HPI YoY
- ▼ -300.96%
- Current HPI
- 303.7434
- Rent YoY
- ▼ -1.16%
- Metro
- Tampa-St. Petersburg-Clearwater, FL
- State GDP YoY
- ▲ 3.28%
- F500 in state
- 36
Industry mix (Fortune 500 HQ in FL)
| Industry | F500 HQs | Revenue |
|---|---|---|
| Industrial Technology | 2 | $29B |
|
||
| Insurance | 2 | $17B |
|
||
| Retail | 1 | $60B |
|
||
| Technology Distribution | 1 | $58B |
|
||
| Homebuilding | 1 | $35B |
|
||
| Technology Manufacturing | 1 | $35B |
|
||
Price history
+1098.0% since first listed4 events — show timeline
- 2026-05-18 Price Changed $599,000 Stellar MLS as Distributed by MLS Grid
- 2026-04-30 Listed $615,000 Stellar MLS as Distributed by MLS Grid
- 1995-05-16 Sold (Public Records) $35,000 Public Records
- 1988-11-23 Sold (Public Records) $50,000 Public Records
Property tax history
-1.4%/yrLatest (2025): $3,299 · +5.9% YoY. Source: county tax records.
Cash-flow waterfall
monthlySold comps — $/sqft
last 12 mo · ≤1 miLoading sold comps…