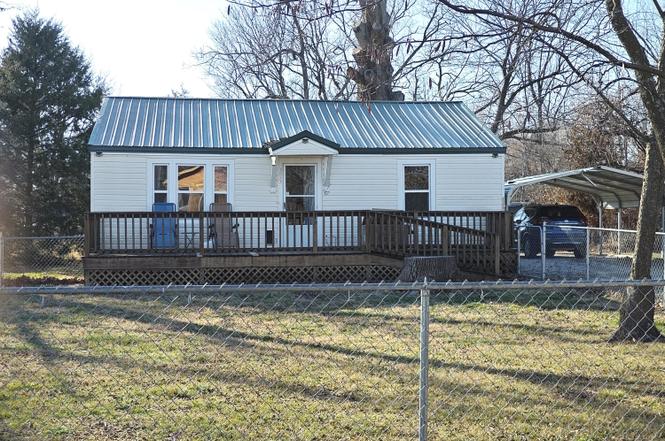
1106 Hicks Ave · Golden City, MO
Flood risk 1/10 · Minimal
- FEMA flood zone
- X (unshaded)
- Chance of flooding over 30 yrs
- 0.0%
- Est. flood insurance / yr
- $507 – $1,088
Fire risk 1/10 · Minimal
- Est. fire insurance / yr
- $1,054 – $1,958
Heat risk 5/10 · Moderate
- Hot days now (above 107°F)
- 7 days/yr
- Hot days in 30 yrs
- 19 days/yr
Wind risk 2/10 · Minimal
- Chance of severe wind over 30 yrs
- 2.0%
Air-quality risk 2/10 · Minimal
- Unhealthy air days now
- 1 days/yr
- Unhealthy air days in 30 yrs
- 1 days/yr
Risk factors via First Street. Map © Google.
Why this score? — see what drove the B grade
The composite is a weighted blend of 9 inputs, each scored 0–100. Each bar is that input's sub-score; the figure is the points it added to the 100-point composite (weight × sub-score).
- Cash flow +28.4/30.0
- DSCR +10.0/10.0
- Appreciation +9.2/10.0
- ARV discount +7.5/15.0
- 1% rule +6.6/10.0
- Schools +3.0/10.0
- Livability +2.8/5.0
- Rent growth +2.5/5.0
- Condition / age +2.5/5.0
$88,000
🖨 Deal sheet 📄 Offer letter ✓ Due diligence
Listing remarks
Walk in and immediately feel at home in this inviting bungalow with 17' living room graced with XL east-facing front windows. The kitchen is a wonderful mix of charm and function, and take note of the generous size of the bedrooms. Savvy shoppers will appreciate the low maintenance vinyl siding, metal roof, thermal vinyl windows, updated power box and central heat/air. The 32' x 8' deck invites lounging, and measuring in at 100' x 190' the large, partially fenced yard offers great outdoor space. 20' x 18' carport and lawn storage building convey. Conveniently located close to local schools and downtown amenities, this one is an opportunity for all. .. .first-time home buyers and down-sizer
Key facts
- Metal roof
- Updated power box
- Deck
Tags
Neighborhood map
What this means for you Summary
Snapshot
- This is a 3-bed/1.0-bath other listed at $88k.
Deal economics
- At list price, monthly cash flow is $285 ($3k/yr) — positive.
- The deal already cash-flows at list — no discount required.
- Meets the 1% rule at list price ($1k rent vs $88k).
- Recommended offer: $85k (3.0% below list) — sets the bar for market timing.
Location & tenants
- Location reads 56/100 on livability (#696 in MO) — a working-class tenant base; expect higher turnover. Strengths: cost of living A+, housing B+; Watch: crime F, amenities F, commute F.
- Golden City R-III (rural): math 30% / reading 35% proficiency, ranked #435 of 535 in MO (top 81%) — families likely to look elsewhere, expect single-tenant / working-renter base with shorter leases.
- Zoned schools: Golden City Elem. (math 24% / reading 44%, grade F, #676 of 1,115 statewide, top 66%, 71 students, 75% FRL) — zoned schools average 75% FRL vs 54% district-wide (20 pts higher); higher-poverty schools than district average — tighter screening recommended.
- Market conditions: 23 active listings in the ZIP; 6 units permitted in Barton County in 2024 (0 in 5+ unit buildings).
Forward outlook
- In year one you build about $8k of equity ($608 loan paydown + $7k appreciation (8.4% local appreciation)).
- Barton County population projected at -21% by 2050 — secular population decline; favor cash flow + early exit over multi-decade hold.
- At projected returns (8.4% appreciation + 3.0% rent growth), your $25k cash investment doubles in ~3 years — after that, you're playing with house money.
- By year 5, paydown + projected appreciation supports a ~$36k cash-out refi (75% LTV) — recoverable capital for the next deal without selling this one.
Negotiation context
- It's been on market 49 days — a 3% lower offer ($85k) is reasonable based on typical stale-listing flexibility.
Risks & watch-outs
- Watch-outs: built in 1955 — expect roof / HVAC / electrical / plumbing capex.
- Climate carrying-cost: extreme-heat days projected 7→19/yr by 2055 (HVAC capex compounding) — expect insurance premiums to compound above CPI over the hold.
Questions for the listing agent
- It's been on market 49 days. Have you received any prior offers? Is the seller open to a 3% concession, seller financing, or rate buy-down credit?
- Built in 1955 — when were the roof, HVAC, electrical panel, plumbing, and water heater last replaced?
- Is there a deadline driving the sale (1031 exchange, divorce, estate, relocation)? That informs how much negotiation room exists.
- Schools are F-rated, which usually means shorter tenancies and higher turnover. Who's the typical renter profile here, and what's been the actual vacancy rate?
- Crime grade is F in this area — have there been break-ins, vandalism, or insurance claims at this property in the last 3 years? What carrier currently insures it and at what premium?
- What's the average days-on-market for RENTAL listings here right now (not sales)? A rising rental-DOM trend means longer vacancies and softer asking-rent achievability than the comps imply.
- What's the recent tenant-quality profile in this submarket — average credit score on applications, eviction rate, late-payment / NSF rate, and stable-employment percentage? A property-management company in the area should have these aggregated.
- How much new for-sale + rental construction is in the pipeline within 1–3 miles? Heavy new supply typically softens prices + rents 12–24 months out; constrained supply supports both.
Investment metrics
- 1% rule
- 1.16% ✓
- Cap rate
- 10.18%
- Cash-on-cash
- 13.89%
- DSCR
- 1.62
- GRM
- 7.2
CMA / ARV
No comps found within radius.
Projected returns pro-forma
8.37% appreciation · 3.0% rent growth · sell at horizon
- IRR
- 31.5%
- Equity multiple
- 3.29×
- Total profit
- $56,486
- Equity at exit
- $69,101
- IRR
- 27.9%
- Equity multiple
- 7.11×
- Total profit
- $150,448
- Equity at exit
- $139,363
Cash invested: $24,640 (down + closing). Projections, not guarantees.
Landlord ↔ Tenant lean methodology
- Overall (STATE)
- 81 Strongly Landlord-Friendly
- State Missouri
- 81 Strongly Landlord-Friendly · R+10
- County
- — inherits STATE
- City
- — inherits STATE
ZIP-level market 64748
- Home prices YoY
- 5.7%
- Active inventory
- 23
- Price-to-rent
- 7.2×
Monthly cashflow live
- Estimated rent
- $1,021 medium interval (Pro) →
- Mortgage (P&I)
- −$461
- Tax from tax record
- −$23 /mo · $278/yr
- Insurance
- −$37
- HOA
- −$0
- Vacancy / Maint / Mgmt
- −$214
- Net cashflow
- $285
Break-even live
UW: 25.0% down · 7.5% · 30yr · 1.5% tax · 5.0% vac · 8.0% maint · 8.0% mgmt
Financing live
Cash to close
- Down payment
- $22,000
- Closing costs
- $2,640
- Reserves months
- —
- Total cash needed
- —
Loan-product check · same deal, 3 products live
Conventional
25% down · 7.5% · 30yr
- Down + closing
- —
- Monthly P&I
- —
- Monthly cashflow
- —
- DSCR
- —
- Eligible?
- —
Personal DTI + credit; lowest rate.
DSCR
20% down · 8.5% · 30yr
- Down + closing
- —
- Monthly P&I
- —
- Monthly cashflow
- —
- DSCR
- —
- Eligible?
- —
No personal income docs; deal must DSCR.
Hard money
10% down · 12.0% · 12mo
- Down + closing
- —
- Monthly P&I
- —
- Monthly cashflow
- —
- DSCR
- —
- Eligible?
- —
Short-term bridge; refi at stabilization.
Listing history 3 events
-
2026-04-17status Pending
-
2026-03-23price $88,000
-
2026-02-27$93,000 Active
ⓘ Source: listings_history table (triggers on properties + properties_extension) + one-shot
backfill from property_details.listing_events for pre-trigger history.
Tax reassessment forecast MO · Resets to sale price
- Current annual tax
- $278 · $23/mo
- Projected year-2 tax
- $854 · $71/mo
- Expected delta
- +$575/yr (+$48/mo · 206.5%)
ⓘ Screening estimate from a state-policy table — verify with the county assessor before closing.
Climate risk First Street
- Flood 1/10 Low FEMA zone X (unshaded) · 0% chance over 30 yrs
- Wildfire 1/10 Low
- Heat 5/10 Major 7 d/yr ≥107°F today · 19 d/yr by 30 yrs out
- Wind 2/10 Low 2% chance of damaging wind over 30 yrs
- Air quality 2/10 Low 1 unhealthy d/yr today · 1 by 30 yrs out
Nearby sold comps map
Loading sold comps map…
Walkable amenities ~0.75 mi
Loading nearby amenities…
Taxation est. · year 1
- Rental income
- $12,251
- − Mortgage interest
- −$4,929
- − Property taxes
- −$278
- − Insurance
- −$440
- − Repairs & maintenance
- −$980
- − Management
- −$980
- − Depreciation
- −$2,560
- Taxable income
- $2,083
- Est. tax owed @ 24.0%
- −$500
- After-tax cash flow
- $2,922/yr
For passive investors: Depreciation is non-cash, so a rental often shows a tax loss while cash-flowing — sheltering income. Rental losses are passive: they offset passive income freely, and up to $25,000/yr can offset ordinary (W-2) income if you actively participate and your MAGI is under $100k (phasing out to $0 by $150k); unused losses carry forward. On sale, claimed depreciation is recaptured at up to 25%, and gains may owe capital-gains tax (a 1031 exchange can defer both). Figures are a year-1 estimate at your 24.0% rate — not tax advice; consult a CPA.
Schools (NCES district)
- District
- Golden City R-III
- NCES district ID
- 2912930
- Math proficiency
- 30% ▼ -5.00%
- Reading proficiency
- 35% ▼ -10.00%
- Median HH income
- $36,261
- Composite
- 29.69/100
- National rank
- #11740
- State rank
- #435 of 535 in MO
Livability — Golden City
- Score
- 56/100
- State rank
- #696
- US rank
- #22723
Category grades
Schools grade is shown separately in the Schools card above.
Census & demographics
- Census place
- Golden City, MO
- Population (ZIP)
- 1,270
Population outlook (Barton County) Hauer SSP2
- Today (2025)
- 10,977 people
- By 2030
- 10,496 · -4.4%
- By 2040
- 9,537 · -13.1%
- By 2050
- 8,668 · -21.0%
- By 2075
- 7,557 · -31.2%
- By 2100
- 6,921 · -36.9%
Race, ethnicity, and origin ACS 2023
- Neighborhood character
- Predominantly White (93%)
- Race & ethnicity
- White 93% Two or more races 6% Hispanic / Latino 2%
- Common ancestry
- Lithuanian 3% Slovak 3% Scottish 2%
- Foreign-born
- 1%
- Languages at home
- 99% English-only · Chinese 1%
Political lean MEDSL · Barton
- 2024 margin
- Solid R (+72.2) · D 13.6% · R 85.8%
- 2008→2024 swing
- -22.4pp toward R · 2008: -49.8pp · 2024: -72.2pp
- All cycles
- 2024: R+72.2 2020: R+71.2 2016: R+70.2 2012: R+55.4 2008: R+49.8
Not yet ingested
- Civics
- —
Market trends
- HPI YoY
- ▲ 8.37%
- Current HPI
- 154.6946
- Rent YoY
- —
- Metro
- —
- State GDP YoY
- ▲ 1.84%
- F500 in state
- 20
Industry mix (Fortune 500 HQ in MO)
| Industry | F500 HQs | Revenue |
|---|---|---|
| Healthcare | 1 | $163B |
|
||
| Insurance | 1 | $21B |
|
||
| Industrial Technology | 1 | $17B |
|
||
| Retail | 1 | $16B |
|
||
| Industrial Distribution | 1 | $10B |
|
||
| Utilities | 1 | $9B |
|
||
Price history
-5.4% since first listed3 events — show timeline
- 2026-04-17 Pending — OGAR
- 2026-03-23 Price Changed $88,000 OGAR
- 2026-02-27 Listed $93,000 OGAR
Property tax history
+0.5%/yrLatest (2025): $278 · +13.1% YoY. Source: county tax records.
Cash-flow waterfall
monthlySold comps — $/sqft
last 12 mo · ≤1 miLoading sold comps…