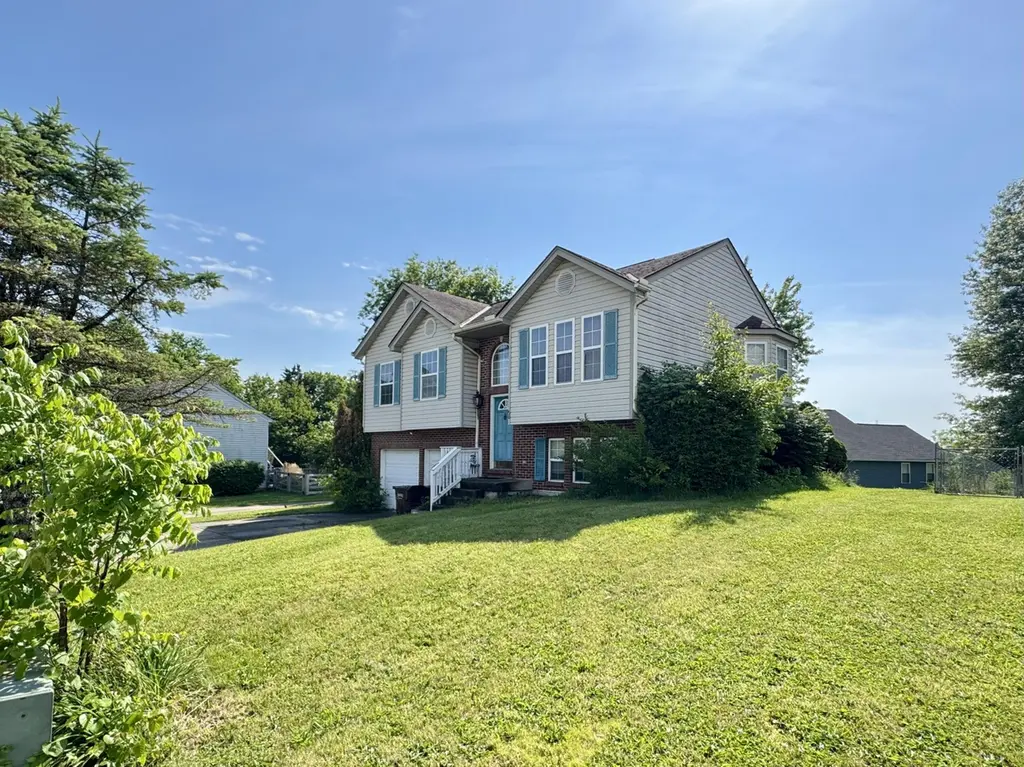
50 Pine Top Dr · Walton, KY
Flood risk 1/10 · Minimal
- FEMA flood zone
- X (unshaded)
- Chance of flooding over 30 yrs
- 0.0%
- Est. flood insurance / yr
- $473 – $860
Fire risk 2/10 · Minimal
- Est. fire insurance / yr
- $839 – $1,559
Heat risk 4/10 · Minor
- Hot days now (above 102°F)
- 7 days/yr
- Hot days in 30 yrs
- 19 days/yr
Wind risk 2/10 · Minimal
- Chance of severe wind over 30 yrs
- 1.0%
Air-quality risk 3/10 · Minor
- Unhealthy air days now
- 2 days/yr
- Unhealthy air days in 30 yrs
- 4 days/yr
Risk factors via First Street. Map © Google.
Why this score? — see what drove the F grade
The composite is a weighted blend of 9 inputs, each scored 0–100. Each bar is that input's sub-score; the figure is the points it added to the 100-point composite (weight × sub-score).
- Cash flow +7.6/30.0
- ARV discount +5.0/15.0
- Schools +3.8/10.0
- Livability +3.7/5.0
- Rent growth +2.5/5.0
- Condition / age +2.5/5.0
- DSCR +1.7/10.0
- 1% rule +1.5/10.0
- Appreciation +0.0/10.0
$265,000
🖨 Deal sheet 📄 Offer letter ✓ Due diligence
Listing remarks MLS
Immaculate 3 bedroom home,2 1/2 baths,oversized 2 car gar,nicely landscaped level fenced yard,neutral decor,cathedral ceilings, plant ledges,upgraded newer carpet and vinyl,eat-in kitchen w/ pantry,bay window,& oak cabinets,computer nook
Key facts
- Walkout to rear deck
- Open floorplan
- Cathedral ceilings
Tags
Property features AI
Exterior
- Parking: Driveway; Garage faces front; Attached 2-car garage
- Utilities: Public water; Public sewer; Underground utilities
- Home design: Single family residence; Bi-level layout; Built in 1994; Has a view
- Construction: Brick and vinyl siding exterior; Shingle composition roof; Poured concrete foundation
- Exterior features: Deck; Private yard; Level and wooded lot; Double-hung windows with vinyl frames
Interior
- Kitchen: Oak cabinetry; Window over sink; Stainless steel appliances; Electric oven and electric range; Dishwasher; Refrigerator; Chandelier and track lighting in kitchen area
- Bedrooms: Primary bedroom with ceiling fan and light; Bedroom 2 with overhead lighting; Bedroom 3 with ceiling fan and light
- Flooring: Hardwood parquet entry; Vinyl flooring in secondary bathrooms
- Bathrooms: Two full bathrooms; One half bathroom; Primary bath with oak vanity and medicine cabinet; Additional baths with oak vanity, medicine cabinet, and vinyl flooring
- Heating & cooling: Electric heating; Central air conditioning
- Interior features: Walk-in closets; Track lighting; Pantry; Open floor plan; Entrance foyer; Eat-in kitchen; Chandelier; Cathedral and vaulted ceilings; Ceiling fans; High ceilings
- Laundry & utility: Dedicated laundry room
Neighborhood map
What this means for you Summary
Snapshot
- This is a 3-bed/2.5-bath single-family listed at $265k.
Deal economics
- At list price, monthly cash flow is $-321 ($-4k/yr) — negative.
- To cash-flow at today's rent, offer at most $208k (21.4% below list).
- To meet the 1% rule (rent ≥ 1% of price), the offer needs to be $172k (35.3% below list).
- Recommended offer: $172k (35.3% below list) — sets the bar for 1% rule.
- Cap rate 4.8% vs local median 2.8% in Walton — top-decile yield for the area; either an underpriced asset or a hidden risk that comps aren't pricing in. Stress-test before assuming the spread holds.
Location & tenants
- Location reads 73/100 on livability (#115 in KY, #4,981 nationally) — a middle-class / working-renter tenant base. Strengths: crime A+, cost of living A+, housing A+; Watch: amenities F, commute F, health & safety F.
- Walton-Verona Independent (rural): math 37% / reading 48% proficiency, ranked #23 of 165 in KY (top 14%) — families likely to look elsewhere, expect single-tenant / working-renter base with shorter leases.
- Zoned schools: Walton-Verona Elementary School (math 52% / reading 48%, grade D+, #98 of 676 statewide, top 15%, 734 students, 38% FRL); Walton-Verona Middle School (math 31% / reading 49%, grade F, #59 of 217 statewide, top 29%, 547 students, 34% FRL); Walton-Verona High School (math 37% / reading 42%, grade F, #40 of 254 statewide, top 19%, 549 students, 30% FRL) — zoned schools at 34% FRL track the district average.
- Market conditions: 179 active listings in the ZIP; 2 comparable units currently listed for rent nearby; 1,430 units permitted in Boone County in 2024 (928 in 5+ unit buildings).
Forward outlook
- Local home prices are declining (-3.0%/yr); year-one equity from $2k of loan paydown is wiped out by about $8k of value loss. Plan a longer hold.
- Boone County population projected at +24% by 2050 — long-run rental-demand tailwind backs the buy-and-hold thesis.
Negotiation context
- Only 4 days on market — expect competitive offers; lowballing is unlikely to land.
- 3 sale attempts since 26y ago with the ask held roughly flat each time — persistent listings suggest the price (not the market) is what's stuck; bring a comps-based counter.
- Current owner paid $126k; list at $265k implies a 110% gain — meaningful room to come down on a strong offer.
Questions for the listing agent
- What do current leases actually rent for vs. the listed asking? Can we see a recent rent roll and the last 12 months of T-12 income?
- Is there a deadline driving the sale (1031 exchange, divorce, estate, relocation)? That informs how much negotiation room exists.
- Schools are B-rated — typically a magnet for longer-tenancy family renters. What's the average tenant stay here, and is there a school-zone premium baked into asking?
- The area grade is low — what's the realistic commute time and amenity access for the typical tenant pool here? Any planned neighborhood developments (good or bad) we should know about?
- What's the average days-on-market for RENTAL listings here right now (not sales)? A rising rental-DOM trend means longer vacancies and softer asking-rent achievability than the comps imply.
- What's the recent tenant-quality profile in this submarket — average credit score on applications, eviction rate, late-payment / NSF rate, and stable-employment percentage? A property-management company in the area should have these aggregated.
- How much new for-sale + rental construction is in the pipeline within 1–3 miles? Heavy new supply typically softens prices + rents 12–24 months out; constrained supply supports both.
Investment metrics
- 1% rule
- 0.65% ✗
- Cap rate
- 4.84%
- Cash-on-cash
- -5.19%
- DSCR
- 0.77
- GRM
- 12.9
CMA / ARV
- ARV (on-the-fly)
- $250,832
- Comps found
- 12
Show comp detail 12 sales within ~0.75 mi
| Address | Dist | Beds/Ba | Sqft | Sold | Price | $/sf | Match |
|---|---|---|---|---|---|---|---|
| 32 Pine Top Dr | 0.03mi | 3/2.0 | 1,006 (-2%) | 3mo | $245,000 | $244 | 91 |
| 12024 Rachel Ann Dr | 0.26mi | 3/2.5 | 1,050 (+2%) | 2mo | $315,000 | $300 | 82 |
| 31 Bedinger Ave | 0.15mi | 2/1.5 (-1) | 1,008 (-2%) | 11mo | $160,000 | $159 | 72 |
| 582 Summer Pointe Dr | 0.55mi | 3/2.0 | 1,040 (+1%) | 1mo | $200,000 | $192 | 69 |
| 39 High School Ct | 0.34mi | 3/1.0 | 1,040 (+1%) | 8mo | $260,350 | $250 | 69 |
| 12487 Sheppard Way | 0.49mi | 3/2.0 | 974 (-5%) | 7mo | $269,900 | $277 | 60 |
| 38 Old Stephenson Mill Rd | 0.65mi | 3/2.0 | 1,066 (+4%) | 4mo | $267,000 | $250 | 58 |
| 75 Alta Vista Dr | 0.52mi | 3/1.0 | 1,100 (+7%) | 10mo | $220,000 | $200 | 50 |
| 581 Summer Pointe Dr | 0.58mi | 3/2.0 | 904 (-12%) | 2mo | $200,000 | $221 | 49 |
| 76 Alta Vista Dr | 0.54mi | 2/1.0 (-1) | 1,132 (+10%) | 7mo | $190,000 | $168 | 41 |
| 61 Alta Vista Dr | 0.49mi | 2/1.0 (-1) | 904 (-12%) | 9mo | $85,000 | $94 | 38 |
| 605 Summer Pointe Dr | 0.55mi | 2/2.0 (-1) | 904 (-12%) | 12mo | $252,000 | $279 | 38 |
Match score weights: distance 35% · size 25% · config 20% · recency 20%. Top-matched comps best support the ARV.
Projected returns pro-forma
-3.0% appreciation · 3.0% rent growth · sell at horizon
- IRR
- -25.2%
- Equity multiple
- 0.14×
- Total profit
- $-63,455
- Equity at exit
- $39,512
- IRR
- -21.4%
- Equity multiple
- -0.10×
- Total profit
- $-81,862
- Equity at exit
- $22,912
Cash invested: $74,200 (down + closing). Projections, not guarantees.
Landlord ↔ Tenant lean methodology
- Overall (STATE)
- 83 Strongly Landlord-Friendly
- State Kentucky
- 83 Strongly Landlord-Friendly · R+16
- County
- — inherits STATE
- City
- — inherits STATE
ZIP-level market 41094
- Home prices YoY
- -28.1%
- Active inventory
- 179
- Price-to-rent
- 12.9×
Monthly cashflow live
- Estimated rent
- $1,716 medium interval (Pro) →
- Mortgage (P&I)
- −$1,390
- Tax from tax record
- −$176 /mo · $2,115/yr
- Insurance
- −$110
- HOA
- −$0
- Vacancy / Maint / Mgmt
- −$360
- Net cashflow
- $-321
Break-even live
UW: 25.0% down · 7.5% · 30yr · 1.5% tax · 5.0% vac · 8.0% maint · 8.0% mgmt
Financing live
Cash to close
- Down payment
- $66,250
- Closing costs
- $7,950
- Reserves months
- —
- Total cash needed
- —
Loan-product check · same deal, 3 products live
Conventional
25% down · 7.5% · 30yr
- Down + closing
- —
- Monthly P&I
- —
- Monthly cashflow
- —
- DSCR
- —
- Eligible?
- —
Personal DTI + credit; lowest rate.
DSCR
20% down · 8.5% · 30yr
- Down + closing
- —
- Monthly P&I
- —
- Monthly cashflow
- —
- DSCR
- —
- Eligible?
- —
No personal income docs; deal must DSCR.
Hard money
10% down · 12.0% · 12mo
- Down + closing
- —
- Monthly P&I
- —
- Monthly cashflow
- —
- DSCR
- —
- Eligible?
- —
Short-term bridge; refi at stabilization.
Rent comps 2 comps
| Address | Beds | Baths | Sqft | Rent | $/sqft | DOM | Units | Dist |
|---|---|---|---|---|---|---|---|---|
| 734 Crescent Lndg Unit 1-304 Walton, KY | 3.0 | 2.0 | 1500 | $2,500 | $1.67 | 23d | 1 | 1.22mi |
| 12800 Towne Center Dr Walton, KY | 2.0 | 1.0 | 880 | $1,076 | $1.22 | 11d | 1 | 1.24mi |
Listing history 9 events
-
2026-05-22status Pending
-
2026-05-18$265,000 Active
-
2004-04-26soldstatus $126,000
-
2004-04-22soldstatus $126,000 241-char remark
Show marketing remark (241 chars)
Immaculate 3 bedroom home,2 1/2 baths,oversized 2 car gar,nicely landscaped level fenced yard,neutral decor,cathedral ceilings, plant ledges,upgraded newer carpet and vinyl,eat-in kitchen w/ pantry,bay window,& oak cabinets,computer nook
-
2004-03-06$129,900 241-char remark
Show marketing remark (241 chars)
Immaculate 3 bedroom home,2 1/2 baths,oversized 2 car gar,nicely landscaped level fenced yard,neutral decor,cathedral ceilings, plant ledges,upgraded newer carpet and vinyl,eat-in kitchen w/ pantry,bay window,& oak cabinets,computer nook
-
2001-01-17soldstatus $103,000
-
2001-01-11soldstatus $103,000 208-char remark
Show marketing remark (208 chars)
Attractive Hartberger Built Home Large Country Kitchen With Bay Window Triple Gable Roof For Added Curb Appeal Immediate Occupancy At Closing Special Addendum Must Accompany Contract In An Area Of Newer Homes
-
2000-04-06$106,900 208-char remark
Show marketing remark (208 chars)
Attractive Hartberger Built Home Large Country Kitchen With Bay Window Triple Gable Roof For Added Curb Appeal Immediate Occupancy At Closing Special Addendum Must Accompany Contract In An Area Of Newer Homes
-
1994-09-29soldstatus $89,500
ⓘ Source: listings_history table (triggers on properties + properties_extension) + one-shot
backfill from property_details.listing_events for pre-trigger history.
Tax reassessment forecast KY · Resets to sale price
- Current annual tax
- $2,115 · $176/mo
- Projected year-2 tax
- $2,279 · $190/mo
- Expected delta
- +$164/yr (+$14/mo · 7.8%)
ⓘ Screening estimate from a state-policy table — verify with the county assessor before closing.
Climate risk First Street
- Flood 1/10 Low FEMA zone X (unshaded) · 0% chance over 30 yrs
- Wildfire 2/10 Low
- Heat 4/10 Moderate 7 d/yr ≥102°F today · 19 d/yr by 30 yrs out
- Wind 2/10 Low 100% chance of damaging wind over 30 yrs
- Air quality 3/10 Moderate 2 unhealthy d/yr today · 4 by 30 yrs out
Nearby sold comps map
Loading sold comps map…
Walkable amenities ~0.75 mi
Loading nearby amenities…
Taxation est. · year 1
- Rental income
- $20,587
- − Mortgage interest
- −$14,844
- − Property taxes
- −$2,115
- − Insurance
- −$1,325
- − Repairs & maintenance
- −$1,647
- − Management
- −$1,647
- − Depreciation
- −$7,709
- Taxable loss
- −$8,699
- Est. tax savings @ 24.0%
- +$2,088
- After-tax cash flow
- $-1,764/yr
For passive investors: Depreciation is non-cash, so a rental often shows a tax loss while cash-flowing — sheltering income. Rental losses are passive: they offset passive income freely, and up to $25,000/yr can offset ordinary (W-2) income if you actively participate and your MAGI is under $100k (phasing out to $0 by $150k); unused losses carry forward. On sale, claimed depreciation is recaptured at up to 25%, and gains may owe capital-gains tax (a 1031 exchange can defer both). Figures are a year-1 estimate at your 24.0% rate — not tax advice; consult a CPA.
Schools (NCES district)
- District
- Walton-Verona Independent
- NCES district ID
- 2105700
- Math proficiency
- 37% ▼ -13.00%
- Reading proficiency
- 48% ▼ -16.00%
- Median HH income
- $62,603
- Composite
- 37.73/100
- National rank
- #4354
- State rank
- #23 of 165 in KY
Livability — Walton
- Score
- 73/100
- State rank
- #115
- US rank
- #4981
Category grades
Schools grade is shown separately in the Schools card above.
Census & demographics
- Census place
- Walton, KY
- Population (ZIP)
- 14,798
Population outlook (Boone County) Hauer SSP2
- Today (2025)
- 144,066 people
- By 2030
- 152,005 · +5.5%
- By 2040
- 166,776 · +15.8%
- By 2050
- 178,974 · +24.2%
- By 2075
- 204,515 · +42.0%
- By 2100
- 215,306 · +49.4%
Race, ethnicity, and origin ACS 2023
- Neighborhood character
- Predominantly White (89%)
- Race & ethnicity
- White 89% Two or more races 5% Hispanic / Latino 4% Pacific Islander 1%
- Common ancestry
- Slovak 1% Iranian 1% Lithuanian 1%
- Foreign-born
- 3% · Canada
- Languages at home
- 94% English-only · Spanish 3% Other Asian/Pacific 1% Russian/Polish/Slavic 1%
Political lean MEDSL · Boone
- 2024 margin
- Solid R (+37.2) · D 30.6% · R 67.8% · Other 1.7%
- 2008→2024 swing
- -2.7pp toward R · 2008: -34.5pp · 2024: -37.2pp
- All cycles
- 2024: R+37.2 2020: R+35.7 2016: R+41.8 2012: R+38.7 2008: R+34.5
Not yet ingested
- Civics
- —
Market trends
- HPI YoY
- ▼ -88.84%
- Current HPI
- 227.3544
- Rent YoY
- —
- Metro
- —
- State GDP YoY
- ▲ 1.81%
- F500 in state
- 4
Industry mix (Fortune 500 HQ in KY)
| Industry | F500 HQs | Revenue |
|---|---|---|
| Healthcare | 1 | $118B |
|
||
| Food / Beverage | 1 | $7B |
|
||
Price history
+196.1% since first listed9 events — show timeline
- 2026-05-22 Pending — NKMLS
- 2026-05-18 Listed $265,000 NKMLS
- 2004-04-26 Sold (Public Records) $126,000 Public Records
- 2004-04-22 Sold (MLS) $126,000 NKMLS
- 2004-03-06 Listed $129,900 NKMLS
- 2001-01-17 Sold (Public Records) $103,000 Public Records
- 2001-01-11 Sold (MLS) $103,000 NKMLS
- 2000-04-06 Listed $106,900 NKMLS
- 1994-09-29 Sold (Public Records) $89,500 Public Records
Property tax history
+3.5%/yrLatest (2025): $2,115 · +22.5% YoY. Source: county tax records.
Cash-flow waterfall
monthlySold comps — $/sqft
last 12 mo · ≤1 miLoading sold comps…