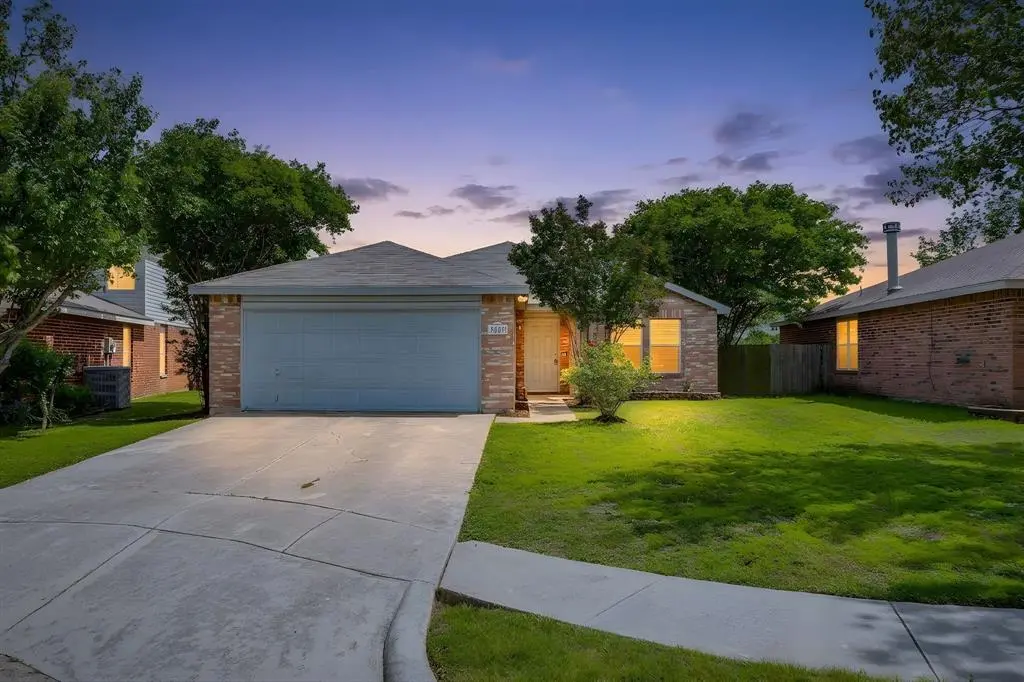
3855 Hunters Point Way · Fort Worth, TX
Flood risk 1/10 · Minimal
- FEMA flood zone
- X (unshaded)
- Chance of flooding over 30 yrs
- 0.0%
- Est. flood insurance / yr
- $507 – $1,088
Fire risk 5/10 · Moderate
- Est. fire insurance / yr
- $1,222 – $2,270
Heat risk 7/10 · Major
- Hot days now (above 108°F)
- 7 days/yr
- Hot days in 30 yrs
- 22 days/yr
Wind risk 6/10 · Moderate
- Chance of severe wind over 30 yrs
- 27.0%
Air-quality risk 3/10 · Minor
- Unhealthy air days now
- 2 days/yr
- Unhealthy air days in 30 yrs
- 3 days/yr
Risk factors via First Street. Map © Google.
Why this score? — see what drove the D grade
The composite is a weighted blend of 9 inputs, each scored 0–100. Each bar is that input's sub-score; the figure is the points it added to the 100-point composite (weight × sub-score).
- Cash flow +12.6/30.0
- ARV discount +9.7/15.0
- 1% rule +4.4/10.0
- Livability +4.0/5.0
- DSCR +3.8/10.0
- Rent growth +2.8/5.0
- Schools +2.5/10.0
- Condition / age +2.5/5.0
- Appreciation +0.0/10.0
$229,990
🖨 Deal sheet 📄 Offer letter ✓ Due diligence
Listing remarks MLS
Located in a quiet subdivision this 3 bed 2 bath home has many desirable features. As you walk in the front door you are greeted by the inviting formal dinning room. The open floor plan of the kitchen and living room provide for an excellent entertaining area. The property backs up to a large park with a play ground and jogging trails. The subdivision maintains a community pool area that is great during the summer months!
Key facts
- Generous cabinetry
- Formal dining room
- Brick fireplace
Tags
Property features AI
Finance
- Financial info: Acceptable financing: Cash, Conventional, FHA, VA
- HOA & community: Mandatory HOA (Fox Run HOA); Monthly HOA fee of $30; HOA covers full use of facilities and management fees; Community amenities: pool, jogging/bike path, park, playground, sidewalks
Exterior
- Parking: Attached 2-car garage with garage door opener; Covered parking for 2 vehicles; Driveway; Garage faces front
- Security: Burglar alarm; Security system; Smoke detectors; Carbon monoxide detector(s)
- Utilities: City water; City sewer; Individual water meter; Underground utilities
- Home design: Single-family residence; One-story; Not attached to another property
- Construction: Built in 1998; Brick and wood construction; Composition roof; Slab foundation
- Exterior features: Front porch; Patio; Wood backyard fence with gate; Landscaped yard with few trees; Large backyard with grass; Interior lot; Park view; Subdivision setting
Interior
- Kitchen: Dishwasher; Disposal; Electric range; Vented exhaust fan; Built-in cabinets; Pantry
- Bedrooms: 3 bedrooms (all on the main level); Primary bedroom with ensuite bathroom and walk-in closet
- Flooring: Carpet; Laminate
- Bathrooms: 2 full bathrooms
- Heating & cooling: Central heating; Electric heating; Fireplace(s) for supplemental heat; Central air; Electric cooling; Ceiling fans
- Interior features: Open floorplan; Pantry; Cable TV available; Window coverings
- Laundry & utility: Full-size washer/dryer area; Electric dryer hookup; Separate utility room
Neighborhood map
What this means for you Summary
Snapshot
- This is a 3-bed/2.0-bath single-family listed at $230k.
Deal economics
- At list price, monthly cash flow is $-28 ($-330/yr) — negative.
- To cash-flow at today's rent, offer at most $225k (2.1% below list).
- To meet the 1% rule (rent ≥ 1% of price), the offer needs to be $216k (6.2% below list).
- Recommended offer: $216k (6.2% below list) — sets the bar for 1% rule.
- Cap rate 6.1% vs local median 3.9% in Fort Worth — top-decile yield for the area; either an underpriced asset or a hidden risk that comps aren't pricing in. Stress-test before assuming the spread holds.
Location & tenants
- Location reads 80/100 on livability (#49 in TX, #1,954 nationally) — a professional / high-income tenant draw. Strengths: amenities A+, cost of living A+, housing A+; Watch: crime F.
- Crowley ISD (urban): math 23% / reading 32% proficiency, ranked #643 of 826 in TX (top 78%) — low school quality limits family demand, transient renter base, plan for 1-2y turnover.
- Zoned schools: Jackie Carden El (math 24% / reading 34%, grade F, #2,668 of 4,322 statewide, top 63%, 533 students, 84% FRL) — zoned schools average 84% FRL vs 52% district-wide (32 pts higher); higher-poverty schools than district average — tighter screening recommended.
- Market conditions: Rents rising (+1.1%/yr); 364 active listings in the ZIP; 40 comparable units currently listed for rent nearby; rentals at typical pace (median 25d on market — plan ~3-4 weeks tenant-placement turnaround); solid renter incomes; 18,938 units permitted in Tarrant County in 2024 (8,336 in 5+ unit buildings).
Forward outlook
- Local home prices are declining (-3.0%/yr); year-one equity from $2k of loan paydown is wiped out by about $7k of value loss. Plan a longer hold.
- Tarrant County population projected at +41% by 2050 — long-run rental-demand tailwind backs the buy-and-hold thesis.
Negotiation context
- It's been on market 21 days — a 2% lower offer ($227k) is reasonable based on typical stale-listing flexibility.
- 3 sale attempts since 16y ago with the ask held roughly flat each time — persistent listings suggest the price (not the market) is what's stuck; bring a comps-based counter.
Risks & watch-outs
- Climate carrying-cost: major wind risk, 27% chance of damaging wind over 30y; moderate wildfire risk; extreme-heat days projected 7→22/yr by 2055 (HVAC capex compounding) — expect insurance premiums to compound above CPI over the hold.
Questions for the listing agent
- What do current leases actually rent for vs. the listed asking? Can we see a recent rent roll and the last 12 months of T-12 income?
- What does the HOA fee cover, when was the last increase, and are there any pending special assessments or reserve-fund shortfalls?
- Is there a deadline driving the sale (1031 exchange, divorce, estate, relocation)? That informs how much negotiation room exists.
- Schools are D-rated, which usually means shorter tenancies and higher turnover. Who's the typical renter profile here, and what's been the actual vacancy rate?
- Crime grade is F in this area — have there been break-ins, vandalism, or insurance claims at this property in the last 3 years? What carrier currently insures it and at what premium?
- The area grade is low — what's the realistic commute time and amenity access for the typical tenant pool here? Any planned neighborhood developments (good or bad) we should know about?
- What's the average days-on-market for RENTAL listings here right now (not sales)? A rising rental-DOM trend means longer vacancies and softer asking-rent achievability than the comps imply.
- What's the recent tenant-quality profile in this submarket — average credit score on applications, eviction rate, late-payment / NSF rate, and stable-employment percentage? A property-management company in the area should have these aggregated.
- How much new for-sale + rental construction is in the pipeline within 1–3 miles? Heavy new supply typically softens prices + rents 12–24 months out; constrained supply supports both.
Investment metrics
- 1% rule
- 0.94% ✗
- Cap rate
- 6.15%
- Cash-on-cash
- -0.51%
- DSCR
- 0.98
- GRM
- 8.9
CMA / ARV
- ARV (on-the-fly)
- $241,824
- Comps found
- 12
Show comp detail 12 sales within ~0.75 mi
| Address | Dist | Beds/Ba | Sqft | Sold | Price | $/sf | Match |
|---|---|---|---|---|---|---|---|
| 8720 Hunters Point Way | 0.10mi | 3/2.0 | 1,507 (+10%) | 2mo | $260,000 | $173 | 78 |
| 3625 Garden Springs Dr | 0.40mi | 3/2.0 | 1,345 (-2%) | 6mo | $225,000 | $167 | 72 |
| 3921 Fox Run Dr | 0.18mi | 3/2.0 | 1,511 (+10%) | 7mo | $250,000 | $165 | 69 |
| 9400 Simbra Ln | 0.60mi | 3/2.0 | 1,402 (+2%) | 3mo | $460,000 | $328 | 66 |
| 9016 Troy Dr | 0.58mi | 3/2.0 | 1,393 (+1%) | 11mo | $240,000 | $172 | 62 |
| 8509 Delta Way | 0.73mi | 4/2.0 (+1) | 1,357 (-1%) | 1mo | $240,000 | $177 | 58 |
| 8505 Tallahassee Ln | 0.64mi | 3/2.0 | 1,281 (-7%) | 1mo | $225,000 | $176 | 58 |
| 8732 Polo Dr | 0.34mi | 4/2.0 (+1) | 1,497 (+9%) | 9mo | $270,000 | $180 | 57 |
| 3305 Plantation Ln | 0.68mi | 3/2.0 | 1,415 (+3%) | 8mo | $254,000 | $180 | 57 |
| 4245 Gray Fox Dr | 0.57mi | 3/2.0 | 1,518 (+10%) | 3mo | $245,000 | $161 | 54 |
| 8040 Clear Brook Cir | 0.71mi | 3/2.0 | 1,511 (+10%) | 1mo | $255,000 | $169 | 50 |
| 3137 Guyana Rd | 0.69mi | 3/2.0 | 1,539 (+12%) | 3mo | $285,000 | $185 | 45 |
Match score weights: distance 35% · size 25% · config 20% · recency 20%. Top-matched comps best support the ARV.
Projected returns pro-forma
-3.0% appreciation · 1.07% rent growth · sell at horizon
- IRR
- -19.5%
- Equity multiple
- 0.33×
- Total profit
- $-43,014
- Equity at exit
- $34,292
- IRR
- -17.2%
- Equity multiple
- 0.14×
- Total profit
- $-55,456
- Equity at exit
- $19,885
Cash invested: $64,397 (down + closing). Projections, not guarantees.
Landlord ↔ Tenant lean methodology
- Overall (STATE)
- 87 Strongly Landlord-Friendly
- State Texas
- 87 Strongly Landlord-Friendly · R+5
- County
- — inherits STATE
- City
- — inherits STATE
ZIP-level market 76123
- Home prices YoY
- -17.9%
- Rents YoY
- 1.1%
- Active inventory
- 364
- Price-to-rent
- 8.9×
Monthly cashflow live
- Estimated rent
- $2,158 high interval (Pro) →
- Mortgage (P&I)
- −$1,206
- Tax from tax record
- −$401 /mo · $4,806/yr
- Insurance
- −$96
- HOA
- −$30
- Vacancy / Maint / Mgmt
- −$453
- Net cashflow
- $-28
Break-even live
UW: 25.0% down · 7.5% · 30yr · 1.5% tax · 5.0% vac · 8.0% maint · 8.0% mgmt
Financing live
Cash to close
- Down payment
- $57,498
- Closing costs
- $6,900
- Reserves months
- —
- Total cash needed
- —
Loan-product check · same deal, 3 products live
Conventional
25% down · 7.5% · 30yr
- Down + closing
- —
- Monthly P&I
- —
- Monthly cashflow
- —
- DSCR
- —
- Eligible?
- —
Personal DTI + credit; lowest rate.
DSCR
20% down · 8.5% · 30yr
- Down + closing
- —
- Monthly P&I
- —
- Monthly cashflow
- —
- DSCR
- —
- Eligible?
- —
No personal income docs; deal must DSCR.
Hard money
10% down · 12.0% · 12mo
- Down + closing
- —
- Monthly P&I
- —
- Monthly cashflow
- —
- DSCR
- —
- Eligible?
- —
Short-term bridge; refi at stabilization.
Rent comps 40 comps
| Address | Beds | Baths | Sqft | Rent | $/sqft | DOM | Units | Dist |
|---|---|---|---|---|---|---|---|---|
| 8738 Texas Risinger Dr Fort Worth, TX | 3.0 | 2.0 | 1028 | $2,299 | $2.24 | 5d | 1 | 0.11mi |
| 8730 Texas Risinger Dr Fort Worth, TX | 3.0 | 2.0 | 1028 | $1,875 | $1.82 | 43d | 1 | 0.13mi |
| 9100 Saint Barts Rd Fort Worth, TX | 4.0 | 2.0 | 1630 | $1,969 | $1.21 | 43d | 1 | 0.29mi |
| 4021 Busch Gardens Dr Fort Worth, TX | 3.0 | 2.0 | 1748 | $1,875 | $1.07 | 20d | 1 | 0.31mi |
| 4021 Busch Gardens Dr Fort Worth, TX | 3.0 | 2.0 | 1748 | $1,875 | $1.07 | 24d | 1 | 0.31mi |
| 3833 Foxhound Ln Fort Worth, TX | 3.0 | 2.0 | 1507 | $1,895 | $1.26 | 18d | 1 | 0.33mi |
| 3990 Sarasota Springs Dr Fort Worth, TX | 3.0 | 2.5 | 1766 | $1,995 | $1.13 | 24d | 1 | 0.40mi |
| 3704 Garden Springs Dr Fort Worth, TX | 3.0 | 2.0 | 1628 | $2,799 | $1.72 | 12d | 1 | 0.40mi |
| 3469 Cayman Dr Fort Worth, TX | 3.0 | 2.0 | 1368 | $1,749 | $1.28 | 43d | 1 | 0.47mi |
| 3408 Saint Vincent Rd Fort Worth, TX | 3.0 | 2.0 | 1400 | $2,195 | $1.57 | 43d | 1 | 0.51mi |
| 4261 Meadowknoll Dr Fort Worth, TX | 3.0 | 2.0 | 1518 | $1,945 | $1.28 | 12d | 1 | 0.54mi |
| 8510 Gatlinburg Dr Fort Worth, TX | 3.0 | 2.0 | 1006 | $1,699 | $1.69 | 24d | 1 | 0.56mi |
| 8517 Gatlinburg Dr Fort Worth, TX | 3.0 | 2.0 | 1006 | $1,900 | $1.89 | 43d | 1 | 0.57mi |
| 9512 Carson Ranch Rd Crowley, TX | 4.0 | 2.0 | 1782 | $2,995 | $1.68 | 22d | 1 | 0.62mi |
| 9157 Abaco Way Fort Worth, TX | 4.0 | 2.0 | 1705 | $2,149 | $1.26 | 43d | 1 | 0.65mi |
| 9157 Abaco Way Fort Worth, TX | 4.0 | 2.0 | 1705 | $2,089 | $1.23 | 24d | 1 | 0.65mi |
| 8525 Auburn Dr Fort Worth, TX | 3.0 | 2.5 | 1463 | $3,229 | $2.21 | 1d | 1 | 0.65mi |
| 3124 Stonewall Ln Fort Worth, TX | 3.0 | 2.0 | 1378 | $1,875 | $1.36 | 5d | 1 | 0.68mi |
| 4013 Winter Springs Dr Fort Worth, TX | 4.0 | 2.0 | 1764 | $3,000 | $1.70 | 43d | 1 | 0.68mi |
| 8505 Delta Way Fort Worth, TX | 3.0 | 2.0 | 1090 | $2,500 | $2.29 | 43d | 1 | 0.71mi |
| 3104 Stonewall Ln Fort Worth, TX | 3.0 | 2.0 | 1112 | $1,783 | $1.60 | 12d | 1 | 0.72mi |
| 8436 Cloverglen Ln Fort Worth, TX | 3.0 | 2.0 | 1166 | $1,825 | $1.57 | 43d | 1 | 0.75mi |
| 8564 Charleston Ave Fort Worth, TX | 3.0 | 2.5 | 1463 | $1,875 | $1.28 | 24d | 1 | 0.76mi |
| 8420 Cloverglen Ln Fort Worth, TX | 3.0 | 2.0 | 1445 | $1,950 | $1.35 | 2d | 1 | 0.77mi |
| 8345 Ohara Ln Fort Worth, TX | 4.0 | 2.0 | 1793 | $1,906 | $1.06 | 43d | 1 | 0.79mi |
| 8328 Ohara Ln Fort Worth, TX | 3.0 | 2.5 | 1826 | $2,145 | $1.17 | 43d | 1 | 0.80mi |
| 8612 Orleans Ln Fort Worth, TX | 3.0 | 2.0 | 1790 | $1,900 | $1.06 | 43d | 1 | 0.80mi |
| 5401 Ranch Ln Fort Worth, TX | 3.0 | 1.0–2.0 | 791 | $2,183 | $2.76 | 3d | 12 | 0.82mi |
| 8300 Auburn Dr Fort Worth, TX | 3.0 | 2.5 | 1857 | $1,895 | $1.02 | 12d | 1 | 0.82mi |
| 3816 Ashley Ln Fort Worth, TX | 3.0 | 2.0 | 1464 | $2,060 | $1.41 | 2d | 1 | 0.84mi |
| 3704 Fairhaven Dr Fort Worth, TX | 3.0 | 2.0 | 1528 | $1,995 | $1.31 | 12d | 1 | 0.89mi |
| 3704 Fairhaven Dr Fort Worth, TX | 3.0 | 2.0 | 1528 | $1,995 | $1.31 | 43d | 1 | 0.89mi |
| 2913 Vicksburg Ln Fort Worth, TX | 3.0 | 2.0 | 1720 | $1,800 | $1.05 | 24d | 1 | 0.91mi |
| 9208 Vineyard Ln Fort Worth, TX | 3.0 | 2.0 | 1792 | $2,300 | $1.28 | 5d | 1 | 0.91mi |
| 2808 Adams Fall Ln Fort Worth, TX | 3.0 | 2.0 | 1545 | $2,100 | $1.36 | 43d | 1 | 0.94mi |
| 8304 Cornerstone Dr Fort Worth, TX | 3.0 | 2.0 | 1776 | $2,300 | $1.30 | 43d | 1 | 0.96mi |
| 4365 Mill Stream Ln Crowley, TX | 4.0 | 2.0 | 1602 | $2,300 | $1.44 | 24d | 1 | 0.96mi |
| 8312 Runner Oak Ln Fort Worth, TX | 3.0 | 2.0 | 1337 | $1,970 | $1.47 | 24d | 1 | 0.98mi |
| 7948 Mosspark Ln Fort Worth, TX | 4.0 | 2.0 | 1809 | $2,360 | $1.30 | 5d | 1 | 0.99mi |
| 2531 Braford Dr Crowley, TX | 2.0 | 2.0 | 1200 | $1,600 | $1.33 | 24d | 1 | 0.99mi |
HOA detail
- Monthly dues
- $30 · $360/yr
- Likely covers
- pool
Listing history 13 events
-
2026-06-04status $229,990 Pending 21 DOM
-
2026-06-03days on market $229,990 Active Option Contract 21 DOM
-
2026-06-02days on market $229,990 Active Option Contract 20 DOM
-
2026-06-01days on market $229,990 Active Option Contract 19 DOM
-
2026-05-31days on market $229,990 Active Option Contract 18 DOM
-
2026-05-19status Active
-
2026-05-16historical Active Option Contract
-
2026-05-13$229,990 Active
-
2010-08-09soldstatus 425-char remark
Show marketing remark (425 chars)
Located in a quiet subdivision this 3 bed 2 bath home has many desirable features. As you walk in the front door you are greeted by the inviting formal dinning room. The open floor plan of the kitchen and living room provide for an excellent entertaining area. The property backs up to a large park with a play ground and jogging trails. The subdivision maintains a community pool area that is great during the summer months!
-
2010-05-21historical 425-char remark
Show marketing remark (425 chars)
Located in a quiet subdivision this 3 bed 2 bath home has many desirable features. As you walk in the front door you are greeted by the inviting formal dinning room. The open floor plan of the kitchen and living room provide for an excellent entertaining area. The property backs up to a large park with a play ground and jogging trails. The subdivision maintains a community pool area that is great during the summer months!
-
2010-03-03$75,550 425-char remark
Show marketing remark (425 chars)
Located in a quiet subdivision this 3 bed 2 bath home has many desirable features. As you walk in the front door you are greeted by the inviting formal dinning room. The open floor plan of the kitchen and living room provide for an excellent entertaining area. The property backs up to a large park with a play ground and jogging trails. The subdivision maintains a community pool area that is great during the summer months!
-
2004-10-04soldstatus
-
1997-01-01soldstatus
ⓘ Source: listings_history table (triggers on properties + properties_extension) + one-shot
backfill from property_details.listing_events for pre-trigger history.
Tax reassessment forecast TX · Resets to sale price
- Current annual tax
- $4,806 · $401/mo
- Projected year-2 tax
- $4,806 · $401/mo
- Expected delta
- $0/yr ($0/mo · 0.0%)
ⓘ Screening estimate from a state-policy table — verify with the county assessor before closing.
Climate risk First Street
- Flood 1/10 Low FEMA zone X (unshaded) · 0% chance over 30 yrs
- Wildfire 5/10 Major
- Heat 7/10 Severe 7 d/yr ≥108°F today · 22 d/yr by 30 yrs out
- Wind 6/10 Major 27% chance of damaging wind over 30 yrs
- Air quality 3/10 Moderate 2 unhealthy d/yr today · 3 by 30 yrs out
Nearby sold comps map
Loading sold comps map…
Walkable amenities ~0.75 mi
Loading nearby amenities…
Taxation est. · year 1
- Rental income
- $25,897
- − Mortgage interest
- −$12,883
- − Property taxes
- −$4,806
- − Insurance
- −$1,150
- − Repairs & maintenance
- −$2,072
- − Management
- −$2,072
- − HOA
- −$360
- − Depreciation
- −$6,691
- Taxable loss
- −$4,136
- Est. tax savings @ 24.0%
- +$993
- After-tax cash flow
- $662/yr
For passive investors: Depreciation is non-cash, so a rental often shows a tax loss while cash-flowing — sheltering income. Rental losses are passive: they offset passive income freely, and up to $25,000/yr can offset ordinary (W-2) income if you actively participate and your MAGI is under $100k (phasing out to $0 by $150k); unused losses carry forward. On sale, claimed depreciation is recaptured at up to 25%, and gains may owe capital-gains tax (a 1031 exchange can defer both). Figures are a year-1 estimate at your 24.0% rate — not tax advice; consult a CPA.
Schools (NCES district)
- District
- Crowley ISD
- NCES district ID
- 4815910
- Math proficiency
- 23% ▼ -15.00%
- Reading proficiency
- 32% ▼ -6.00%
- Median HH income
- $59,810
- Composite
- 25.04/100
- National rank
- #7549
- State rank
- #643 of 826 in TX
Livability — Fort Worth
- Score
- 80/100
- State rank
- #49
- US rank
- #1954
Category grades
Schools grade is shown separately in the Schools card above.
Census & demographics
- Census place
- Fort Worth, TX
- County
- Tarrant County · 2,033,669 people
- City population
- 911,619
- Metro
- Dallas-Fort Worth-Arlington, TX
- Population (ZIP)
- 42,957
- Household income
- $102,768
- Rent vs Own
- Severe rent burden
- 975.0
Population outlook (Tarrant County) Hauer SSP2
- Today (2025)
- 2,380,417 people
- By 2030
- 2,578,900 · +8.3%
- By 2040
- 2,974,995 · +25.0%
- By 2050
- 3,350,489 · +40.8%
- By 2075
- 4,216,909 · +77.2%
- By 2100
- 4,741,527 · +99.2%
Race, ethnicity, and origin ACS 2023
- Neighborhood character
- Highly diverse neighborhood (Simpson 0.73)
- Race & ethnicity
- Black 37% Hispanic / Latino 26% White 24% Two or more races 15% Asian 8%
- Hispanic origin (detail)
- Mexican 22%
- Common ancestry
- Italian 1% Romanian 1% Slovak 1%
- Foreign-born
- 17% · Canada, Vietnam, Jamaica
- Languages at home
- 75% English-only · Spanish 16% Other Indo-European 3% Vietnamese 2%
Political lean MEDSL · Tarrant
- 2024 margin
- Lean R (+5.1) · D 46.7% · R 51.9% · Other 1.4%
- 2008→2024 swing
- +6.6pp toward D · 2008: -11.7pp · 2024: -5.1pp
- All cycles
- 2024: R+5.1 2020: D+0.2 2016: R+8.7 2012: R+15.7 2008: R+11.7
Not yet ingested
- Civics
- —
Market trends
- HPI YoY
- ▼ -50.54%
- Current HPI
- 231.1377
- Rent YoY
- ▲ 1.07%
- Metro
- Dallas-Fort Worth-Arlington, TX
- State GDP YoY
- ▲ 3.95%
- F500 in state
- 110
Industry mix (Fortune 500 HQ in TX)
| Industry | F500 HQs | Revenue |
|---|---|---|
| Energy | 16 | $1,198B |
|
||
| Technology | 5 | $198B |
|
||
| Engineering / Construction | 4 | $72B |
|
||
| Energy Services | 3 | $60B |
|
||
| Utilities | 3 | $41B |
|
||
| Healthcare | 2 | $330B |
|
||
Price history
+204.4% since first listed8 events — show timeline
- 2026-05-19 Relisted — NTREIS
- 2026-05-16 Contingent — NTREIS
- 2026-05-13 Listed $229,990 NTREIS
- 2010-08-09 Sold (MLS) — NTREIS
- 2010-05-21 Listing Removed — NTREIS
- 2010-03-03 Listed $75,550 NTREIS
- 2004-10-04 Sold (Public Records) — Public Records
- 1997-01-01 Sold (Public Records) — Public Records
Property tax history
+4.8%/yrLatest (2025): $4,806 · +2.0% YoY. Source: county tax records.
Cash-flow waterfall
monthlySold comps — $/sqft
last 12 mo · ≤1 miLoading sold comps…