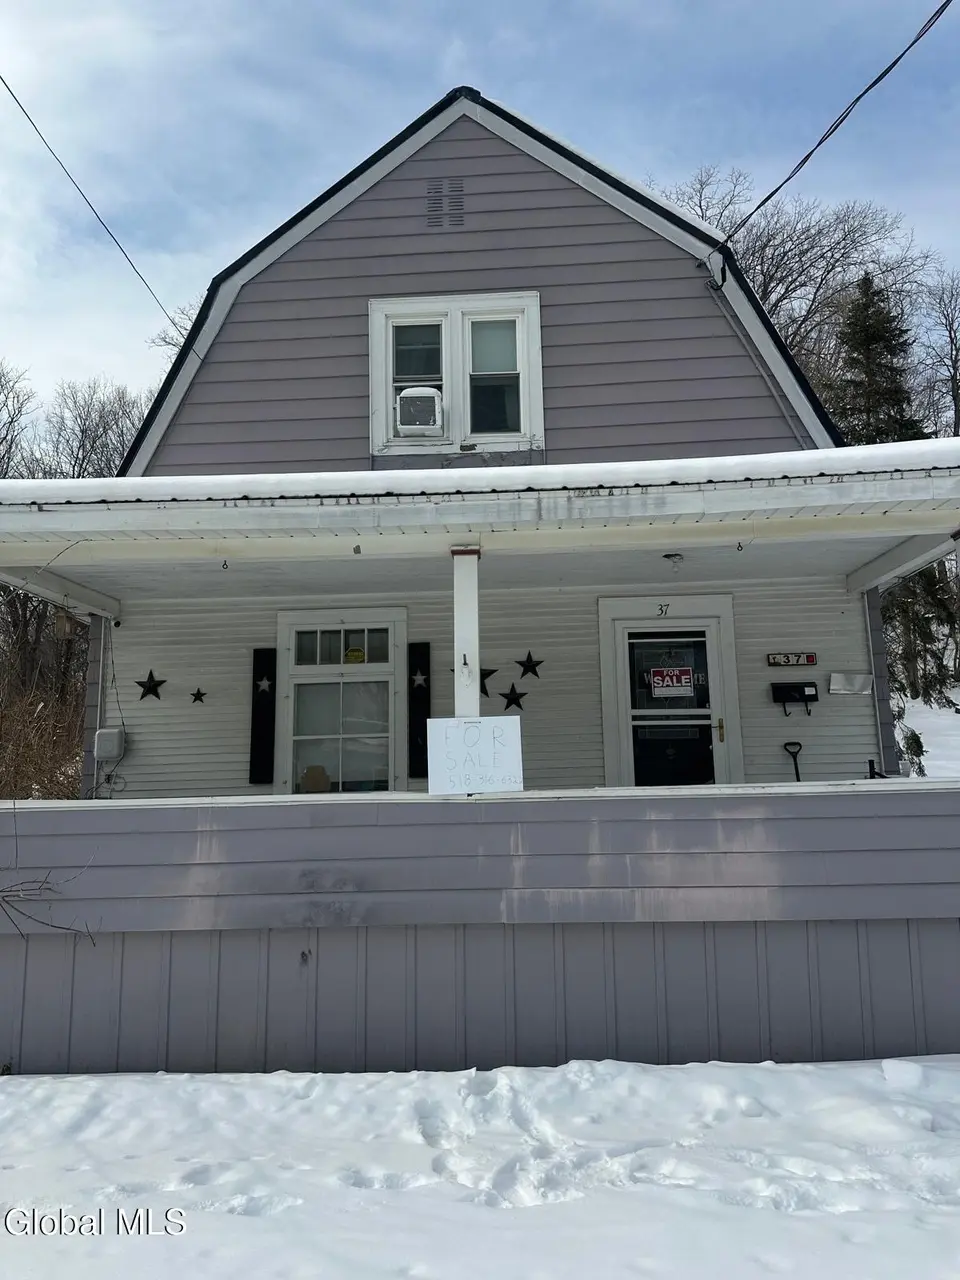
37 Howard Ave · Malone, NY
Flood risk 9/10 · Severe
- FEMA flood zone
- X
- Chance of flooding over 30 yrs
- 0.99%
- Est. flood insurance / yr
- $473 – $860
Fire risk 3/10 · Minor
- Est. fire insurance / yr
- $691 – $1,283
Heat risk 2/10 · Minimal
- Hot days now (above 90°F)
- 7 days/yr
- Hot days in 30 yrs
- 17 days/yr
Wind risk 1/10 · Minimal
- Chance of severe wind over 30 yrs
- —
Air-quality risk 1/10 · Minimal
- Unhealthy air days now
- 0 days/yr
- Unhealthy air days in 30 yrs
- 0 days/yr
Risk factors via First Street. Map © Google.
Why this score? — see what drove the B+ grade
The composite is a weighted blend of 9 inputs, each scored 0–100. Each bar is that input's sub-score; the figure is the points it added to the 100-point composite (weight × sub-score).
- Cash flow +30.0/30.0
- 1% rule +10.0/10.0
- DSCR +10.0/10.0
- Appreciation +10.0/10.0
- ARV discount +7.5/15.0
- Livability +3.5/5.0
- Rent growth +2.5/5.0
- Condition / age +2.5/5.0
- Schools +2.4/10.0
$34,900
🖨 Deal sheet 📄 Offer letter ✓ Due diligence
Listing remarks MLS
Welcome To 37 Howard Ave! This Parcel Features: -0.14 Acres -Extra Room -Public Water -Public Sewer Property Needs Work. Cash. As Is. Assignment Of Contract.
Key facts
- 6,098 sq ft lot
- Built 1900
- Listed 134 days
Neighborhood map
What this means for you Summary
Snapshot
- This is a 3-bed/1.0-bath single-family listed at $35k.
Deal economics
- At list price, monthly cash flow is $509 ($6k/yr) — positive.
- The deal already cash-flows at list — no discount required.
- Meets the 1% rule at list price ($1k rent vs $35k).
- Recommended offer: $31k (12.0% below list) — sets the bar for market timing.
- Cap rate 25.7% vs local median 5.3% in Malone — top-decile yield for the area; either an underpriced asset or a hidden risk that comps aren't pricing in. Stress-test before assuming the spread holds.
Location & tenants
- Location reads 70/100 on livability (#437 in NY) — a middle-class / working-renter tenant base. Strengths: cost of living A+, housing A+, health & safety A+; Watch: schools D+, employment D+, crime D-.
- Malone Central School District (town): math 27% / reading 29% proficiency, ranked #581 of 590 in NY (top 98%) — low school quality limits family demand, transient renter base, plan for 1-2y turnover.
- Market conditions: 113 active listings in the ZIP; 124 units permitted in Franklin County in 2024 (0 in 5+ unit buildings).
Forward outlook
- In year one you build about $4k of equity ($241 loan paydown + $3k appreciation (10.0% local appreciation)).
- Franklin County population projected at -14% by 2050 — secular population decline; favor cash flow + early exit over multi-decade hold.
- At projected returns (10.0% appreciation + 3.0% rent growth), your $10k cash investment doubles in ~1 year — after that, you're playing with house money.
- By year 8, paydown + projected appreciation supports a ~$32k cash-out refi (75% LTV) — recoverable capital for the next deal without selling this one.
Negotiation context
- It's been on market 135 days — a 12% lower offer ($31k) is reasonable based on typical stale-listing flexibility.
- 3 sale attempts since 7y ago; this cycle's ask has dropped $25k (42%) from the opening price — seller is motivated, your offer sets the floor, not the list.
Risks & watch-outs
- Watch-outs: flood insurance adds $56/mo; built in 1900 — expect roof / HVAC / electrical / plumbing capex.
- Climate carrying-cost: severe flood risk — expect insurance premiums to compound above CPI over the hold.
Questions for the listing agent
- It's been on market 135 days. Have you received any prior offers? Is the seller open to a 12% concession, seller financing, or rate buy-down credit?
- Built in 1900 — when were the roof, HVAC, electrical panel, plumbing, and water heater last replaced?
- What's the actual annual flood-insurance premium (NFIP or private), and is the property in a SFHA with mandatory coverage?
- Why hasn't it sold? Are there any deal-killer items the seller is aware of (foundation, flood, title, zoning, code violations)?
- Is there a deadline driving the sale (1031 exchange, divorce, estate, relocation)? That informs how much negotiation room exists.
- Schools are D-rated, which usually means shorter tenancies and higher turnover. Who's the typical renter profile here, and what's been the actual vacancy rate?
- Crime grade is D in this area — have there been break-ins, vandalism, or insurance claims at this property in the last 3 years? What carrier currently insures it and at what premium?
- What's the average days-on-market for RENTAL listings here right now (not sales)? A rising rental-DOM trend means longer vacancies and softer asking-rent achievability than the comps imply.
- What's the recent tenant-quality profile in this submarket — average credit score on applications, eviction rate, late-payment / NSF rate, and stable-employment percentage? A property-management company in the area should have these aggregated.
- How much new for-sale + rental construction is in the pipeline within 1–3 miles? Heavy new supply typically softens prices + rents 12–24 months out; constrained supply supports both.
Investment metrics
- 1% rule
- 2.92% ✓
- Cap rate
- 25.70%
- Cash-on-cash
- 69.30%
- DSCR
- 4.08
- GRM
- 2.9
CMA / ARV
- ARV (median comp)
- $121,535
- List price
- $34,900
- Delta
- -71.28%
- Verdict
- UNDERPRICED
- Comps
- 20 within 1.0 mi
Show comp detail 12 sales within ~0.75 mi
| Address | Dist | Beds/Ba | Sqft | Sold | Price | $/sf | Match |
|---|---|---|---|---|---|---|---|
| 4 Scott Dr | 0.27mi | 3/1.0 | 1,232 (+2%) | 3mo | $161,000 | $131 | 82 |
| 12 Spaulding Ave. Ave | 0.18mi | 3/1.5 | 1,156 (-4%) | 5mo | $69,500 | $60 | 78 |
| 45 Edward St | 0.33mi | 4/1.0 (+1) | 1,248 (+3%) | 1mo | $115,000 | $92 | 73 |
| 28 Branch St St | 0.41mi | 2/1.5 (-1) | 1,196 (-1%) | 5mo | $18,000 | $15 | 68 |
| 14 South St | 0.50mi | 3/1.0 | 1,133 (-6%) | 6mo | $91,000 | $80 | 61 |
| 162 William St | 0.54mi | 3/1.0 | 1,156 (-4%) | 8mo | $82,400 | $71 | 61 |
| 47 Edward St | 0.34mi | 4/2.0 (+1) | 1,312 (+9%) | 3mo | $120,000 | $91 | 58 |
| 48 Frankln St | 0.75mi | 2/1.0 (-1) | 1,200 (-1%) | 2mo | $97,850 | $82 | 57 |
| 47 Amsden St | 0.49mi | 3/1.0 | 1,068 (-12%) | 4mo | $75,000 | $70 | 55 |
| 4 Roby St #4 | 0.47mi | 3/2.0 | 1,034 (-14%) | 2mo | $122,000 | $118 | 48 |
| 21 Sprague St | 0.66mi | 4/1.5 (+1) | 1,276 (+6%) | 7mo | $157,000 | $123 | 47 |
| 15 Jones St | 0.69mi | 3/1.0 | 1,063 (-12%) | 8mo | $165,000 | $155 | 41 |
Match score weights: distance 35% · size 25% · config 20% · recency 20%. Top-matched comps best support the ARV.
Projected returns pro-forma
10.0% appreciation · 3.0% rent growth · sell at horizon
- IRR
- 74.4%
- Equity multiple
- 6.27×
- Total profit
- $51,463
- Equity at exit
- $31,441
- IRR
- 68.3%
- Equity multiple
- 13.91×
- Total profit
- $126,165
- Equity at exit
- $67,803
Cash invested: $9,772 (down + closing). Projections, not guarantees.
Landlord ↔ Tenant lean methodology
- Overall (STATE)
- 15 Strongly Tenant-Friendly
- State New York
- 15 Strongly Tenant-Friendly · D+10
- County
- — inherits STATE
- City
- — inherits STATE
ZIP-level market 12953
- Home prices YoY
- 7.2%
- Active inventory
- 113
- Price-to-rent
- 2.9×
Monthly cashflow live
- Estimated rent
- $1,020 medium interval (Pro) →
- Mortgage (P&I)
- −$183
- Tax est. 1.5%
- −$44 /mo · $524/yr
- Insurance
- −$15
- Flood insurance flood zone
- −$56 /mo · $666/yr
- HOA
- −$0
- Vacancy / Maint / Mgmt
- −$214
- Net cashflow
- $509
Break-even live
UW: 25.0% down · 7.5% · 30yr · 1.5% tax · 5.0% vac · 8.0% maint · 8.0% mgmt
Financing live
Cash to close
- Down payment
- $8,725
- Closing costs
- $1,047
- Reserves months
- —
- Total cash needed
- —
Loan-product check · same deal, 3 products live
Conventional
25% down · 7.5% · 30yr
- Down + closing
- —
- Monthly P&I
- —
- Monthly cashflow
- —
- DSCR
- —
- Eligible?
- —
Personal DTI + credit; lowest rate.
DSCR
20% down · 8.5% · 30yr
- Down + closing
- —
- Monthly P&I
- —
- Monthly cashflow
- —
- DSCR
- —
- Eligible?
- —
No personal income docs; deal must DSCR.
Hard money
10% down · 12.0% · 12mo
- Down + closing
- —
- Monthly P&I
- —
- Monthly cashflow
- —
- DSCR
- —
- Eligible?
- —
Short-term bridge; refi at stabilization.
Listing history 25 events
-
2026-06-18days on market $34,900 Active 135 DOM
-
2026-06-17days on market $34,900 Active 134 DOM
-
2026-06-16days on market $34,900 Active 133 DOM
-
2026-06-15days on market $34,900 Active 132 DOM
-
2026-06-13days on market $34,900 Active 130 DOM
-
2026-06-12days on market $34,900 Active 129 DOM
-
2026-06-09days on market $34,900 Active 126 DOM
-
2026-06-08days on market $34,900 Active 125 DOM
-
2026-06-07days on market $34,900 Active 124 DOM
-
2026-06-07days on market $34,900 Active 123 DOM
-
2026-06-04days on market $34,900 Active 120 DOM
-
2026-06-02days on market $34,900 Active 119 DOM
-
2026-06-01days on market $34,900 Active 118 DOM
-
2026-05-31days on market $34,900 Active 117 DOM
-
2026-05-07price $34,900 175-char remark
Show marketing remark (175 chars)
Welcome To 37 Howard Ave! This Parcel Features: -0.14 Acres -Extra Room -Public Water -Public Sewer Property Needs Work. Cash. As Is. Assignment Of Contract.
-
2026-03-11price $44,900 175-char remark
Show marketing remark (175 chars)
Welcome To 37 Howard Ave! This Parcel Features: -0.14 Acres -Extra Room -Public Water -Public Sewer Property Needs Work. Cash. As Is. Assignment Of Contract.
-
2026-03-06price $49,900 175-char remark
Show marketing remark (175 chars)
Welcome To 37 Howard Ave! This Parcel Features: -0.14 Acres -Extra Room -Public Water -Public Sewer Property Needs Work. Cash. As Is. Assignment Of Contract.
-
2026-02-24price $54,900 175-char remark
Show marketing remark (175 chars)
Welcome To 37 Howard Ave! This Parcel Features: -0.14 Acres -Extra Room -Public Water -Public Sewer Property Needs Work. Cash. As Is. Assignment Of Contract.
-
2026-02-03$59,900 Active 175-char remark
Show marketing remark (175 chars)
Welcome To 37 Howard Ave! This Parcel Features: -0.14 Acres -Extra Room -Public Water -Public Sewer Property Needs Work. Cash. As Is. Assignment Of Contract.
-
2022-05-23soldstatus $79,500
-
2022-05-20soldstatus $79,500 518-char remark
Show marketing remark (518 chars)
Quaint, cozy, well-maintained village home on a quiet residential street. Covered front porch to sit outside in the summer and fall. The attached shed appears to have once been a one car garage and could easily be converted back by moving a set of stairs. Bathroom features a walk-in shower unit. Upstairs hall closet space can be used to expand the bathroom. Close to Flanders Elementary school and Franklin Academy. Priced to move, this one won't last long. Come take a look at a nice village home at a great price!!
-
2022-01-26$77,500 518-char remark
Show marketing remark (518 chars)
Quaint, cozy, well-maintained village home on a quiet residential street. Covered front porch to sit outside in the summer and fall. The attached shed appears to have once been a one car garage and could easily be converted back by moving a set of stairs. Bathroom features a walk-in shower unit. Upstairs hall closet space can be used to expand the bathroom. Close to Flanders Elementary school and Franklin Academy. Priced to move, this one won't last long. Come take a look at a nice village home at a great price!!
-
2019-08-25soldstatus $54,000
-
2019-08-21soldstatus $54,000
-
2019-07-11$59,500
ⓘ Source: listings_history table (triggers on properties + properties_extension) + one-shot
backfill from property_details.listing_events for pre-trigger history.
Climate risk First Street
- Flood 9/10 Extreme FEMA zone X · 99% chance over 30 yrs
- Wildfire 3/10 Moderate
- Heat 2/10 Low 7 d/yr ≥90°F today · 17 d/yr by 30 yrs out
- Wind 1/10 Low
- Air quality 1/10 Low 0 unhealthy d/yr today · 0 by 30 yrs out
Nearby sold comps map
Loading sold comps map…
Walkable amenities ~0.75 mi
Loading nearby amenities…
Taxation est. · year 1
- Rental income
- $12,236
- − Mortgage interest
- −$1,955
- − Property taxes
- −$524
- − Insurance
- −$841
- − Repairs & maintenance
- −$979
- − Management
- −$979
- − Depreciation
- −$1,015
- Taxable income
- $5,943
- Est. tax owed @ 24.0%
- −$1,426
- After-tax cash flow
- $4,679/yr
For passive investors: Depreciation is non-cash, so a rental often shows a tax loss while cash-flowing — sheltering income. Rental losses are passive: they offset passive income freely, and up to $25,000/yr can offset ordinary (W-2) income if you actively participate and your MAGI is under $100k (phasing out to $0 by $150k); unused losses carry forward. On sale, claimed depreciation is recaptured at up to 25%, and gains may owe capital-gains tax (a 1031 exchange can defer both). Figures are a year-1 estimate at your 24.0% rate — not tax advice; consult a CPA.
Schools (NCES district)
- District
- Malone Central School District
- NCES district ID
- 3618180
- Math proficiency
- 27% ▼ -16.00%
- Reading proficiency
- 29% ▼ -11.00%
- Median HH income
- $46,681
- Composite
- 24.23/100
- National rank
- #7725
- State rank
- #581 of 590 in NY
Livability — Malone
- Score
- 70/100
- State rank
- #437
- US rank
- #7656
Category grades
Schools grade is shown separately in the Schools card above.
Census & demographics
- Census place
- Malone, NY
- Population (ZIP)
- 12,842
Population outlook (Franklin County) Hauer SSP2
- Today (2025)
- 48,098 people
- By 2030
- 46,790 · -2.7%
- By 2040
- 44,400 · -7.7%
- By 2050
- 41,256 · -14.2%
- By 2075
- 32,190 · -33.1%
- By 2100
- 23,407 · -51.3%
Race, ethnicity, and origin ACS 2023
- Neighborhood character
- Predominantly White (83%)
- Race & ethnicity
- White 83% Black 9% Hispanic / Latino 6%
- Hispanic origin (detail)
- Puerto Rican 2%
- Common ancestry
- Lithuanian 16% Slovak 5% Italian 2%
- Foreign-born
- 3% · Canada
- Languages at home
- 94% English-only · Spanish 4% Other Indo-European 1% French/Haitian/Cajun 1%
Political lean MEDSL · Franklin
- 2024 margin
- Lean R (+9.0) · D 45.5% · R 54.5%
- 2008→2024 swing
- -31.2pp toward R · 2008: 22.2pp · 2024: -9.0pp
- All cycles
- 2024: R+9.0 2020: R+2.2 2016: R+7.4 2012: D+26.3 2008: D+22.2
Not yet ingested
- Civics
- —
Market trends
- HPI YoY
- ▲ 17.73%
- Current HPI
- 263.2406
- Rent YoY
- —
- Metro
- —
- State GDP YoY
- ▲ 2.60%
- F500 in state
- 92
Industry mix (Fortune 500 HQ in NY)
| Industry | F500 HQs | Revenue |
|---|---|---|
| Financial Services | 10 | $950B |
|
||
| Consumer Goods | 9 | $162B |
|
||
| Insurance | 4 | $225B |
|
||
| Telecommunications | 2 | $144B |
|
||
| Pharmaceuticals | 2 | $112B |
|
||
| Media / Entertainment | 2 | $69B |
|
||
Price history
-41.3% since first listed11 events — show timeline
- 2026-05-07 Price Changed $34,900 Global MLS
- 2026-03-11 Price Changed $44,900 Global MLS
- 2026-03-06 Price Changed $49,900 Global MLS
- 2026-02-24 Price Changed $54,900 Global MLS
- 2026-02-03 Listed $59,900 Global MLS
- 2022-05-23 Sold (Public Records) $79,500 Public Records
- 2022-05-20 Sold (MLS) $79,500 ACVMLS
- 2022-01-26 Listed $77,500 ACVMLS
- 2019-08-25 Sold (MLS) $54,000 ACVMLS
- 2019-08-21 Sold (Public Records) $54,000 Public Records
- 2019-07-11 Listed $59,500 ACVMLS
Property tax history
+4.3%/yrLatest (2025): $2,380 · -0.7% YoY. Source: county tax records.
Cash-flow waterfall
monthlySold comps — $/sqft
last 12 mo · ≤1 miLoading sold comps…