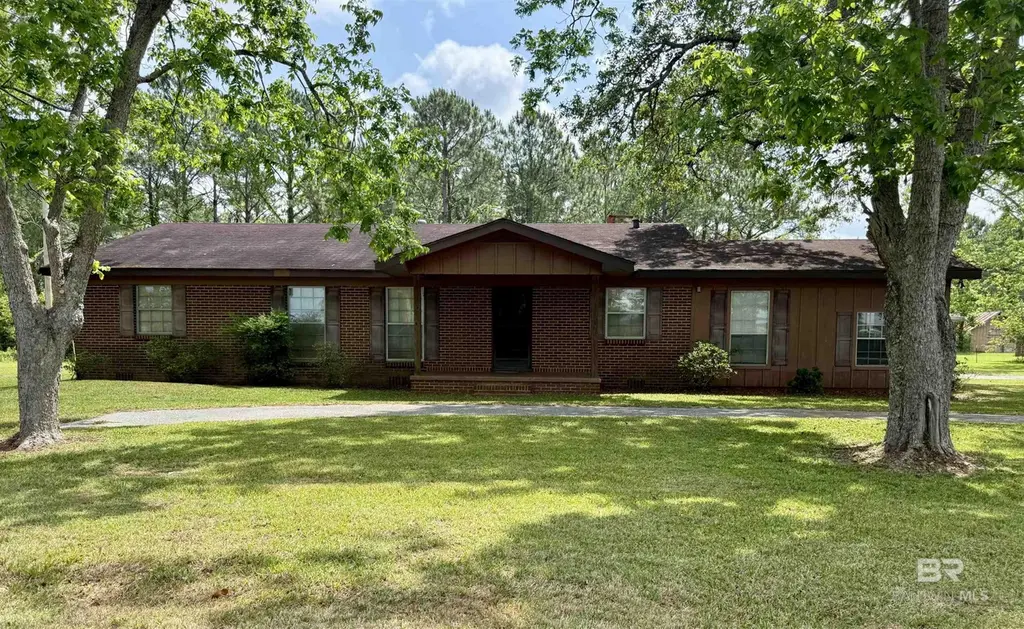
23448 Rains Rd · Silverhill, AL
Flood risk 1/10 · Minimal
- FEMA flood zone
- X (unshaded)
- Chance of flooding over 30 yrs
- 0.0%
- Est. flood insurance / yr
- $507 – $1,088
Fire risk 4/10 · Minor
- Est. fire insurance / yr
- $916 – $1,700
Heat risk 9/10 · Severe
- Hot days now (above 106°F)
- 7 days/yr
- Hot days in 30 yrs
- 21 days/yr
Wind risk 9/10 · Severe
- Chance of severe wind over 30 yrs
- 99.0%
Air-quality risk 4/10 · Minor
- Unhealthy air days now
- 3 days/yr
- Unhealthy air days in 30 yrs
- 5 days/yr
Risk factors via First Street. Map © Google.
Why this score? — see what drove the C grade
The composite is a weighted blend of 9 inputs, each scored 0–100. Each bar is that input's sub-score; the figure is the points it added to the 100-point composite (weight × sub-score).
- Cash flow +23.3/30.0
- DSCR +7.5/10.0
- ARV discount +7.5/15.0
- 1% rule +4.9/10.0
- Schools +3.9/10.0
- Livability +3.1/5.0
- Rent growth +2.9/5.0
- Condition / age +2.5/5.0
- Appreciation +0.0/10.0
$235,000
🖨 Deal sheet 📄 Offer letter ✓ Due diligence
Listing remarks
Nestled on a private, secluded lot, this 2,000+ sq ft home is filled with opportunity. Shaded by mature oak and pecan trees, the property offers a peaceful setting and endless potential for updates and customization. Priced to allow for your vision and tender loving care. Buyer to verify all information during due diligence.
Key facts
- Mature pecan trees
- Private lot
- Mature oak trees
Tags
Property features AI
Finance
- HOA & community: No community features; No transfer fees
Exterior
- Utilities: Septic tank sewer; Electric service
- Home design: One level; Resale property
- Construction: Brick construction; Pillar/post/pier foundation; Built area approximately 2,842 (assessor)
- Exterior features: Less than 1 acre lot; No waterfront; Whole/Full ownership; Composition roof
Interior
- Kitchen: Electric range; Refrigerator
- Flooring: Carpet; Tile; Wood
- Bathrooms: 2 full bathrooms
- Heating & cooling: Electric heating
- Interior features: Ceiling fan(s); One fireplace
Neighborhood map
What this means for you Summary
Snapshot
- This is a 4-bed/1.0-bath single-family listed at $235k.
Deal economics
- At list price, monthly cash flow is $429 ($5k/yr) — positive.
- The deal already cash-flows at list — no discount required.
- To meet the 1% rule (rent ≥ 1% of price), the offer needs to be $233k (0.8% below list).
- Recommended offer: $228k (3.0% below list) — sets the bar for market timing.
- Cap rate 8.5% vs local median 4.1% in Silverhill — top-decile yield for the area; either an underpriced asset or a hidden risk that comps aren't pricing in. Stress-test before assuming the spread holds.
Location & tenants
- Location reads 61/100 on livability (#240 in AL) — a middle-class / working-renter tenant base. Strengths: housing A+, cost of living A; Watch: crime F, amenities F, commute F.
- Baldwin County (rural): math 33% / reading 57% proficiency, ranked #18 of 129 in AL (top 14%) — families likely to look elsewhere, expect single-tenant / working-renter base with shorter leases.
- Zoned schools: Belforest Elementary School (math 41% / reading 75%, grade C+, #72 of 627 statewide, top 12%, 1,068 students, 31% FRL); Daphne Middle School (math 25% / reading 62%, grade D, #45 of 257 statewide, top 18%, 846 students, 45% FRL); Daphne High School (math 41% / reading 40%, grade F, #33 of 305 statewide, top 11%, 1,725 students, 40% FRL) — zoned schools at 39% FRL track the district average.
- Market conditions: Rents rising (+1.7%/yr); 590 active listings in the ZIP; solid renter incomes; 3,883 units permitted in Baldwin County in 2024 (481 in 5+ unit buildings).
- This rent runs 32% of the median local income ($89k/yr) — at the standard rent-burdened threshold; future hikes will face affordability resistance.
Forward outlook
- Local home prices are declining (-3.0%/yr); year-one equity from $2k of loan paydown is wiped out by about $7k of value loss. Plan a longer hold.
- Baldwin County population projected at +42% by 2050 — long-run rental-demand tailwind backs the buy-and-hold thesis.
Negotiation context
- It's been on market 39 days — a 3% lower offer ($228k) is reasonable based on typical stale-listing flexibility.
Risks & watch-outs
- Climate carrying-cost: severe wind risk, 99% chance of damaging wind over 30y; extreme-heat days projected 7→21/yr by 2055 (HVAC capex compounding) — expect insurance premiums to compound above CPI over the hold.
Questions for the listing agent
- It's been on market 39 days. Have you received any prior offers? Is the seller open to a 3% concession, seller financing, or rate buy-down credit?
- Built in 1963 — when were the roof, HVAC, electrical panel, plumbing, and water heater last replaced?
- Is there a deadline driving the sale (1031 exchange, divorce, estate, relocation)? That informs how much negotiation room exists.
- Crime grade is F in this area — have there been break-ins, vandalism, or insurance claims at this property in the last 3 years? What carrier currently insures it and at what premium?
- What's the average days-on-market for RENTAL listings here right now (not sales)? A rising rental-DOM trend means longer vacancies and softer asking-rent achievability than the comps imply.
- What's the recent tenant-quality profile in this submarket — average credit score on applications, eviction rate, late-payment / NSF rate, and stable-employment percentage? A property-management company in the area should have these aggregated.
- How much new for-sale + rental construction is in the pipeline within 1–3 miles? Heavy new supply typically softens prices + rents 12–24 months out; constrained supply supports both.
Investment metrics
- 1% rule
- 0.99% ✗
- Cap rate
- 8.48%
- Cash-on-cash
- 7.82%
- DSCR
- 1.35
- GRM
- 8.4
CMA / ARV
- ARV (median comp)
- $574,154
- List price
- $235,000
- Delta
- -59.07%
- Verdict
- UNDERPRICED
- Comps
- 5 within 1.0 mi
Show comp detail 1 sale within ~0.75 mi
| Address | Dist | Beds/Ba | Sqft | Sold | Price | $/sf | Match |
|---|---|---|---|---|---|---|---|
| 22969 River Rd S | 0.44mi | 4/3.0 | 2,448 (-14%) | 20mo | $485,000 | $198 | 32 |
Match score weights: distance 35% · size 25% · config 20% · recency 20%. Top-matched comps best support the ARV.
Projected returns pro-forma
-3.0% appreciation · 1.72% rent growth · sell at horizon
- IRR
- -5.7%
- Equity multiple
- 0.79×
- Total profit
- $-13,834
- Equity at exit
- $35,039
- IRR
- 2.4%
- Equity multiple
- 1.17×
- Total profit
- $10,875
- Equity at exit
- $20,319
Cash invested: $65,800 (down + closing). Projections, not guarantees.
Landlord ↔ Tenant lean methodology
- Overall (STATE)
- 90 Strongly Landlord-Friendly
- State Alabama
- 90 Strongly Landlord-Friendly · R+15
- County
- — inherits STATE
- City
- — inherits STATE
ZIP-level market 36526
- Home prices YoY
- -21.3%
- Rents YoY
- 1.7%
- Active inventory
- 590
- Price-to-rent
- 8.4×
Monthly cashflow live
- Estimated rent
- $2,330 medium interval (Pro) →
- Mortgage (P&I)
- −$1,232
- Tax from tax record
- −$82 /mo · $984/yr
- Insurance
- −$98
- HOA
- −$0
- Vacancy / Maint / Mgmt
- −$489
- Net cashflow
- $429
Break-even live
UW: 25.0% down · 7.5% · 30yr · 1.5% tax · 5.0% vac · 8.0% maint · 8.0% mgmt
Financing live
Cash to close
- Down payment
- $58,750
- Closing costs
- $7,050
- Reserves months
- —
- Total cash needed
- —
Loan-product check · same deal, 3 products live
Conventional
25% down · 7.5% · 30yr
- Down + closing
- —
- Monthly P&I
- —
- Monthly cashflow
- —
- DSCR
- —
- Eligible?
- —
Personal DTI + credit; lowest rate.
DSCR
20% down · 8.5% · 30yr
- Down + closing
- —
- Monthly P&I
- —
- Monthly cashflow
- —
- DSCR
- —
- Eligible?
- —
No personal income docs; deal must DSCR.
Hard money
10% down · 12.0% · 12mo
- Down + closing
- —
- Monthly P&I
- —
- Monthly cashflow
- —
- DSCR
- —
- Eligible?
- —
Short-term bridge; refi at stabilization.
Listing history 18 events
-
2026-06-19days on market $235,000 Active 39 DOM
-
2026-06-18days on market $235,000 Active 38 DOM
-
2026-06-17days on market $235,000 Active 37 DOM
-
2026-06-16days on market $235,000 Active 36 DOM
-
2026-06-15days on market $235,000 Active 35 DOM
-
2026-06-14days on market $235,000 Active 33 DOM
-
2026-06-13days on market $235,000 Active 32 DOM
-
2026-06-10days on market $235,000 Active 30 DOM
-
2026-06-09days on market $235,000 Active 29 DOM
-
2026-06-08days on market $235,000 Active 28 DOM
-
2026-06-07days on market $235,000 Active 27 DOM
-
2026-06-05days on market $235,000 Active 24 DOM
-
2026-06-03days on market $235,000 Active 23 DOM
-
2026-06-02days on market $235,000 Active 22 DOM
-
2026-06-01days on market $235,000 Active 21 DOM
-
2026-05-31days on market $235,000 Active 20 DOM
-
2026-05-30days on market $235,000 Active 19 DOM
-
2026-05-11$235,000 Active 326-char remark
ⓘ Source: listings_history table (triggers on properties + properties_extension) + one-shot
backfill from property_details.listing_events for pre-trigger history.
Tax reassessment forecast AL · Resets to sale price
- Current annual tax
- $984 · $82/mo
- Projected year-2 tax
- $984 · $82/mo
- Expected delta
- $0/yr ($0/mo · 0.0%)
ⓘ Screening estimate from a state-policy table — verify with the county assessor before closing.
Climate risk First Street
- Flood 1/10 Low FEMA zone X (unshaded) · 0% chance over 30 yrs
- Wildfire 4/10 Moderate
- Heat 9/10 Extreme 7 d/yr ≥106°F today · 21 d/yr by 30 yrs out
- Wind 9/10 Extreme 99% chance of damaging wind over 30 yrs
- Air quality 4/10 Moderate 3 unhealthy d/yr today · 5 by 30 yrs out
Nearby sold comps map
Loading sold comps map…
Walkable amenities ~0.75 mi
Loading nearby amenities…
Taxation est. · year 1
- Rental income
- $27,964
- − Mortgage interest
- −$13,164
- − Property taxes
- −$984
- − Insurance
- −$1,175
- − Repairs & maintenance
- −$2,237
- − Management
- −$2,237
- − Depreciation
- −$6,836
- Taxable income
- $1,331
- Est. tax owed @ 24.0%
- −$319
- After-tax cash flow
- $4,825/yr
For passive investors: Depreciation is non-cash, so a rental often shows a tax loss while cash-flowing — sheltering income. Rental losses are passive: they offset passive income freely, and up to $25,000/yr can offset ordinary (W-2) income if you actively participate and your MAGI is under $100k (phasing out to $0 by $150k); unused losses carry forward. On sale, claimed depreciation is recaptured at up to 25%, and gains may owe capital-gains tax (a 1031 exchange can defer both). Figures are a year-1 estimate at your 24.0% rate — not tax advice; consult a CPA.
Schools (NCES district)
- District
- Baldwin County
- NCES district ID
- 0100270
- Math proficiency
- 33% ▼ -26.00%
- Reading proficiency
- 57% ▲ 1.00%
- Median HH income
- $50,677
- Composite
- 38.61/100
- National rank
- #4157
- State rank
- #18 of 129 in AL
Livability — Silverhill
- Score
- 61/100
- State rank
- #240
- US rank
- #17596
Category grades
Schools grade is shown separately in the Schools card above.
Census & demographics
- County
- Baldwin County · 181,514 people
- Metro
- Daphne-Fairhope-Foley, AL
- Population (ZIP)
- 36,484
- Household income
- $88,750
- Rent vs Own
- Severe rent burden
- 535.0
Population outlook (Baldwin County) Hauer SSP2
- Today (2025)
- 248,264 people
- By 2030
- 270,315 · +8.9%
- By 2040
- 312,967 · +26.1%
- By 2050
- 352,262 · +41.9%
- By 2075
- 438,841 · +76.8%
- By 2100
- 487,736 · +96.5%
Race, ethnicity, and origin ACS 2023
- Neighborhood character
- Predominantly White (78%)
- Race & ethnicity
- White 78% Black 12% Two or more races 6% Hispanic / Latino 5% Asian 1%
- Hispanic origin (detail)
- Mexican 3%
- Common ancestry
- Slovak 3% Lithuanian 2% Italian 2%
- Foreign-born
- 4% · Canada
- Languages at home
- 95% English-only · Spanish 2% French/Haitian/Cajun 1% Russian/Polish/Slavic 1%
Political lean MEDSL · Baldwin
- 2024 margin
- Solid R (+58.2) · D 20.5% · R 78.7%
- 2008→2024 swing
- -6.7pp toward R · 2008: -51.5pp · 2024: -58.2pp
- All cycles
- 2024: R+58.2 2020: R+53.8 2016: R+57.8 2012: R+55.8 2008: R+51.5
Not yet ingested
- Civics
- —
Market trends
- HPI YoY
- ▼ -61.47%
- Current HPI
- 227.2692
- Rent YoY
- ▲ 1.72%
- Metro
- Daphne-Fairhope-Foley, AL
- State GDP YoY
- ▲ 2.94%
- F500 in state
- 4
Industry mix (Fortune 500 HQ in AL)
| Industry | F500 HQs | Revenue |
|---|---|---|
| Financial Services | 1 | $8B |
|
||
| Healthcare | 1 | $5B |
|
||
Price history
1 event — show timeline
- 2026-05-11 Listed $235,000 BCAR
Property tax history
+8.6%/yrLatest (2025): $984 · +21.6% YoY. Source: county tax records.
Cash-flow waterfall
monthlySold comps — $/sqft
last 12 mo · ≤1 miLoading sold comps…