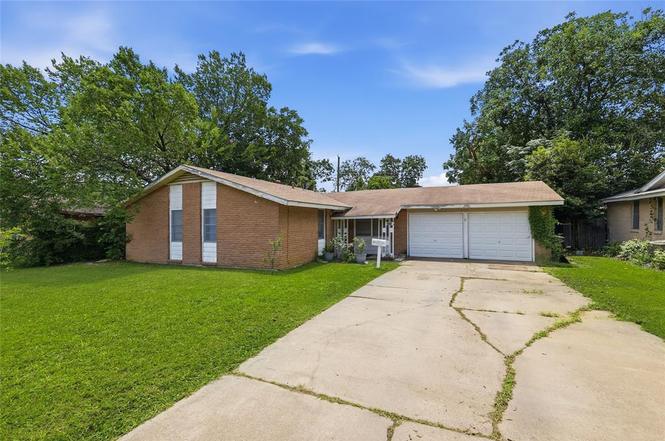
2006 Exeter St · Irving, TX
Flood risk 1/10 · Minimal
- FEMA flood zone
- X (unshaded)
- Chance of flooding over 30 yrs
- 0.0%
- Est. flood insurance / yr
- $507 – $1,088
Fire risk 1/10 · Minimal
- Est. fire insurance / yr
- $1,222 – $2,270
Heat risk 7/10 · Major
- Hot days now (above 109°F)
- 7 days/yr
- Hot days in 30 yrs
- 23 days/yr
Wind risk 6/10 · Moderate
- Chance of severe wind over 30 yrs
- 27.0%
Air-quality risk 3/10 · Minor
- Unhealthy air days now
- 3 days/yr
- Unhealthy air days in 30 yrs
- 4 days/yr
Risk factors via First Street. Map © Google.
Why this score? — see what drove the C+ grade
The composite is a weighted blend of 9 inputs, each scored 0–100. Each bar is that input's sub-score; the figure is the points it added to the 100-point composite (weight × sub-score).
- Cash flow +19.7/30.0
- ARV discount +15.0/15.0
- 1% rule +7.4/10.0
- DSCR +6.2/10.0
- Livability +4.0/5.0
- Rent growth +3.5/5.0
- Condition / age +2.5/5.0
- Schools +1.9/10.0
- Appreciation +0.0/10.0
$164,900
🖨 Deal sheet 📄 Offer letter ✓ Due diligence
Listing remarks
NO SHOWINGS Until June 19th. Home is Occupied. Appointment REQUIRED to See the Home. Do Not Knock On Sellers Door. Investor Special! This 3-Bedroom, 2-Bath Home Presents an Excellent Opportunity for Investors, Flippers, Or Buyers Looking for a Renovation Project. Necessary Repairs Include by Not limited to Foundation Repairs, Electrical Updates, Partial Plumbing Replacement, Roof Replacement. Partial Plumbing Replacement Done Under the Kitchen and Guest Bathroom, All other Plumbing is Believed to be Collapsed, Primary Bathroom Water Shut-Off, Converted to Closet. HVAC System Replaced In March 2025. Property Is Being Sold As-Is. No Repairs or Updates. Cash Purchasers Only. No Assignment or W
Key facts
- 1,355 sq ft lot
- 2 garage spots
- Built 1960
Property features AI
Finance
- Other: Property listed for sale (cash offers accepted); Located in Dallas County, subdivision Northgate West 05
- HOA & community: No HOA / association
Exterior
- Parking: Attached 2-car garage; 2 covered parking spaces; Garage faces front
- Utilities: City water; City sewer; Not in a municipal utility district
- Home design: Single family residence; Attached property; One story
- Construction: Built in 1986; Brick construction; Composition roof; Preowned
- Exterior features: Wood fencing; Lot smaller than 0.5 acre
Interior
- Kitchen: Gas cooktop; Gas oven; Gas range
- Bedrooms: 3 bedrooms (all on the main level)
- Bathrooms: 2 full bathrooms
- Heating & cooling: Central heating (natural gas); Central air conditioning; Ceiling fans; Electric components
- Interior features: Eat-in kitchen; One living area; One dining area; 8 total rooms
- Laundry & utility: Washer hookup
Neighborhood map
What this means for you Summary
Snapshot
- This is a 3-bed/2.0-bath single-family listed at $165k.
Deal economics
- At list price, monthly cash flow is $194 ($2k/yr) — positive.
- The deal already cash-flows at list — no discount required.
- Meets the 1% rule at list price ($2k rent vs $165k).
- Cap rate 7.7% vs local median 2.6% in Irving — top-decile yield for the area; either an underpriced asset or a hidden risk that comps aren't pricing in. Stress-test before assuming the spread holds.
Location & tenants
- Location reads 80/100 on livability (#45 in TX, #1,913 nationally) — a professional / high-income tenant draw. Strengths: commute A+, cost of living A+, housing A+; Watch: amenities C-.
- Irving ISD (urban): math 19% / reading 25% proficiency, ranked #751 of 826 in TX (top 91%) — low school quality limits family demand, transient renter base, plan for 1-2y turnover; 72% free/reduced lunch — lower-income household profile, screen leases tightly.
- Zoned schools: Lee El (math 19% / reading 21%, grade F, #3,536 of 4,322 statewide, top 83%, 709 students, 89% FRL) — zoned schools average 89% FRL vs 72% district-wide (16 pts higher); higher-poverty schools than district average — tighter screening recommended.
- Market conditions: Rents rising fast (+4.1%/yr); 148 active listings in the ZIP; 40 comparable units currently listed for rent nearby; rentals at typical pace (median 22d on market — plan ~3-4 weeks tenant-placement turnaround); 12,577 units permitted in Dallas County in 2024 (6,829 in 5+ unit buildings).
- This rent runs 34% of the median local income ($73k/yr) — at the standard rent-burdened threshold; future hikes will face affordability resistance.
Forward outlook
- Local home prices are declining (-3.0%/yr); year-one equity from $1k of loan paydown is wiped out by about $5k of value loss. Plan a longer hold.
- Dallas County population projected at +35% by 2050 — long-run rental-demand tailwind backs the buy-and-hold thesis.
Negotiation context
- Only 3 days on market — expect competitive offers; lowballing is unlikely to land.
Risks & watch-outs
- Watch-outs: property tax is 3.5% of price.
- Climate carrying-cost: major wind risk, 27% chance of damaging wind over 30y; extreme-heat days projected 7→23/yr by 2055 (HVAC capex compounding) — expect insurance premiums to compound above CPI over the hold.
Questions for the listing agent
- Built in 1960 — when were the roof, HVAC, electrical panel, plumbing, and water heater last replaced?
- Property tax is high relative to price — has the assessment been appealed recently, and will the sale trigger a re-assessment?
- Is there a deadline driving the sale (1031 exchange, divorce, estate, relocation)? That informs how much negotiation room exists.
- What's the average days-on-market for RENTAL listings here right now (not sales)? A rising rental-DOM trend means longer vacancies and softer asking-rent achievability than the comps imply.
- What's the recent tenant-quality profile in this submarket — average credit score on applications, eviction rate, late-payment / NSF rate, and stable-employment percentage? A property-management company in the area should have these aggregated.
- How much new for-sale + rental construction is in the pipeline within 1–3 miles? Heavy new supply typically softens prices + rents 12–24 months out; constrained supply supports both.
Investment metrics
- 1% rule
- 1.24% ✓
- Cap rate
- 7.71%
- Cash-on-cash
- 5.05%
- DSCR
- 1.22
- GRM
- 6.7
CMA / ARV
- ARV (on-the-fly)
- $294,686
- Comps found
- 12
Show comp detail 12 sales within ~0.75 mi
| Address | Dist | Beds/Ba | Sqft | Sold | Price | $/sf | Match |
|---|---|---|---|---|---|---|---|
| 2010 Durham St | 0.06mi | 3/2.0 | 1,428 (+5%) | 1mo | $335,000 | $235 | 88 |
| 2203 Finley Rd | 0.25mi | 3/1.0 | 1,324 (-2%) | 2mo | $250,000 | $189 | 78 |
| 3722 Devonshire Ct E | 0.29mi | 4/2.0 (+1) | 1,442 (+6%) | 3mo | $279,000 | $193 | 69 |
| 2003 Dennis St | 0.32mi | 4/1.0 (+1) | 1,310 (-4%) | 3mo | $264,900 | $202 | 68 |
| 3518 Windsor St | 0.50mi | 3/2.0 | 1,293 (-5%) | 4mo | $305,000 | $236 | 66 |
| 2015 Cartwright St | 0.42mi | 4/2.0 (+1) | 1,289 (-5%) | 6mo | $325,000 | $252 | 62 |
| 2223 Cunningham St | 0.63mi | 3/2.0 | 1,430 (+5%) | 5mo | $309,900 | $217 | 58 |
| 2501 Briarcliff Dr | 0.49mi | 3/2.0 | 1,513 (+11%) | 2mo | $315,000 | $208 | 57 |
| 2300 Cunningham St | 0.66mi | 3/2.0 | 1,423 (+5%) | 6mo | $299,000 | $210 | 56 |
| 2226 Cartwright St | 0.45mi | 3/2.0 | 1,200 (-12%) | 7mo | $269,975 | $225 | 54 |
| 2604 Burning Tree Ln | 0.61mi | 3/2.0 | 1,172 (-14%) | 5mo | $279,000 | $238 | 44 |
| 2413 Muret St | 0.74mi | 3/1.0 | 1,514 (+12%) | 6mo | $275,000 | $182 | 38 |
Match score weights: distance 35% · size 25% · config 20% · recency 20%. Top-matched comps best support the ARV.
Projected returns pro-forma
-3.0% appreciation · 4.12% rent growth · sell at horizon
- IRR
- -6.8%
- Equity multiple
- 0.74×
- Total profit
- $-11,809
- Equity at exit
- $24,587
- IRR
- 4.5%
- Equity multiple
- 1.35×
- Total profit
- $16,259
- Equity at exit
- $14,258
Cash invested: $46,172 (down + closing). Projections, not guarantees.
Landlord ↔ Tenant lean methodology
- Overall (STATE)
- 87 Strongly Landlord-Friendly
- State Texas
- 87 Strongly Landlord-Friendly · R+5
- County
- — inherits STATE
- City
- — inherits STATE
ZIP-level market 75062
- Rents YoY
- 4.1%
- Active inventory
- 148
- Price-to-rent
- 6.7×
Monthly cashflow live
- Estimated rent
- $2,043 high interval (Pro) →
- Mortgage (P&I)
- −$865
- Tax from tax record
- −$486 /mo · $5,838/yr
- Insurance
- −$69
- HOA
- −$0
- Vacancy / Maint / Mgmt
- −$429
- Net cashflow
- $194
Break-even live
UW: 25.0% down · 7.5% · 30yr · 1.5% tax · 5.0% vac · 8.0% maint · 8.0% mgmt
Financing live
Cash to close
- Down payment
- $41,225
- Closing costs
- $4,947
- Reserves months
- —
- Total cash needed
- —
Loan-product check · same deal, 3 products live
Conventional
25% down · 7.5% · 30yr
- Down + closing
- —
- Monthly P&I
- —
- Monthly cashflow
- —
- DSCR
- —
- Eligible?
- —
Personal DTI + credit; lowest rate.
DSCR
20% down · 8.5% · 30yr
- Down + closing
- —
- Monthly P&I
- —
- Monthly cashflow
- —
- DSCR
- —
- Eligible?
- —
No personal income docs; deal must DSCR.
Hard money
10% down · 12.0% · 12mo
- Down + closing
- —
- Monthly P&I
- —
- Monthly cashflow
- —
- DSCR
- —
- Eligible?
- —
Short-term bridge; refi at stabilization.
Rent comps 40 comps
| Address | Beds | Baths | Sqft | Rent | $/sqft | DOM | Units | Dist |
|---|---|---|---|---|---|---|---|---|
| 1928 Canterbury St Irving, TX | 4.0 | 2.0 | 1790 | $2,509 | $1.40 | 43d | 1 | 0.12mi |
| 3711 Devonshire Ct E Irving, TX | 3.0 | 2.0 | 1582 | $2,295 | $1.45 | 43d | 1 | 0.24mi |
| 3950 N Story Rd Irving, TX | 1.0–2.0 | 1.0–2.0 | 838 | $1,684 | $2.01 | 2d | 42 | 0.38mi |
| 2415 Finley Rd Irving, TX | 1.0–3.0 | 1.0–2.0 | 771 | $1,800 | $2.33 | 2d | 21 | 0.42mi |
| 1621 Finley Rd Irving, TX | 3.0 | 2.0 | 1645 | $2,300 | $1.40 | 7d | 1 | 0.47mi |
| 2614 Chevy Chase Dr Irving, TX | 3.0 | 2.0 | 1803 | $2,520 | $1.40 | 43d | 1 | 0.60mi |
| 3506 Bangor Ct E Irving, TX | 3.0 | 1.5 | 1469 | $2,250 | $1.53 | 43d | 1 | 0.60mi |
| 4254 Cuesta Dr #3 Irving, TX | 2.0 | 2.5 | 1461 | $2,500 | $1.71 | 3d | 1 | 0.61mi |
| 4234 Cuesta Dr Irving, TX | 2.0 | 2.5 | 1461 | $2,050 | $1.40 | 43d | 1 | 0.64mi |
| 4236 Cuesta Dr Irving, TX | 2.0 | 2.5 | 1400 | $2,150 | $1.54 | 2d | 1 | 0.64mi |
| 2623 Piedras Irving, TX | 2.0 | 1.5 | 1034 | $1,800 | $1.74 | 7d | 1 | 0.68mi |
| 3624 Harvard St N Irving, TX | 3.0 | 2.0 | 1395 | $2,250 | $1.61 | 24d | 1 | 0.70mi |
| 4260 Madera Rd Unit 2 Irving, TX | 2.0 | 2.5 | 1135 | $1,850 | $1.63 | 24d | 1 | 0.71mi |
| 4371 Madera Rd Unit 4 Irving, TX | 2.0 | 2.5 | 1135 | $1,900 | $1.67 | 7d | 1 | 0.74mi |
| 4279 Madera Rd Irving, TX | 2.0 | 1.5 | 950 | $1,800 | $1.89 | 4d | 1 | 0.77mi |
| 4404 Honfleur Ct Irving, TX | 2.0 | 2.5 | 1528 | $2,425 | $1.59 | 24d | 1 | 0.77mi |
| 4303 Mariposa Dr Irving, TX | 1.0–2.0 | 1.0–2.5 | 749 | $1,636 | $2.18 | 2d | 12 | 0.79mi |
| 2613 Amherst Ct Irving, TX | 3.0 | 2.0 | 1150 | $1,995 | $1.73 | 43d | 1 | 0.83mi |
| 2529 Rutgers Dr Irving, TX | 4.0 | 2.0 | 1122 | $2,350 | $2.09 | 14d | 1 | 0.85mi |
| 4323 North Shr Irving, TX | 1.0–3.0 | 1.0–2.0 | 1025 | $2,021 | $1.97 | 2d | 23 | 0.85mi |
| 4421 Westminster Dr Irving, TX | 3.0 | 2.0 | 1150 | $1,875 | $1.63 | 43d | 1 | 0.89mi |
| 2615 W Walnut Hill Ln Irving, TX | 2.0 | 2.0 | 915 | $1,585 | $1.73 | 14d | 1 | 0.91mi |
| 2615 W Walnut Hill Ln Irving, TX | 2.0 | 2.0 | 915 | $1,585 | $1.73 | 3d | 1 | 0.91mi |
| 2615 W Walnut Hill Ln Irving, TX | 2.0 | 2.0 | 915 | $1,585 | $1.73 | 24d | 1 | 0.91mi |
| 2727 W Walnut Hill Ln Irving, TX | 1.0–3.0 | 1.0–2.0 | 949 | $1,813 | $1.91 | 1d | 28 | 0.95mi |
| 3947 Pleasant Run Rd Irving, TX | 1.0–2.0 | 1.0–2.0 | 807 | $1,499 | $1.86 | 7d | 4 | 0.96mi |
| 1225 Fairdale St Irving, TX | 3.0 | 1.5 | 975 | $1,750 | $1.79 | 24d | 1 | 1.02mi |
| 2540 W Rochelle Rd Irving, TX | 4.0 | 3.0 | 1600 | $2,600 | $1.62 | 43d | 1 | 1.05mi |
| 4299 Pleasant Run Rd Irving, TX | 1.0–2.0 | 1.0–2.0 | 769 | $1,351 | $1.76 | 1d | 30 | 1.09mi |
| 2717 Wesleyan Dr Irving, TX | 4.0 | 2.0 | 1603 | $2,295 | $1.43 | 43d | 1 | 1.14mi |
| 919 W Rochelle Rd Unit 921 Irving, TX | 3.0 | 2.5 | 1495 | $1,895 | $1.27 | 43d | 1 | 1.18mi |
| 3701 N O'Connor Rd Irving, TX | 1.0–2.0 | 1.0–2.0 | 1071 | $2,086 | $1.95 | 1d | 30 | 1.20mi |
| 3149 W Walnut Hill Ln Unit 1138 Irving, TX | 2.0 | 2.0 | 982 | $1,295 | $1.32 | 2d | 1 | 1.21mi |
| 3149 W Walnut Hill Ln Unit 2121 Irving, TX | 2.0 | 2.0 | 982 | $1,350 | $1.37 | 10d | 1 | 1.21mi |
| 3149 W Walnut Hill Ln Unit 3206 Irving, TX | 2.0 | 2.0 | 982 | $1,307 | $1.33 | 3d | 1 | 1.21mi |
| 3149 W Walnut Hill Ln Unit 1090 Irving, TX | 2.0 | 2.0 | 982 | $1,345 | $1.37 | 22d | 1 | 1.21mi |
| 4563 N O'Connor Rd Irving, TX | 3.0 | 2.0 | 1357 | $2,500 | $1.84 | 43d | 1 | 1.21mi |
| 4533 N O'Connor Rd Unit 2208 Irving, TX | 3.0 | 3.0 | 1438 | $2,175 | $1.51 | 24d | 1 | 1.22mi |
| 4531 N O Connor Rd #1203 Irving, TX | 3.0 | 2.5 | 1639 | $2,195 | $1.34 | 24d | 1 | 1.24mi |
| 4531 N O'Connor Rd Unit 1196 Irving, TX | 2.0 | 2.5 | 1167 | $1,599 | $1.37 | 22d | 1 | 1.24mi |
Listing history 5 events
-
2026-06-18days on market $164,900 Active 3 DOM
-
2026-06-17days on market $164,900 Active 2 DOM
-
2026-06-16remarks 699-char remark
-
2026-06-15remarks 565-char remark
-
2026-06-15$164,900 Active 1 DOM
ⓘ Source: listings_history table (triggers on properties + properties_extension) + one-shot
backfill from property_details.listing_events for pre-trigger history.
Tax reassessment forecast TX · Resets to sale price
- Current annual tax
- $5,838 · $486/mo
- Projected year-2 tax
- $5,838 · $486/mo
- Expected delta
- $0/yr ($0/mo · 0.0%)
ⓘ Screening estimate from a state-policy table — verify with the county assessor before closing.
Climate risk First Street
- Flood 1/10 Low FEMA zone X (unshaded) · 0% chance over 30 yrs
- Wildfire 1/10 Low
- Heat 7/10 Severe 7 d/yr ≥109°F today · 23 d/yr by 30 yrs out
- Wind 6/10 Major 27% chance of damaging wind over 30 yrs
- Air quality 3/10 Moderate 3 unhealthy d/yr today · 4 by 30 yrs out
Nearby sold comps map
Loading sold comps map…
Walkable amenities ~0.75 mi
Loading nearby amenities…
Taxation est. · year 1
- Rental income
- $24,521
- − Mortgage interest
- −$9,237
- − Property taxes
- −$5,838
- − Insurance
- −$824
- − Repairs & maintenance
- −$1,962
- − Management
- −$1,962
- − Depreciation
- −$4,797
- Taxable loss
- −$98
- Est. tax savings @ 24.0%
- +$24
- After-tax cash flow
- $2,356/yr
For passive investors: Depreciation is non-cash, so a rental often shows a tax loss while cash-flowing — sheltering income. Rental losses are passive: they offset passive income freely, and up to $25,000/yr can offset ordinary (W-2) income if you actively participate and your MAGI is under $100k (phasing out to $0 by $150k); unused losses carry forward. On sale, claimed depreciation is recaptured at up to 25%, and gains may owe capital-gains tax (a 1031 exchange can defer both). Figures are a year-1 estimate at your 24.0% rate — not tax advice; consult a CPA.
Schools (NCES district)
- District
- Irving ISD
- NCES district ID
- 4824420
- Math proficiency
- 19% ▼ -28.00%
- Reading proficiency
- 25% ▼ -11.00%
- Median HH income
- $44,870
- Composite
- 19.06/100
- National rank
- #8840
- State rank
- #751 of 826 in TX
Livability — Irving
- Score
- 80/100
- State rank
- #45
- US rank
- #1913
Category grades
Schools grade is shown separately in the Schools card above.
Census & demographics
- Census place
- Irving, TX
- County
- Dallas County · 2,612,404 people
- City population
- 258,488
- Metro
- Dallas-Fort Worth-Arlington, TX
- Population (ZIP)
- 52,116
- Household income
- $72,704
- Rent vs Own
- Severe rent burden
- 1829.0
Population outlook (Dallas County) Hauer SSP2
- Today (2025)
- 2,979,839 people
- By 2030
- 3,191,823 · +7.1%
- By 2040
- 3,619,611 · +21.5%
- By 2050
- 4,026,915 · +35.1%
- By 2075
- 4,957,073 · +66.4%
- By 2100
- 5,508,725 · +84.9%
Race, ethnicity, and origin ACS 2023
- Neighborhood character
- Diverse neighborhood (Simpson 0.69)
- Race & ethnicity
- Hispanic / Latino 49% White 20% Two or more races 16% Black 14% Asian 14%
- Hispanic origin (detail)
- Mexican 28%
- Common ancestry
- Lithuanian 1% Slovak 1% Romanian 1%
- Foreign-born
- 39% · Canada, Jamaica, Dominican Republic
- Languages at home
- 42% English-only · Spanish 41% Other Indo-European 9% Other Asian/Pacific 1%
Political lean MEDSL · Dallas
- 2024 margin
- Strong D (+22.2) · D 60.2% · R 38.0% · Other 1.8%
- 2008→2024 swing
- +6.9pp toward D · 2008: 15.3pp · 2024: 22.2pp
- All cycles
- 2024: D+22.2 2020: D+31.6 2016: D+26.2 2012: D+15.4 2008: D+15.3
Not yet ingested
- Civics
- —
Market trends
- HPI YoY
- ▼ -305.24%
- Current HPI
- 301.2884
- Rent YoY
- ▲ 4.12%
- Metro
- Dallas-Fort Worth-Arlington, TX
- State GDP YoY
- ▲ 3.95%
- F500 in state
- 110
Industry mix (Fortune 500 HQ in TX)
| Industry | F500 HQs | Revenue |
|---|---|---|
| Energy | 16 | $1,198B |
|
||
| Technology | 5 | $198B |
|
||
| Engineering / Construction | 4 | $72B |
|
||
| Energy Services | 3 | $60B |
|
||
| Utilities | 3 | $41B |
|
||
| Healthcare | 2 | $330B |
|
||
Price history
2 events — show timeline
- 2026-06-15 Listed $164,900 NTREIS
- 1986-03-24 Sold (Public Records) — Public Records
Property tax history
+4.7%/yrLatest (2025): $5,838 · +0.0% YoY. Source: county tax records.
Cash-flow waterfall
monthlySold comps — $/sqft
last 12 mo · ≤1 miLoading sold comps…