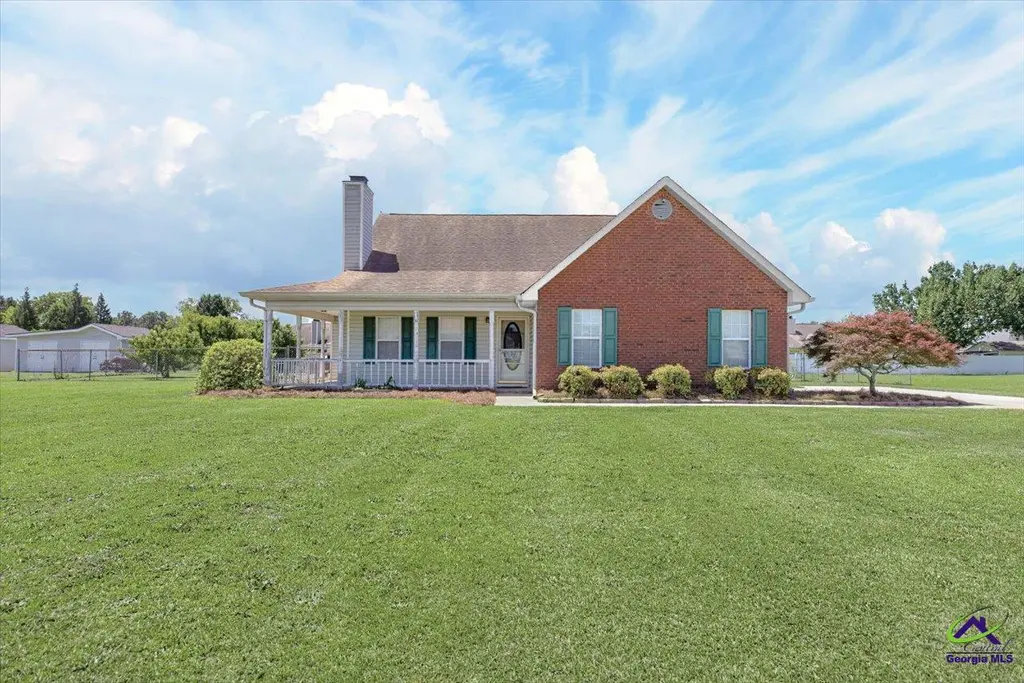
109 Pioneer Trl · Warner Robins, GA
Flood risk 1/10 · Minimal
- FEMA flood zone
- X (unshaded)
- Chance of flooding over 30 yrs
- 0.0%
- Est. flood insurance / yr
- $507 – $1,088
Fire risk 3/10 · Minor
- Est. fire insurance / yr
- $963 – $1,789
Heat risk 7/10 · Major
- Hot days now (above 109°F)
- 7 days/yr
- Hot days in 30 yrs
- 19 days/yr
Wind risk 7/10 · Major
- Chance of severe wind over 30 yrs
- 78.0%
Air-quality risk 3/10 · Minor
- Unhealthy air days now
- 2 days/yr
- Unhealthy air days in 30 yrs
- 3 days/yr
Risk factors via First Street. Map © Google.
Why this score? — see what drove the D- grade
The composite is a weighted blend of 9 inputs, each scored 0–100. Each bar is that input's sub-score; the figure is the points it added to the 100-point composite (weight × sub-score).
- Cash flow +12.4/30.0
- ARV discount +6.2/15.0
- Schools +3.9/10.0
- DSCR +3.7/10.0
- Livability +3.2/5.0
- Rent growth +2.9/5.0
- 1% rule +2.6/10.0
- Condition / age +2.5/5.0
- Appreciation +0.0/10.0
$259,900
🖨 Deal sheet (PDF) 📄 Offer letter ✓ Due diligence
Listing remarks
BACK ON THE MARKET AT NO FAULT OF THE SELLERS. .. Welcome home to 109 Pioneer Trail in Warner Robins, GA! This beautifully maintained 3-bedroom, 2-bath home offers comfort, style, and convenience in a location served by great schools. Inside, you'll love the neutral color palette that creates a bright, welcoming atmosphere, complemented by durable and stylish LVP flooring throughout. The spacious living areas are perfect for both relaxing and entertaining, while the functional kitchen provides ample cabinet and counter space for everyday living. The comfortable bedrooms and well-appointed bathrooms make this home truly move-in ready. Situated on just over half an acre, the property offers p
Key facts
- Mature peach trees
- Desirable location
- Ample cabinet space
Tags
Property features AI
Exterior
- Parking: Attached 2-car garage (2 covered parking spaces, 2 total parking spaces)
- Utilities: Public water; Septic tank sewer
- Home design: Single-family residence; One story; Vinyl siding and brick exterior
- Construction: Slab foundation
- Exterior features: Fenced yard; Approximately 0.52-acre lot
Interior
- Kitchen: Electric range; Dishwasher; Microwave; Garbage disposal
- Flooring: Vinyl flooring
- Bathrooms: Two full bathrooms
- Heating & cooling: Central heating; Central air conditioning
- Interior features: Blinds on windows; Electric range, garbage disposal, dishwasher, microwave, and range; Vinyl flooring; One fireplace
Neighborhood map
What this means for you Summary
Snapshot
- This is a 3-bed/2.0-bath single-family listed at $260k.
Deal economics
- At list price, monthly cash flow is $-42 ($-507/yr) — negative.
- To cash-flow at today's rent, offer at most $252k (2.9% below list).
- To meet the 1% rule (rent ≥ 1% of price), the offer needs to be $197k (24.3% below list).
- Recommended offer: $197k (24.3% below list) — sets the bar for 1% rule.
- Cap rate 6.1% vs local median 4.9% in Warner Robins — meaningfully above typical; check what's discounted (condition, days-on-market, listing class) to confirm the premium yield is real.
Location & tenants
- Location reads 65/100 on livability (#227 in GA) — a middle-class / working-renter tenant base. Strengths: cost of living A+, housing A+, health & safety A+; Watch: employment D+, crime F, amenities F.
- Houston County (urban): math 43% / reading 46% proficiency, ranked #23 of 174 in GA (top 13%) — families likely to look elsewhere, expect single-tenant / working-renter base with shorter leases.
- Zoned schools: Lake Joy Primary School (666 students, 46% FRL); Mossy Creek Middle School (math 57% / reading 61%, grade B, #45 of 470 statewide, top 10%, 741 students, 36% FRL); Houston County High School (math 37% / reading 45%, grade F, #53 of 424 statewide, top 12%, 2,065 students, 36% FRL).
- Market conditions: Rents rising (+1.7%/yr); 295 active listings in the ZIP; 12 comparable units currently listed for rent nearby; rentals at typical pace (median 16d on market — plan ~3-4 weeks tenant-placement turnaround); solid renter incomes; 1,545 units permitted in Houston County in 2024 (336 in 5+ unit buildings).
Forward outlook
- Local home prices are declining (-3.0%/yr); year-one equity from $2k of loan paydown is wiped out by about $8k of value loss. Plan a longer hold.
- Houston County population projected at +22% by 2050 — long-run rental-demand tailwind backs the buy-and-hold thesis.
Negotiation context
- Only 5 days on market — expect competitive offers; lowballing is unlikely to land.
- Current owner paid $140k; list at $260k implies a 86% gain — meaningful room to come down on a strong offer.
Risks & watch-outs
- Climate carrying-cost: major wind risk, 78% chance of damaging wind over 30y; extreme-heat days projected 7→19/yr by 2055 (HVAC capex compounding) — expect insurance premiums to compound above CPI over the hold.
Questions for the listing agent
- What do current leases actually rent for vs. the listed asking? Can we see a recent rent roll and the last 12 months of T-12 income?
- Is there a deadline driving the sale (1031 exchange, divorce, estate, relocation)? That informs how much negotiation room exists.
- Schools are D-rated, which usually means shorter tenancies and higher turnover. Who's the typical renter profile here, and what's been the actual vacancy rate?
- Crime grade is F in this area — have there been break-ins, vandalism, or insurance claims at this property in the last 3 years? What carrier currently insures it and at what premium?
- The area grade is low — what's the realistic commute time and amenity access for the typical tenant pool here? Any planned neighborhood developments (good or bad) we should know about?
- What's the average days-on-market for RENTAL listings here right now (not sales)? A rising rental-DOM trend means longer vacancies and softer asking-rent achievability than the comps imply.
- What's the recent tenant-quality profile in this submarket — average credit score on applications, eviction rate, late-payment / NSF rate, and stable-employment percentage? A property-management company in the area should have these aggregated.
- How much new for-sale + rental construction is in the pipeline within 1–3 miles? Heavy new supply typically softens prices + rents 12–24 months out; constrained supply supports both.
Investment metrics
- 1% rule
- 0.76% ✗
- Cap rate
- 6.10%
- Cash-on-cash
- -0.70%
- DSCR
- 0.97
- GRM
- 11.0
CMA / ARV
- ARV (on-the-fly)
- $252,487
- Comps found
- 12
Show comp detail 12 sales within ~0.75 mi
| Address | Dist | Beds/Ba | Sqft | Sold | Price | $/sf | Match |
|---|---|---|---|---|---|---|---|
| 104 Tappan Ct. Ct | 0.18mi | 3/2.0 | 1,483 (-4%) | 5mo | $255,500 | $172 | 80 |
| 104 Crockett Ct | 0.11mi | 3/2.0 | 1,701 (+10%) | 4mo | $269,900 | $159 | 76 |
| 205 Autumn Woods Dr | 0.08mi | 3/2.0 | 1,771 (+14%) | 2mo | $269,700 | $152 | 71 |
| 219 Sleepy Ln | 0.19mi | 3/2.0 | 1,631 (+5%) | 15mo | $260,000 | $159 | 69 |
| 306 Sleepy Ln | 0.24mi | 3/2.0 | 1,441 (-7%) | 10mo | $235,000 | $163 | 69 |
| 102 Mayberry Ln | 0.23mi | 3/2.0 | 1,759 (+14%) | 6mo | $315,000 | $179 | 62 |
| 111 Mayberry Ln | 0.23mi | 3/2.0 | 1,759 (+14%) | 9mo | $309,900 | $176 | 60 |
| 106 Mayberry Ln | 0.24mi | 3/2.0 | 1,762 (+14%) | 8mo | $311,900 | $177 | 59 |
| 102 Sleepy Ln | 0.32mi | 3/2.0 | 1,342 (-13%) | 5mo | $205,000 | $153 | 59 |
| 109 Autumn Woods Dr | 0.27mi | 3/2.0 | 1,700 (+10%) | 16mo | $269,900 | $159 | 58 |
| 108 Mayberry Ln | 0.24mi | 4/2.0 (+1) | 1,766 (+14%) | 5mo | $314,900 | $178 | 56 |
| 103 Autumn Woods Dr | 0.30mi | 3/2.0 | 1,755 (+13%) | 14mo | $248,000 | $141 | 52 |
Match score weights: distance 35% · size 25% · config 20% · recency 20%. Top-matched comps best support the ARV.
Projected returns pro-forma
-3.0% appreciation · 1.67% rent growth · sell at horizon
- IRR
- -18.8%
- Equity multiple
- 0.35×
- Total profit
- $-47,495
- Equity at exit
- $38,752
- IRR
- -14.0%
- Equity multiple
- 0.24×
- Total profit
- $-55,575
- Equity at exit
- $22,471
Cash invested: $72,772 (down + closing). Projections, not guarantees.
Landlord ↔ Tenant lean methodology
- Overall (STATE)
- 90 Strongly Landlord-Friendly
- State Georgia
- 90 Strongly Landlord-Friendly · R+3
- County
- — inherits STATE
- City
- — inherits STATE
ZIP-level market 31088
- Rents YoY
- 1.7%
- Active inventory
- 295
- Price-to-rent
- 11.0×
Monthly cashflow live
- Estimated rent
- $1,966 high interval (Pro) →
- Mortgage (P&I)
- −$1,363
- Tax from tax record
- −$124 /mo · $1,492/yr
- Insurance
- −$108
- HOA
- −$0
- Vacancy / Maint / Mgmt
- −$413
- Net cashflow
- $-42
Break-even live
Sensitivity live
| Price | -10% $105 | -5% $31 | +0% $-42 | +5% $-116 | +10% $-189 |
|---|---|---|---|---|---|
| Rent | -10% $-198 | -5% $-120 | +0% $-42 | +5% $35 | +10% $113 |
| Rate | -1.0pp $89 | -0.5pp $24 | base $-42 | +0.5pp $-110 | +1.0pp $-178 |
UW: 25.0% down · 7.5% · 30yr · 1.5% tax · 5.0% vac · 8.0% maint · 8.0% mgmt
Financing live
Cash to close
- Down payment
- $64,975
- Closing costs
- $7,797
- Reserves months
- —
- Total cash needed
- —
Loan-product check · same deal, 3 products live
Conventional
25% down · 7.5% · 30yr
- Down + closing
- —
- Monthly P&I
- —
- Monthly cashflow
- —
- DSCR
- —
- Eligible?
- —
Personal DTI + credit; lowest rate.
DSCR
20% down · 8.5% · 30yr
- Down + closing
- —
- Monthly P&I
- —
- Monthly cashflow
- —
- DSCR
- —
- Eligible?
- —
No personal income docs; deal must DSCR.
Hard money
10% down · 12.0% · 12mo
- Down + closing
- —
- Monthly P&I
- —
- Monthly cashflow
- —
- DSCR
- —
- Eligible?
- —
Short-term bridge; refi at stabilization.
Rent comps 12 comps
| Address | Beds | Baths | Sqft | Rent | $/sqft | DOM | Units | Dist |
|---|---|---|---|---|---|---|---|---|
| 104 Bryce Dr Warner Robins, GA | 4.0 | 2.0 | 1758 | $2,100 | $1.19 | 15d | 1 | 0.41mi |
| 1151 GA Highway 96 Kathleen, GA | 1.0–3.0 | 1.0–2.0 | 1050 | $1,875 | $1.78 | 15d | 65 | 0.68mi |
| 112 Charleston Ct Warner Robins, GA | 3.0 | 2.0 | 2020 | $1,950 | $0.97 | 15d | 1 | 0.88mi |
| 604 Stirling Bridge Dr Warner Robins, GA | 3.0 | 2.0 | 1455 | $1,700 | $1.17 | 15d | 1 | 0.93mi |
| 205 Wembley Dr Warner Robins, GA | 3.0 | 2.0 | 1493 | $1,800 | $1.21 | 23d | 1 | 1.07mi |
| 135 Cedarland Dr Warner Robins, GA | 3.0 | 2.0 | 1379 | $1,700 | $1.23 | 45d | 1 | 1.19mi |
| 402 Nandina Ct Warner Robins, GA | 2.0 | 2.0 | 1710 | $2,000 | $1.17 | 15d | 1 | 1.28mi |
| 200 Stirling Bridge Dr Warner Robins, GA | 3.0 | 2.0 | 1326 | $1,700 | $1.28 | 15d | 1 | 1.33mi |
| 104 Sir Patrick Way Warner Robins, GA | 4.0 | 2.0 | 1494 | $1,995 | $1.34 | 45d | 1 | 1.40mi |
| 136 Roseine Dr Warner Robins, GA | 4.0 | 3.5 | 2207 | $2,950 | $1.34 | 45d | 1 | 1.47mi |
| 136 Roseine Dr Warner Robins, GA | 4.0 | 3.5 | 2207 | $2,950 | $1.34 | 15d | 1 | 1.47mi |
| 406 Haverhill Cir Warner Robins, GA | 3.0 | 2.0 | 1279 | $1,550 | $1.21 | 45d | 1 | 1.49mi |
Listing history 6 events
-
2026-06-21statusdays on market $259,900 Pending 5 DOM
-
2026-06-19days on market $259,900 Active 4 DOM
-
2026-06-18days on market $259,900 Active 3 DOM
-
2026-06-17status $259,900 Active 2 DOM
-
2026-06-13remarks 699-char remark
-
2026-06-13$259,900 Pending 2 DOM
ⓘ Source: listings_history table (triggers on properties + properties_extension) + one-shot
backfill from property_details.listing_events for pre-trigger history.
Tax reassessment forecast GA · Resets to sale price
- Current annual tax
- $1,492 · $124/mo
- Projected year-2 tax
- $2,391 · $199/mo
- Expected delta
- +$899/yr (+$75/mo · 60.3%)
ⓘ Screening estimate from a state-policy table — verify with the county assessor before closing.
Climate risk First Street
- Flood 1/10 Low FEMA zone X (unshaded) · 0% chance over 30 yrs
- Wildfire 3/10 Moderate
- Heat 7/10 Severe 7 d/yr ≥109°F today · 19 d/yr by 30 yrs out
- Wind 7/10 Severe 78% chance of damaging wind over 30 yrs
- Air quality 3/10 Moderate 2 unhealthy d/yr today · 3 by 30 yrs out
Nearby sold comps map
Loading sold comps map…
Walkable amenities ~0.75 mi
Loading nearby amenities…
Taxation est. · year 1
- Rental income
- $23,595
- − Mortgage interest
- −$14,558
- − Property taxes
- −$1,492
- − Insurance
- −$1,300
- − Repairs & maintenance
- −$1,888
- − Management
- −$1,888
- − Depreciation
- −$7,561
- Taxable loss
- −$5,091
- Est. tax savings @ 24.0%
- +$1,222
- After-tax cash flow
- $715/yr
For passive investors: Depreciation is non-cash, so a rental often shows a tax loss while cash-flowing — sheltering income. Rental losses are passive: they offset passive income freely, and up to $25,000/yr can offset ordinary (W-2) income if you actively participate and your MAGI is under $100k (phasing out to $0 by $150k); unused losses carry forward. On sale, claimed depreciation is recaptured at up to 25%, and gains may owe capital-gains tax (a 1031 exchange can defer both). Figures are a year-1 estimate at your 24.0% rate — not tax advice; consult a CPA.
Schools (NCES district)
- District
- Houston County
- NCES district ID
- 1302880
- Math proficiency
- 43% ▼ -7.00%
- Reading proficiency
- 46% ▼ -2.00%
- Median HH income
- $54,823
- Composite
- 38.68/100
- National rank
- #4144
- State rank
- #23 of 174 in GA
Livability — Warner Robins
- Score
- 65/100
- State rank
- #227
- US rank
- #13290
Category grades
Schools grade is shown separately in the Schools card above.
Census & demographics
- County
- Houston County · 157,321 people
- City population
- 92,102
- Metro
- Warner Robins, GA
- Population (ZIP)
- 58,585
- Household income
- $83,082
- Rent vs Own
- Severe rent burden
- 1668.0
Population outlook (Houston County) Hauer SSP2
- Today (2025)
- 169,502 people
- By 2030
- 178,486 · +5.3%
- By 2040
- 194,642 · +14.8%
- By 2050
- 207,119 · +22.2%
- By 2075
- 231,480 · +36.6%
- By 2100
- 235,034 · +38.7%
Race, ethnicity, and origin ACS 2023
- Neighborhood character
- Diverse neighborhood (Simpson 0.63)
- Race & ethnicity
- White 51% Black 32% Two or more races 9% Hispanic / Latino 7% Asian 4%
- Hispanic origin (detail)
- Mexican 4%
- Common ancestry
- Romanian 2% Slovak 2% Lithuanian 2%
- Foreign-born
- 9% · Canada, Vietnam, Jamaica
- Languages at home
- 90% English-only · Spanish 5% Other Asian/Pacific 2% Vietnamese 2%
Political lean MEDSL · Houston
- 2024 margin
- R (+11.3) · D 44.0% · R 55.3%
- 2008→2024 swing
- +8.9pp toward D · 2008: -20.2pp · 2024: -11.3pp
- All cycles
- 2024: R+11.3 2020: R+12.4 2016: R+21.6 2012: R+20.7 2008: R+20.2
Not yet ingested
- Civics
- —
Market trends
- HPI YoY
- ▼ -135.75%
- Current HPI
- 219.8261
- Rent YoY
- ▲ 1.67%
- Metro
- Warner Robins, GA
- State GDP YoY
- ▲ 2.66%
- F500 in state
- 28
Industry mix (Fortune 500 HQ in GA)
| Industry | F500 HQs | Revenue |
|---|---|---|
| Paper / Packaging | 2 | $29B |
|
||
| Retail | 1 | $160B |
|
||
| Transportation / Logistics | 1 | $91B |
|
||
| Airlines | 1 | $62B |
|
||
| Consumer Goods | 1 | $47B |
|
||
| Utilities | 1 | $25B |
|
||
Price history
+1756.4% since first listed7 events — show timeline
- 2026-06-12 Pending — CGMLS
- 2026-06-10 Listed $259,900 CGMLS
- 2019-03-29 Sold (Public Records) $140,000 Public Records
- 2007-02-02 Sold (Public Records) $136,000 Public Records
- 2004-11-15 Sold (Public Records) $120,000 Public Records
- 1996-09-09 Sold (Public Records) $95,400 Public Records
- 1996-04-10 Sold (Public Records) $14,000 Public Records
Property tax history
+2.9%/yrLatest (2023): $1,492 · +0.5% YoY. Source: county tax records.
Cash-flow waterfall
monthlySold comps — $/sqft
last 12 mo · ≤1 miLoading sold comps…