1700 S Biltmore Ave · Muncie, IN
Flood risk 1/10 · Minimal
- FEMA flood zone
- X (unshaded)
- Chance of flooding over 30 yrs
- 0.0%
- Est. flood insurance / yr
- $473 – $860
Fire risk 1/10 · Minimal
- Est. fire insurance / yr
- $717 – $1,331
Heat risk 3/10 · Minor
- Hot days now (above 101°F)
- 7 days/yr
- Hot days in 30 yrs
- 18 days/yr
Wind risk 2/10 · Minimal
- Chance of severe wind over 30 yrs
- 1.0%
Air-quality risk 3/10 · Minor
- Unhealthy air days now
- 2 days/yr
- Unhealthy air days in 30 yrs
- 3 days/yr
Risk factors via First Street. Map © Google.
Why this score? — see what drove the B- grade
The composite is a weighted blend of 9 inputs, each scored 0–100. Each bar is that input's sub-score; the figure is the points it added to the 100-point composite (weight × sub-score).
- Cash flow +26.9/30.0
- ARV discount +11.8/15.0
- DSCR +9.3/10.0
- 1% rule +7.0/10.0
- Rent growth +4.0/5.0
- Livability +4.0/5.0
- Condition / age +2.5/5.0
- Schools +1.7/10.0
- Appreciation +0.0/10.0
$79,900
🖨 Deal sheet (PDF) 📄 Offer letter ✓ Due diligence
Listing remarks MLS
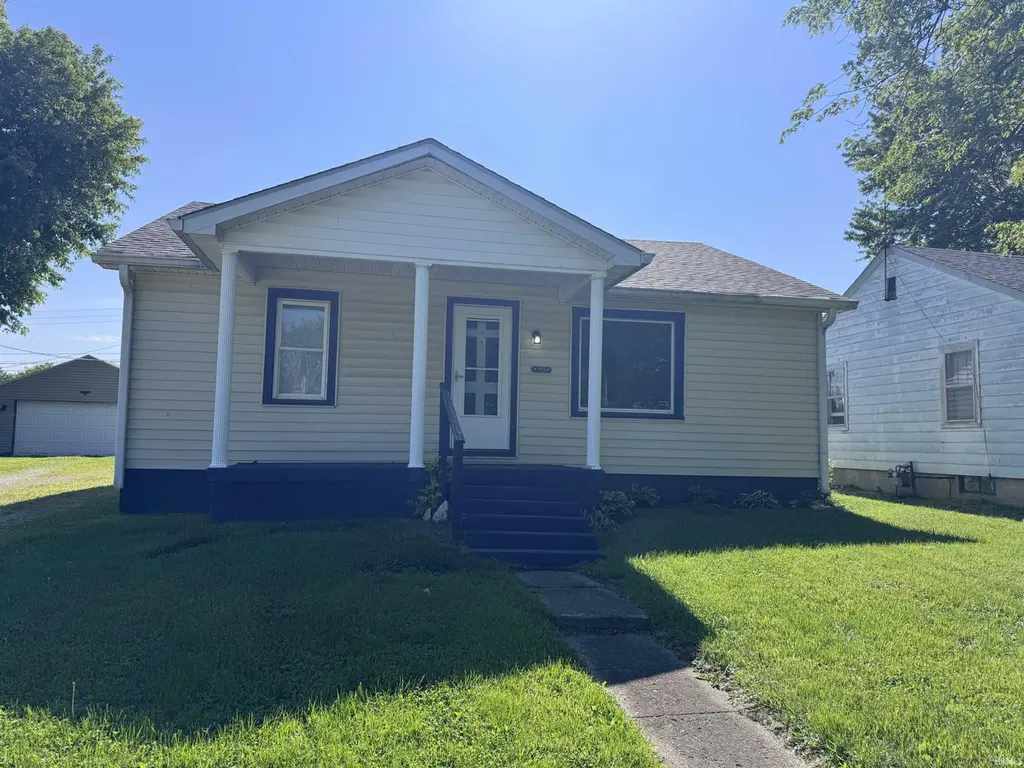
Adorable 2 bedroom, 1 bath home offering stylish vinyl plank flooring throughout and a full basement with washer/dryer hookups. Relax on the covered front porch or enjoy the spacious backyard with plenty of room for entertaining and outdoor fun. A great blend of comfort, functionality, and charm!
Key facts
- Covered front porch
- Spacious backyard
- Full basement
Tags
Property features AI
Exterior
- Utilities: Public water; Municipal sewer connected
- Home design: Single-family residence; One story
- Construction: Vinyl siding; Block and brick/mortar foundation
- Exterior features: Lot under 1/4 acre (0.14 acre)
Interior
- Kitchen: Kitchen (9x11); No appliances included
- Bedrooms: 2 bedrooms on the main level
- Bathrooms: 1 full bathroom on the main level
- Heating & cooling: Forced air heating (natural gas); No cooling
- Interior features: Attic access; Finished basement (has basement)
- Laundry & utility: No solid waste service listed
Neighborhood map
What this means for you Summary
Snapshot
- This is a 2-bed/1.0-bath single-family listed at $80k.
Deal economics
- At list price, monthly cash flow is $222 ($3k/yr) — positive.
- The deal already cash-flows at list — no discount required.
- Meets the 1% rule at list price ($961 rent vs $80k).
- Recommended offer: $79k (1.5% below list) — sets the bar for market timing.
- Cap rate 9.6% vs local median 6.0% in Muncie — top-decile yield for the area; either an underpriced asset or a hidden risk that comps aren't pricing in. Stress-test before assuming the spread holds.
Location & tenants
- Location reads 80/100 on livability (#18 in IN, #1,654 nationally) — a professional / high-income tenant draw. Strengths: amenities A+, commute A+, cost of living A+; Watch: crime F, employment F.
- Muncie Community Schools (urban): math 18% / reading 25% proficiency, ranked #275 of 301 in IN (top 91%) — low school quality limits family demand, transient renter base, plan for 1-2y turnover; 68% free/reduced lunch — lower-income household profile, screen leases tightly.
- Zoned schools: South View Elementary School (math 8% / reading 11%, grade F, #932 of 994 statewide, top 94%, 445 students, 92% FRL) — zoned schools average 92% FRL vs 68% district-wide (24 pts higher); higher-poverty schools than district average — tighter screening recommended.
- Zoned-school proficiency averages 10% at this address vs 22% district-wide (-12 pts) — the specific schools serving this property underperform the Muncie Community Schools average; the district grade overstates school quality for this exact location.
- Market conditions: Rents rising fast (+6.1%/yr); 148 active listings in the ZIP; 15 comparable units currently listed for rent nearby; rentals lingering (median 44d on market — plan ~5-8 weeks vacancy on turnover, expect pricing pressure); 100% of comp listings sitting > 30 days — soft ceiling on asking rent; 171 units permitted in Delaware County in 2024 (57 in 5+ unit buildings).
Forward outlook
- Local home prices are declining (-3.0%/yr); year-one equity from $552 of loan paydown is wiped out by about $2k of value loss. Plan a longer hold.
- Delaware County population projected at -11% by 2050 — secular population decline; favor cash flow + early exit over multi-decade hold.
- At projected returns (-3.0% appreciation + 6.1% rent growth), your $22k cash investment doubles in ~8 years — after that, you're playing with house money.
Negotiation context
- It's been on market 22 days — a 2% lower offer ($79k) is reasonable based on typical stale-listing flexibility.
- 3 sale attempts since 9y ago with the ask held roughly flat each time — persistent listings suggest the price (not the market) is what's stuck; bring a comps-based counter.
- Current owner paid $15k; list at $80k implies a 433% gain — meaningful room to come down on a strong offer.
Risks & watch-outs
- Watch-outs: built in 1947 — expect roof / HVAC / electrical / plumbing capex.
Questions for the listing agent
- Built in 1947 — when were the roof, HVAC, electrical panel, plumbing, and water heater last replaced?
- Is there a deadline driving the sale (1031 exchange, divorce, estate, relocation)? That informs how much negotiation room exists.
- Schools are D-rated, which usually means shorter tenancies and higher turnover. Who's the typical renter profile here, and what's been the actual vacancy rate?
- Crime grade is F in this area — have there been break-ins, vandalism, or insurance claims at this property in the last 3 years? What carrier currently insures it and at what premium?
- What's the average days-on-market for RENTAL listings here right now (not sales)? A rising rental-DOM trend means longer vacancies and softer asking-rent achievability than the comps imply.
- What's the recent tenant-quality profile in this submarket — average credit score on applications, eviction rate, late-payment / NSF rate, and stable-employment percentage? A property-management company in the area should have these aggregated.
- How much new for-sale + rental construction is in the pipeline within 1–3 miles? Heavy new supply typically softens prices + rents 12–24 months out; constrained supply supports both.
Investment metrics
- 1% rule
- 1.20% ✓
- Cap rate
- 9.63%
- Cash-on-cash
- 11.93%
- DSCR
- 1.53
- GRM
- 6.9
CMA / ARV
- ARV (on-the-fly)
- $88,320
- Comps found
- 12
Show comp detail 12 sales within ~0.75 mi
| Address | Dist | Beds/Ba | Sqft | Sold | Price | $/sf | Match |
|---|---|---|---|---|---|---|---|
| 1501 S Biltmore Ave | 0.19mi | 2/1.0 | 980 (+2%) | 8mo | $89,900 | $92 | 82 |
| 2624 E Memorial Dr | 0.22mi | 2/1.0 | 940 (-2%) | 12mo | $23,000 | $24 | 76 |
| 1512 S Wall Ave | 0.32mi | 2/1.0 | 912 (-5%) | 4mo | $62,500 | $69 | 74 |
| 3414 E 14th St | 0.36mi | 2/1.0 | 936 (-2%) | 8mo | $81,952 | $88 | 73 |
| 1407 S Meeker Ave | 0.43mi | 2/1.0 | 980 (+2%) | 5mo | $110,000 | $112 | 72 |
| 1103 S Jersey Ave | 0.47mi | 2/1.0 | 952 (-1%) | 10mo | $69,900 | $73 | 68 |
| 2612 E Memorial Dr | 0.27mi | 2/1.0 | 852 (-11%) | 6mo | $89,000 | $104 | 63 |
| 2115 S Manville Rd | 0.44mi | 2/1.0 | 1,028 (+7%) | 9mo | $149,000 | $145 | 60 |
| 2014 E 13th St | 0.65mi | 3/1.0 (+1) | 958 (-0%) | 10mo | $63,000 | $66 | 56 |
| 2511 E 13th St | 0.36mi | 3/1.0 (+1) | 864 (-10%) | 7mo | $70,000 | $81 | 56 |
| 907 S Tennessee Ave | 0.53mi | 3/1.0 (+1) | 1,053 (+10%) | 9mo | $106,000 | $101 | 47 |
| 2625 S Meeker Ave | 0.69mi | 3/2.0 (+1) | 987 (+3%) | 12mo | $125,000 | $127 | 44 |
Match score weights: distance 35% · size 25% · config 20% · recency 20%. Top-matched comps best support the ARV.
Projected returns pro-forma
-3.0% appreciation · 6.11% rent growth · sell at horizon
- IRR
- 4.8%
- Equity multiple
- 1.19×
- Total profit
- $4,327
- Equity at exit
- $11,913
- IRR
- 16.9%
- Equity multiple
- 2.59×
- Total profit
- $35,602
- Equity at exit
- $6,908
Cash invested: $22,372 (down + closing). Projections, not guarantees.
Landlord ↔ Tenant lean methodology
- Overall (STATE)
- 90 Strongly Landlord-Friendly
- State Indiana
- 90 Strongly Landlord-Friendly · R+11
- County
- — inherits STATE
- City
- — inherits STATE
ZIP-level market 47302
- Home prices YoY
- -12.6%
- Rents YoY
- 6.1%
- Active inventory
- 148
- Price-to-rent
- 6.9×
Monthly cashflow live
- Estimated rent
- $961 high interval (Pro) →
- Mortgage (P&I)
- −$419
- Tax from tax record
- −$85 /mo · $1,018/yr
- Insurance
- −$33
- HOA
- −$0
- Vacancy / Maint / Mgmt
- −$202
- Net cashflow
- $222
Break-even live
Sensitivity live
| Price | -10% $268 | -5% $245 | +0% $222 | +5% $200 | +10% $177 |
|---|---|---|---|---|---|
| Rent | -10% $146 | -5% $184 | +0% $222 | +5% $260 | +10% $298 |
| Rate | -1.0pp $263 | -0.5pp $243 | base $222 | +0.5pp $202 | +1.0pp $181 |
UW: 25.0% down · 7.5% · 30yr · 1.5% tax · 5.0% vac · 8.0% maint · 8.0% mgmt
Financing live
Cash to close
- Down payment
- $19,975
- Closing costs
- $2,397
- Reserves months
- —
- Total cash needed
- —
Loan-product check · same deal, 3 products live
Conventional
25% down · 7.5% · 30yr
- Down + closing
- —
- Monthly P&I
- —
- Monthly cashflow
- —
- DSCR
- —
- Eligible?
- —
Personal DTI + credit; lowest rate.
DSCR
20% down · 8.5% · 30yr
- Down + closing
- —
- Monthly P&I
- —
- Monthly cashflow
- —
- DSCR
- —
- Eligible?
- —
No personal income docs; deal must DSCR.
Hard money
10% down · 12.0% · 12mo
- Down + closing
- —
- Monthly P&I
- —
- Monthly cashflow
- —
- DSCR
- —
- Eligible?
- —
Short-term bridge; refi at stabilization.
Rent comps 15 comps
| Address | Beds | Baths | Sqft | Rent | $/sqft | DOM | Units | Dist |
|---|---|---|---|---|---|---|---|---|
| 3508 E Memorial Dr Muncie, IN | 2.0–3.0 | 1.0–2.0 | 1029 | $429 | $0.42 | 44d | 7 | 0.30mi |
| 1804 S Wall Ave Muncie, IN | 2.0 | 1.0 | 900 | $899 | $1.00 | 44d | 1 | 0.33mi |
| 2213 E Memorial Dr Muncie, IN | 2.0 | 1.0–2.0 | 997 | $1,078 | $1.08 | 44d | 1 | 0.55mi |
| 1703 E 14th St Apt 15 Muncie, IN | 2.0 | 1.0 | 756 | $777 | $1.03 | 44d | 1 | 0.88mi |
| 1806 E 18th St Muncie, IN | 3.0 | 1.0 | 865 | $1,100 | $1.27 | 44d | 1 | 0.91mi |
| 2808 S Brotherton St Muncie, IN | 2.0 | 1.0 | 966 | $825 | $0.85 | 44d | 1 | 1.07mi |
| 305 N Biltmore Ave Muncie, IN | 2.0 | 1.0 | 912 | $1,186 | $1.30 | 44d | 1 | 1.08mi |
| 1311 E 11th St Unit 2 Muncie, IN | 1.0 | 1.0 | 672 | $715 | $1.06 | 44d | 1 | 1.12mi |
| 1521 E Kirby Ave Muncie, IN | 2.0–4.0 | 1.0–2.0 | 972 | $800 | $0.82 | 44d | 2 | 1.15mi |
| 1310 E 5th St Muncie, IN | 3.0 | 1.0 | 864 | $1,300 | $1.50 | 44d | 1 | 1.16mi |
| 1901 E 26th St Unit 5 Muncie, IN | 2.0 | 1.0 | 600 | $865 | $1.44 | 44d | 1 | 1.35mi |
| 1307 S Ebright St Unit 2 Muncie, IN | 1.0 | 1.0 | 630 | $695 | $1.10 | 44d | 1 | 1.37mi |
| 1109 E Kirby Ave Muncie, IN | 2.0–3.0 | 1.0 | 971 | $835 | $0.86 | 44d | 2 | 1.37mi |
| 9901 N State St Muncie, IN | 3.0 | 2.0 | 1136 | $1,110 | $0.98 | 44d | 5 | 1.41mi |
| 2302 S Hackley St Muncie, IN | 2.0 | 1.0 | 870 | $1,199 | $1.38 | 44d | 1 | 1.43mi |
Listing history 17 events
-
2026-06-15days on market $79,900 Active 22 DOM
-
2026-06-14days on market $79,900 Active 20 DOM
-
2026-06-13days on market $79,900 Active 19 DOM
-
2026-06-10days on market $79,900 Active 17 DOM
-
2026-06-09days on market $79,900 Active 16 DOM
-
2026-06-08days on market $79,900 Active 15 DOM
-
2026-06-07days on market $79,900 Active 14 DOM
-
2026-06-05days on market $79,900 Active 11 DOM
-
2026-06-03days on market $79,900 Active 10 DOM
-
2026-06-02days on market $79,900 Active 9 DOM
-
2026-06-01days on market $79,900 Active 8 DOM
-
2026-05-31days on market $79,900 Active 7 DOM
-
2026-05-30days on market $79,900 Active 6 DOM
-
2026-05-23$79,900 Active
Show marketing remark (297 chars)
Adorable 2 bedroom, 1 bath home offering stylish vinyl plank flooring throughout and a full basement with washer/dryer hookups. Relax on the covered front porch or enjoy the spacious backyard with plenty of room for entertaining and outdoor fun. A great blend of comfort, functionality, and charm!
-
2026-05-23$79,900 Active 297-char remark
Show marketing remark (297 chars)
Adorable 2 bedroom, 1 bath home offering stylish vinyl plank flooring throughout and a full basement with washer/dryer hookups. Relax on the covered front porch or enjoy the spacious backyard with plenty of room for entertaining and outdoor fun. A great blend of comfort, functionality, and charm!
-
2017-10-31soldstatus $15,000 475-char remark
Show marketing remark (475 chars)
Maintained Rental on a quiet residential street. Current tenant on a month to month lease at $500 a month which includes utilities. Would like to stay. Tenant does have pets. Back yard it immediately adjacent to Sutton (now former) Elementary. Easy access to Memorial Dr. and Muncie Bypass. Full basement. Appliances belong to the tenant so none will remain. Owner reports newer furnace and water heater, sump pump. A/C can be added. Shared driveway with north side neighbor.
-
2017-05-27$19,988 475-char remark
Show marketing remark (475 chars)
Maintained Rental on a quiet residential street. Current tenant on a month to month lease at $500 a month which includes utilities. Would like to stay. Tenant does have pets. Back yard it immediately adjacent to Sutton (now former) Elementary. Easy access to Memorial Dr. and Muncie Bypass. Full basement. Appliances belong to the tenant so none will remain. Owner reports newer furnace and water heater, sump pump. A/C can be added. Shared driveway with north side neighbor.
ⓘ Source: listings_history table (triggers on properties + properties_extension) + one-shot
backfill from property_details.listing_events for pre-trigger history.
Tax reassessment forecast IN · Partial reset (capped growth)
- Current annual tax
- $1,018 · $85/mo
- Projected year-2 tax
- $1,018 · $85/mo
- Expected delta
- $0/yr ($0/mo · 0.0%)
ⓘ Screening estimate from a state-policy table — verify with the county assessor before closing.
Climate risk First Street
- Flood 1/10 Low FEMA zone X (unshaded) · 0% chance over 30 yrs
- Wildfire 1/10 Low
- Heat 3/10 Moderate 7 d/yr ≥101°F today · 18 d/yr by 30 yrs out
- Wind 2/10 Low 100% chance of damaging wind over 30 yrs
- Air quality 3/10 Moderate 2 unhealthy d/yr today · 3 by 30 yrs out
Nearby sold comps map
Loading sold comps map…
Walkable amenities ~0.75 mi
Loading nearby amenities…
Taxation est. · year 1
- Rental income
- $11,538
- − Mortgage interest
- −$4,476
- − Property taxes
- −$1,018
- − Insurance
- −$400
- − Repairs & maintenance
- −$923
- − Management
- −$923
- − Depreciation
- −$2,324
- Taxable income
- $1,474
- Est. tax owed @ 24.0%
- −$354
- After-tax cash flow
- $2,315/yr
For passive investors: Depreciation is non-cash, so a rental often shows a tax loss while cash-flowing — sheltering income. Rental losses are passive: they offset passive income freely, and up to $25,000/yr can offset ordinary (W-2) income if you actively participate and your MAGI is under $100k (phasing out to $0 by $150k); unused losses carry forward. On sale, claimed depreciation is recaptured at up to 25%, and gains may owe capital-gains tax (a 1031 exchange can defer both). Figures are a year-1 estimate at your 24.0% rate — not tax advice; consult a CPA.
Schools (NCES district)
- District
- Muncie Community Schools
- NCES district ID
- 1807320
- Math proficiency
- 18% ▼ -9.00%
- Reading proficiency
- 25% ▼ -4.00%
- Median HH income
- $30,052
- Composite
- 17.22/100
- National rank
- #9099
- State rank
- #275 of 301 in IN
Livability — Muncie
- Score
- 80/100
- State rank
- #18
- US rank
- #1654
Category grades
Schools grade is shown separately in the Schools card above.
Census & demographics
- Census place
- Muncie, IN
- County
- Delaware County · 84,658 people
- City population
- 84,658
- Metro
- Muncie, IN
- Population (ZIP)
- 25,473
- Household income
- $47,837
- Rent vs Own
- Severe rent burden
- 1150.0
Population outlook (Delaware County) Hauer SSP2
- Today (2025)
- 113,036 people
- By 2030
- 111,313 · -1.5%
- By 2040
- 106,432 · -5.8%
- By 2050
- 100,747 · -10.9%
- By 2075
- 91,000 · -19.5%
- By 2100
- 80,687 · -28.6%
Race, ethnicity, and origin ACS 2023
- Neighborhood character
- Predominantly White (84%)
- Race & ethnicity
- White 84% Two or more races 6% Black 6% Hispanic / Latino 4%
- Common ancestry
- Italian 2% Slovak 1% Romanian 1%
- Foreign-born
- 1% · Canada
- Languages at home
- 98% English-only · Spanish 1% German/W. Germanic 1%
Political lean MEDSL · Delaware
- 2024 margin
- R (+15.8) · D 41.2% · R 57.0% · Other 1.8%
- 2008→2024 swing
- -30.8pp toward R · 2008: 15.0pp · 2024: -15.8pp
- All cycles
- 2024: R+15.8 2020: R+13.2 2016: R+13.7 2012: D+3.1 2008: D+15.0
Not yet ingested
- Civics
- —
Market trends
- HPI YoY
- ▼ -30.32%
- Current HPI
- 210.431
- Rent YoY
- ▲ 6.11%
- Metro
- Muncie, IN
- State GDP YoY
- ▲ 2.90%
- F500 in state
- 18
Industry mix (Fortune 500 HQ in IN)
| Industry | F500 HQs | Revenue |
|---|---|---|
| Industrial Machinery | 2 | $37B |
|
||
| Healthcare | 1 | $177B |
|
||
| Pharmaceuticals | 1 | $45B |
|
||
| Metals / Steel | 1 | $18B |
|
||
| Agriculture | 1 | $17B |
|
||
| Packaging | 1 | $12B |
|
||
Price history
+299.7% since first listed4 events — show timeline
- 2026-05-23 Listed $79,900 IRMLS
- 2026-05-23 Listed $79,900 MIBOR as Distributed by MLS Grid
- 2017-10-31 Sold (MLS) $15,000 IRMLS
- 2017-05-27 Listed $19,988 IRMLS
Property tax history
-7.2%/yrLatest (2024): $1,018 · +42.6% YoY. Source: county tax records.
Cash-flow waterfall
monthlySold comps — $/sqft
last 12 mo · ≤1 miLoading sold comps…