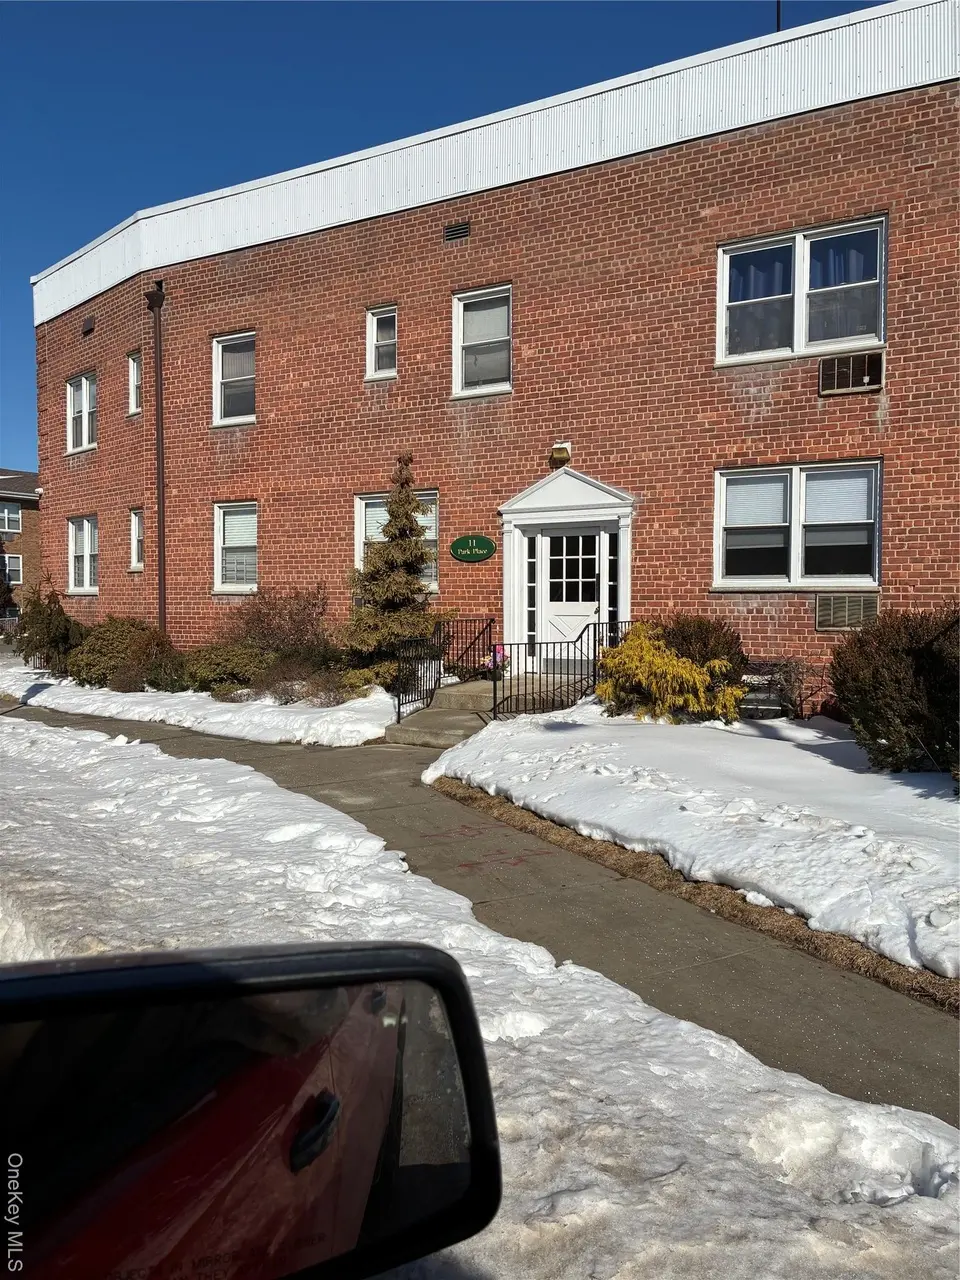
11 Park Pl Unit 2D · Rockville Centre, NY
Flood risk 1/10 · Minimal
- FEMA flood zone
- X (unshaded)
- Chance of flooding over 30 yrs
- 0.0%
- Est. flood insurance / yr
- $473 – $860
Fire risk 1/10 · Minimal
- Est. fire insurance / yr
- $691 – $1,283
Heat risk 6/10 · Moderate
- Hot days now (above 97°F)
- 7 days/yr
- Hot days in 30 yrs
- 16 days/yr
Wind risk 6/10 · Moderate
- Chance of severe wind over 30 yrs
- 69.0%
Air-quality risk 4/10 · Minor
- Unhealthy air days now
- 5 days/yr
- Unhealthy air days in 30 yrs
- 8 days/yr
Risk factors via First Street. Map © Google.
Why this score? — see what drove the D+ grade
The composite is a weighted blend of 9 inputs, each scored 0–100. Each bar is that input's sub-score; the figure is the points it added to the 100-point composite (weight × sub-score).
- Cash flow +10.0/30.0
- 1% rule +10.0/10.0
- ARV discount +7.5/15.0
- Schools +7.4/10.0
- Livability +4.3/5.0
- DSCR +2.8/10.0
- Rent growth +2.5/5.0
- Condition / age +2.0/5.0
- Appreciation +0.0/10.0
$159,000
🖨 Deal sheet 📄 Offer letter ✓ Due diligence
Listing remarks MLS
News Alert! Attention Investment Entrepreneurs, we have a spectacular deal you will not want to miss. Sought after 11 Park Place, Rockville Centre, occupied, rent stabilized 1-bedroom, 1 full bath. Longtime tenants priced below market value, $159,000. *The property cannot be shown.
Key facts
- Built 1960
- Listed 133 days
Neighborhood map
What this means for you Summary
Snapshot
- This is a 1-bed/1.0-bath condo listed at $159k. Condition is rated fair.
Deal economics
- At list price, monthly cash flow is $-97 ($-1k/yr) — negative.
- The deal already cash-flows at list — no discount required.
- Meets the 1% rule at list price ($3k rent vs $159k).
- Recommended offer: $140k (12.0% below list) — sets the bar for market timing.
- Cap rate 5.6% vs local median 2.5% in Rockville Centre — top-decile yield for the area; either an underpriced asset or a hidden risk that comps aren't pricing in. Stress-test before assuming the spread holds.
Location & tenants
- Location reads 86/100 on livability (#17 in NY, #365 nationally) — a professional / high-income tenant draw. Strengths: schools A+, amenities A+, commute A+; Watch: cost of living F.
- Rockville Centre Union Free School District (suburban): math 82% / reading 82% proficiency, ranked #37 of 590 in NY (top 6%) — strong family-tenant draw, lease renewals of 3-5y typical; only 9% free/reduced lunch — higher-income household profile.
- Market conditions: 143 active listings in the ZIP; 7 comparable units currently listed for rent nearby; rentals at typical pace (median 25d on market — plan ~3-4 weeks tenant-placement turnaround); high-income renter base; 824 units permitted in Nassau County in 2024 (153 in 5+ unit buildings).
Forward outlook
- Local home prices are declining (-3.0%/yr); year-one equity from $1k of loan paydown is wiped out by about $5k of value loss. Plan a longer hold.
- Nassau County population projected at +7% by 2050 — modest demand growth; plan on rents tracking national, not racing it.
Negotiation context
- It's been on market 133 days — a 12% lower offer ($140k) is reasonable based on typical stale-listing flexibility.
Risks & watch-outs
- Watch-outs: HOA is 44% of rent.
- Climate carrying-cost: major wind risk, 69% chance of damaging wind over 30y; extreme-heat days projected 7→16/yr by 2055 (HVAC capex compounding) — expect insurance premiums to compound above CPI over the hold.
Questions for the listing agent
- What do current leases actually rent for vs. the listed asking? Can we see a recent rent roll and the last 12 months of T-12 income?
- It's been on market 133 days. Have you received any prior offers? Is the seller open to a 12% concession, seller financing, or rate buy-down credit?
- Have any recent inspections been done? Can we get a copy of the seller's disclosures and any deferred-maintenance estimates?
- Built in 1960 — when were the roof, HVAC, electrical panel, plumbing, and water heater last replaced?
- What does the HOA fee cover, when was the last increase, and are there any pending special assessments or reserve-fund shortfalls?
- Any open or pending special assessments — roof, HVAC, plumbing, elevator, façade? What's the per-unit balance and payoff schedule, and is the seller paying it off at close or rolling it to the buyer?
- Why hasn't it sold? Are there any deal-killer items the seller is aware of (foundation, flood, title, zoning, code violations)?
- Is there a deadline driving the sale (1031 exchange, divorce, estate, relocation)? That informs how much negotiation room exists.
- Schools are A-rated — typically a magnet for longer-tenancy family renters. What's the average tenant stay here, and is there a school-zone premium baked into asking?
- The area grade is low — what's the realistic commute time and amenity access for the typical tenant pool here? Any planned neighborhood developments (good or bad) we should know about?
- What's the average days-on-market for RENTAL listings here right now (not sales)? A rising rental-DOM trend means longer vacancies and softer asking-rent achievability than the comps imply.
- What's the recent tenant-quality profile in this submarket — average credit score on applications, eviction rate, late-payment / NSF rate, and stable-employment percentage? A property-management company in the area should have these aggregated.
- How much new apartment / multifamily construction is in the pipeline within 1–3 miles? Heavy new supply (>2% of stock underway) typically softens rents 12–24 months out; light construction supports rent growth.
Investment metrics
- 1% rule
- 1.81% ✓
- Cap rate
- 5.56%
- Cash-on-cash
- -2.62%
- DSCR
- 0.88
- GRM
- 4.6
CMA / ARV
- ARV (median comp)
- $381,057
- List price
- $159,000
- Delta
- -58.27%
- Verdict
- UNDERPRICED
- Comps
- 20 within 1.0 mi
Projected returns pro-forma
-3.0% appreciation · 3.0% rent growth · sell at horizon
- IRR
- -19.9%
- Equity multiple
- 0.30×
- Total profit
- $-31,121
- Equity at exit
- $23,707
- IRR
- -11.6%
- Equity multiple
- 0.29×
- Total profit
- $-31,711
- Equity at exit
- $13,747
Cash invested: $44,520 (down + closing). Projections, not guarantees.
Landlord ↔ Tenant lean methodology
- Overall (STATE)
- 15 Strongly Tenant-Friendly
- State New York
- 15 Strongly Tenant-Friendly · D+10
- County
- — inherits STATE
- City
- — inherits STATE
ZIP-level market 11570
- Active inventory
- 143
- Price-to-rent
- 4.6×
Monthly cashflow live
- Estimated rent
- $2,876 high interval (Pro) →
- Mortgage (P&I)
- −$834
- Tax est. 1.5%
- −$199 /mo · $2,385/yr
- Insurance
- −$66
- HOA est. from 1 same-building comp
- −$1,270
- Vacancy / Maint / Mgmt
- −$604
- Net cashflow
- $-97
Break-even live
UW: 25.0% down · 7.5% · 30yr · 1.5% tax · 5.0% vac · 8.0% maint · 8.0% mgmt
Financing live
Cash to close
- Down payment
- $39,750
- Closing costs
- $4,770
- Reserves months
- —
- Total cash needed
- —
Loan-product check · same deal, 3 products live
Conventional
25% down · 7.5% · 30yr
- Down + closing
- —
- Monthly P&I
- —
- Monthly cashflow
- —
- DSCR
- —
- Eligible?
- —
Personal DTI + credit; lowest rate.
DSCR
20% down · 8.5% · 30yr
- Down + closing
- —
- Monthly P&I
- —
- Monthly cashflow
- —
- DSCR
- —
- Eligible?
- —
No personal income docs; deal must DSCR.
Hard money
10% down · 12.0% · 12mo
- Down + closing
- —
- Monthly P&I
- —
- Monthly cashflow
- —
- DSCR
- —
- Eligible?
- —
Short-term bridge; refi at stabilization.
Rent comps 7 comps
| Address | Beds | Baths | Sqft | Rent | $/sqft | DOM | Units | Dist |
|---|---|---|---|---|---|---|---|---|
| 80 N Centre Ave Rockville Centre, NY | 3.0 | 1.0–3.5 | 1254 | $3,962 | $3.16 | 1d | 1 | 0.48mi |
| 91 Grand Ave Rockville Centre, NY | — | 1.0 | 523 | $2,025 | $3.87 | 43d | 1 | 0.62mi |
| 8 Roswell Ave Oceanside, NY | 2.0 | 1.5 | 741 | $3,100 | $4.18 | 24d | 1 | 0.71mi |
| 275 Maple Ave Apt 6D Rockville Centre, NY | 2.0 | 1.0 | 673 | $2,875 | $4.27 | 24d | 1 | 0.89mi |
| 108 Earle Ave Lynbrook, NY | 1.0 | 1.0 | 500 | $2,500 | $5.00 | 24d | 1 | 1.03mi |
| 318 Earle Ave Unit 2 Lynbrook, NY | 1.0 | 1.0 | 600 | $2,500 | $4.17 | 24d | 1 | 1.25mi |
| 157 Hempstead Ave Unit B6 Lynbrook, NY | 1.0 | 1.0 | 700 | $2,700 | $3.86 | 24d | 1 | 1.38mi |
HOA detail condo
- Monthly dues
- $0 · $0/yr
- Assessments
- None detected in remarks — confirm with the listing agent.
Listing history 15 events
-
2026-06-18days on market $159,000 Active 133 DOM
-
2026-06-17days on market $159,000 Active 132 DOM
-
2026-06-16days on market $159,000 Active 131 DOM
-
2026-06-15days on market $159,000 Active 130 DOM
-
2026-06-13days on market $159,000 Active 128 DOM
-
2026-06-13days on market $159,000 Active 127 DOM
-
2026-06-09days on market $159,000 Active 124 DOM
-
2026-06-08days on market $159,000 Active 123 DOM
-
2026-06-07days on market $159,000 Active 122 DOM
-
2026-06-04days on market $159,000 Active 119 DOM
-
2026-06-03days on market $159,000 Active 118 DOM
-
2026-06-02days on market $159,000 Active 117 DOM
-
2026-06-01days on market $159,000 Active 116 DOM
-
2026-05-31days on market $159,000 Active 115 DOM
-
2026-02-05$159,000 Active 282-char remark
Show marketing remark (282 chars)
News Alert! Attention Investment Entrepreneurs, we have a spectacular deal you will not want to miss. Sought after 11 Park Place, Rockville Centre, occupied, rent stabilized 1-bedroom, 1 full bath. Longtime tenants priced below market value, $159,000. *The property cannot be shown.
ⓘ Source: listings_history table (triggers on properties + properties_extension) + one-shot
backfill from property_details.listing_events for pre-trigger history.
Climate risk First Street
- Flood 1/10 Low FEMA zone X (unshaded) · 0% chance over 30 yrs
- Wildfire 1/10 Low
- Heat 6/10 Major 7 d/yr ≥97°F today · 16 d/yr by 30 yrs out
- Wind 6/10 Major 69% chance of damaging wind over 30 yrs
- Air quality 4/10 Moderate 5 unhealthy d/yr today · 8 by 30 yrs out
Nearby sold comps map
Loading sold comps map…
Walkable amenities ~0.75 mi
Loading nearby amenities…
Taxation est. · year 1
- Rental income
- $34,508
- − Mortgage interest
- −$8,906
- − Property taxes
- −$2,385
- − Insurance
- −$795
- − Repairs & maintenance
- −$2,761
- − Management
- −$2,761
- − HOA
- −$15,240
- − Depreciation
- −$4,625
- Taxable loss
- −$2,965
- Est. tax savings @ 24.0%
- +$712
- After-tax cash flow
- $-453/yr
For passive investors: Depreciation is non-cash, so a rental often shows a tax loss while cash-flowing — sheltering income. Rental losses are passive: they offset passive income freely, and up to $25,000/yr can offset ordinary (W-2) income if you actively participate and your MAGI is under $100k (phasing out to $0 by $150k); unused losses carry forward. On sale, claimed depreciation is recaptured at up to 25%, and gains may owe capital-gains tax (a 1031 exchange can defer both). Figures are a year-1 estimate at your 24.0% rate — not tax advice; consult a CPA.
Condition & rehab AI · 0 photos
This 1-bedroom condo requires significant renovations, particularly in the kitchen and bathroom, to improve its condition and value.
Repairs flagged
- Major Kitchen countertops — Significant wear and tear, likely requiring replacement.
- Major Bathroom fixtures — Outdated and in need of replacement.
- Major Exterior siding — Weathered and in need of repainting or replacement.
- Major Flooring — Worn and may need replacement.
- Major Interior walls — Significant discoloration and potential damage.
Value-add opportunities
- Both Kitchen renovation — A fresh kitchen will attract both buyers and renters, increasing both resale and rental value.
- Both Bathroom renovation — Upgrading the bathroom will enhance the home's appeal and increase its value.
- Both Exterior painting and landscaping — A fresh exterior and well-maintained landscaping will improve curb appeal and attract more interest.
Renovation cost estimate screening
| Repair item | Severity | Est. cost |
|---|---|---|
| Kitchen countertops · Significant wear and tear, likely requiring replacement. | Major | $15,000–50,000 |
| Bathroom fixtures · Outdated and in need of replacement. | Major | $15,000–50,000 |
| Exterior siding · Weathered and in need of repainting or replacement. | Major | $15,000–50,000 |
| Flooring · Worn and may need replacement. | Major | $15,000–50,000 |
| Interior walls · Significant discoloration and potential damage. | Major | $15,000–50,000 |
| Total estimated repair cost · 5 items | $75,000–250,000 |
Value-add ROI direction
- Both Kitchen renovation — A fresh kitchen will attract both buyers and renters, increasing both resale and rental value. ↑
- Both Bathroom renovation — Upgrading the bathroom will enhance the home's appeal and increase its value. ↑
- Both Exterior painting and landscaping — A fresh exterior and well-maintained landscaping will improve curb appeal and attract more interest. ↑
ⓘ Cost ranges are severity-bucket heuristics (US national rule-of-thumb). Get contractor quotes + a written scope before underwriting a rehab budget.
Schools (NCES district)
- District
- Rockville Centre Union Free School District
- NCES district ID
- 3624780
- Math proficiency
- 82% ▲ 3.00%
- Reading proficiency
- 82% ▲ 2.00%
- Median HH income
- $102,401
- Composite
- 74.33/100
- National rank
- #162
- State rank
- #37 of 590 in NY
Livability — Rockville Centre
- Score
- 86/100
- State rank
- #17
- US rank
- #365
Category grades
Schools grade is shown separately in the Schools card above.
Census & demographics
- Census place
- Rockville Centre, NY
- County
- Nassau County · 653,051 people
- City population
- 28,908
- Metro
- New York-Newark-Jersey City, NY-NJ-PA
- Population (ZIP)
- 28,908
- Household income
- $157,163
- Rent vs Own
- Severe rent burden
- 732.0
Population outlook (Nassau County) Hauer SSP2
- Today (2025)
- 1,409,302 people
- By 2030
- 1,431,482 · +1.6%
- By 2040
- 1,471,607 · +4.4%
- By 2050
- 1,502,845 · +6.6%
- By 2075
- 1,575,403 · +11.8%
- By 2100
- 1,554,356 · +10.3%
Race, ethnicity, and origin ACS 2023
- Neighborhood character
- Predominantly White (74%)
- Race & ethnicity
- White 74% Hispanic / Latino 12% Two or more races 7% Black 5% Asian 5%
- Hispanic origin (detail)
- Puerto Rican 2% Dominican 4%
- Common ancestry
- Romanian 4% Scotch-Irish 4% Subsaharan African 1%
- Foreign-born
- 12% · Canada, China, South Korea
- Languages at home
- 84% English-only · Spanish 8% Other Indo-European 5% Chinese 1%
Political lean MEDSL · Nassau
- 2024 margin
- Toss-up / Even · D 47.9% · R 52.1%
- 2008→2024 swing
- -12.6pp toward R · 2008: 8.4pp · 2024: -4.2pp
- All cycles
- 2024: R+4.2 2020: D+9.5 2016: D+5.3 2012: D+6.7 2008: D+8.4
Not yet ingested
- Civics
- —
Market trends
- HPI YoY
- ▼ -731.15%
- Current HPI
- 275.9882
- Rent YoY
- —
- Metro
- New York-Newark-Jersey City, NY-NJ-PA
- State GDP YoY
- ▲ 2.60%
- F500 in state
- 92
Industry mix (Fortune 500 HQ in NY)
| Industry | F500 HQs | Revenue |
|---|---|---|
| Financial Services | 10 | $950B |
|
||
| Consumer Goods | 9 | $162B |
|
||
| Insurance | 4 | $225B |
|
||
| Telecommunications | 2 | $144B |
|
||
| Pharmaceuticals | 2 | $112B |
|
||
| Media / Entertainment | 2 | $69B |
|
||
Price history
1 event — show timeline
- 2026-02-05 Listed $159,000 OneKey® MLS as Distributed by MLS Grid
Cash-flow waterfall
monthlySold comps — $/sqft
last 12 mo · ≤1 miLoading sold comps…