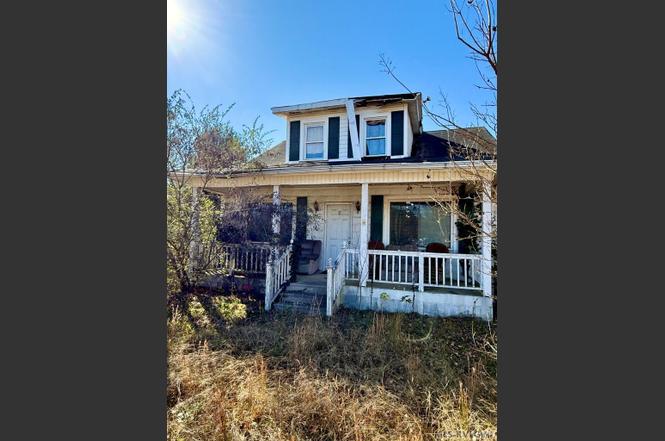
1406 Elm St · South Weldon, NC
Flood risk 1/10 · Minimal
- FEMA flood zone
- X (unshaded)
- Chance of flooding over 30 yrs
- 0.0%
- Est. flood insurance / yr
- $473 – $860
Fire risk 4/10 · Minor
- Est. fire insurance / yr
- $906 – $1,684
Heat risk 7/10 · Major
- Hot days now (above 107°F)
- 7 days/yr
- Hot days in 30 yrs
- 16 days/yr
Wind risk 6/10 · Moderate
- Chance of severe wind over 30 yrs
- 65.0%
Air-quality risk 1/10 · Minimal
- Unhealthy air days now
- 0 days/yr
- Unhealthy air days in 30 yrs
- 0 days/yr
Risk factors via First Street. Map © Google.
Why this score? — see what drove the B grade
The composite is a weighted blend of 9 inputs, each scored 0–100. Each bar is that input's sub-score; the figure is the points it added to the 100-point composite (weight × sub-score).
- Cash flow +30.0/30.0
- 1% rule +10.0/10.0
- DSCR +10.0/10.0
- ARV discount +7.5/15.0
- Appreciation +5.0/10.0
- Livability +2.9/5.0
- Rent growth +2.5/5.0
- Condition / age +2.5/5.0
- Schools +1.1/10.0
$55,000
🖨 Deal sheet 📄 Offer letter ✓ Due diligence
Listing remarks MLS
Cute bunaglow. Some remodeling has begun and there is some more needed. Lots of extra rooms for storage, office space, or small bonus rooms. Large lot with small shed. Must see.
Key facts
- Public sewer
- No hoa
- Public water
Tags
Property features AI
Exterior
- Utilities: Public water; Public sewer
- Home design: Residential property; Residential/Vacation subtype; One and a half stories; Block construction
- Construction: Block construction; Composition roof; Built on slab or no basement
- Exterior features: Front porch; Storm doors; Composition roof; Paved road; Property has a view
Interior
- Kitchen: No appliances included
- Flooring: Wood floors
- Bathrooms: Two full bathrooms
- Heating & cooling: No heating; No cooling
- Interior features: Storm windows; Wood flooring; No fireplace
- Laundry & utility: No built-in appliances listed
Neighborhood map
What this means for you Summary
Snapshot
- This is a 3-bed/1.0-bath single-family listed at $55k.
Deal economics
- At list price, monthly cash flow is $515 ($6k/yr) — positive.
- The deal already cash-flows at list — no discount required.
- Meets the 1% rule at list price ($1k rent vs $55k).
- Recommended offer: $48k (12.0% below list) — sets the bar for market timing.
Location & tenants
- Location reads 58/100 on livability (#585 in NC) — a working-class tenant base; expect higher turnover. Strengths: cost of living A+, housing A+; Watch: crime F, amenities F, commute F.
- Weldon City Schools (town): math 10% / reading 17% proficiency, ranked #178 of 178 in NC (top 100%) — low school quality limits family demand, transient renter base, plan for 1-2y turnover; 87% free/reduced lunch — lower-income household profile, screen leases tightly.
- Zoned schools: Weldon Elementary Global Academy (math 8% / reading 17%, grade F, #1,362 of 1,410 statewide, top 97%, 244 students, 99% FRL); Weldon Middle (math 8% / reading 17%, grade F, #469 of 475 statewide, top 99%, 176 students, 98% FRL); Weldon Stem High School Career Academies (math 5% / reading 10%, grade F, #531 of 535 statewide, top 99%, 120 students, 98% FRL).
- Market conditions: 6 active listings in the ZIP; 55 units permitted in Halifax County in 2024 (0 in 5+ unit buildings).
Forward outlook
- In year one you build about $326 of equity ($380 loan paydown + $-54 appreciation (-0.1% local appreciation)).
- Halifax County population projected at -27% by 2050 — secular population decline; favor cash flow + early exit over multi-decade hold.
- At projected returns (-0.1% appreciation + 3.0% rent growth), your $15k cash investment doubles in ~3 years — after that, you're playing with house money.
Negotiation context
- It's been on market 207 days — a 12% lower offer ($48k) is reasonable based on typical stale-listing flexibility.
- 3 sale attempts since 10y ago; this cycle's ask has dropped $20k (27%) from the opening price — seller is motivated, your offer sets the floor, not the list.
- Current owner paid $20k; list at $55k implies a 175% gain — meaningful room to come down on a strong offer.
Risks & watch-outs
- Watch-outs: built in 1946 — expect roof / HVAC / electrical / plumbing capex.
- Climate carrying-cost: major wind risk, 65% chance of damaging wind over 30y; extreme-heat days projected 7→16/yr by 2055 (HVAC capex compounding) — expect insurance premiums to compound above CPI over the hold.
Questions for the listing agent
- It's been on market 207 days. Have you received any prior offers? Is the seller open to a 12% concession, seller financing, or rate buy-down credit?
- Built in 1946 — when were the roof, HVAC, electrical panel, plumbing, and water heater last replaced?
- Why hasn't it sold? Are there any deal-killer items the seller is aware of (foundation, flood, title, zoning, code violations)?
- Is there a deadline driving the sale (1031 exchange, divorce, estate, relocation)? That informs how much negotiation room exists.
- Schools are F-rated, which usually means shorter tenancies and higher turnover. Who's the typical renter profile here, and what's been the actual vacancy rate?
- Crime grade is F in this area — have there been break-ins, vandalism, or insurance claims at this property in the last 3 years? What carrier currently insures it and at what premium?
- What's the average days-on-market for RENTAL listings here right now (not sales)? A rising rental-DOM trend means longer vacancies and softer asking-rent achievability than the comps imply.
- What's the recent tenant-quality profile in this submarket — average credit score on applications, eviction rate, late-payment / NSF rate, and stable-employment percentage? A property-management company in the area should have these aggregated.
- How much new for-sale + rental construction is in the pipeline within 1–3 miles? Heavy new supply typically softens prices + rents 12–24 months out; constrained supply supports both.
Investment metrics
- 1% rule
- 2.06% ✓
- Cap rate
- 17.53%
- Cash-on-cash
- 40.13%
- DSCR
- 2.79
- GRM
- 4.1
CMA / ARV
No comps found within radius.
Projected returns pro-forma
-0.1% appreciation · 3.0% rent growth · sell at horizon
- IRR
- 41.0%
- Equity multiple
- 3.01×
- Total profit
- $30,954
- Equity at exit
- $15,699
- IRR
- 44.2%
- Equity multiple
- 5.95×
- Total profit
- $76,187
- Equity at exit
- $18,657
Cash invested: $15,400 (down + closing). Projections, not guarantees.
Landlord ↔ Tenant lean methodology
- Overall (STATE)
- 85 Strongly Landlord-Friendly
- State North Carolina
- 85 Strongly Landlord-Friendly · R+3
- County
- — inherits STATE
- City
- — inherits STATE
ZIP-level market 27890
- Home prices YoY
- -0.1%
- Active inventory
- 6
- Price-to-rent
- 4.1×
Monthly cashflow live
- Estimated rent
- $1,131 medium interval (Pro) →
- Mortgage (P&I)
- −$288
- Tax from tax record
- −$68 /mo · $810/yr
- Insurance
- −$23
- HOA
- −$0
- Vacancy / Maint / Mgmt
- −$238
- Net cashflow
- $515
Break-even live
UW: 25.0% down · 7.5% · 30yr · 1.5% tax · 5.0% vac · 8.0% maint · 8.0% mgmt
Financing live
Cash to close
- Down payment
- $13,750
- Closing costs
- $1,650
- Reserves months
- —
- Total cash needed
- —
Loan-product check · same deal, 3 products live
Conventional
25% down · 7.5% · 30yr
- Down + closing
- —
- Monthly P&I
- —
- Monthly cashflow
- —
- DSCR
- —
- Eligible?
- —
Personal DTI + credit; lowest rate.
DSCR
20% down · 8.5% · 30yr
- Down + closing
- —
- Monthly P&I
- —
- Monthly cashflow
- —
- DSCR
- —
- Eligible?
- —
No personal income docs; deal must DSCR.
Hard money
10% down · 12.0% · 12mo
- Down + closing
- —
- Monthly P&I
- —
- Monthly cashflow
- —
- DSCR
- —
- Eligible?
- —
Short-term bridge; refi at stabilization.
Listing history 21 events
-
2026-06-19days on market $55,000 Active 207 DOM
-
2026-06-18days on market $55,000 Active 206 DOM
-
2026-06-17days on market $55,000 Active 205 DOM
-
2026-06-16days on market $55,000 Active 204 DOM
-
2026-06-15days on market $55,000 Active 203 DOM
-
2026-06-14days on market $55,000 Active 201 DOM
-
2026-06-12days on market $55,000 Active 200 DOM
-
2026-06-09days on market $55,000 Active 197 DOM
-
2026-06-08days on market $55,000 Active 196 DOM
-
2026-06-07days on market $55,000 Active 195 DOM
-
2026-06-05days on market $55,000 Active 193 DOM
-
2026-06-02days on market $55,000 Active 190 DOM
-
2026-06-01days on market $55,000 Active 189 DOM
-
2026-05-31days on market $55,000 Active 188 DOM
-
2026-05-30days on market $55,000 Active 187 DOM
-
2026-05-02status Active
-
2026-03-21price $55,000
-
2025-11-23$75,000 Active
-
2016-07-26soldstatus $20,000 177-char remark
Show marketing remark (177 chars)
Cute bunaglow. Some remodeling has begun and there is some more needed. Lots of extra rooms for storage, office space, or small bonus rooms. Large lot with small shed. Must see.
-
2016-03-02$20,000 177-char remark
Show marketing remark (177 chars)
Cute bunaglow. Some remodeling has begun and there is some more needed. Lots of extra rooms for storage, office space, or small bonus rooms. Large lot with small shed. Must see.
-
1998-10-08soldstatus $33,500
ⓘ Source: listings_history table (triggers on properties + properties_extension) + one-shot
backfill from property_details.listing_events for pre-trigger history.
Tax reassessment forecast NC · Resets to sale price
- Current annual tax
- $810 · $68/mo
- Projected year-2 tax
- $810 · $68/mo
- Expected delta
- $0/yr ($0/mo · 0.0%)
ⓘ Screening estimate from a state-policy table — verify with the county assessor before closing.
Climate risk First Street
- Flood 1/10 Low FEMA zone X (unshaded) · 0% chance over 30 yrs
- Wildfire 4/10 Moderate
- Heat 7/10 Severe 7 d/yr ≥107°F today · 16 d/yr by 30 yrs out
- Wind 6/10 Major 65% chance of damaging wind over 30 yrs
- Air quality 1/10 Low 0 unhealthy d/yr today · 0 by 30 yrs out
Nearby sold comps map
Loading sold comps map…
Walkable amenities ~0.75 mi
Loading nearby amenities…
Taxation est. · year 1
- Rental income
- $13,578
- − Mortgage interest
- −$3,081
- − Property taxes
- −$810
- − Insurance
- −$275
- − Repairs & maintenance
- −$1,086
- − Management
- −$1,086
- − Depreciation
- −$1,600
- Taxable income
- $5,639
- Est. tax owed @ 24.0%
- −$1,353
- After-tax cash flow
- $4,827/yr
For passive investors: Depreciation is non-cash, so a rental often shows a tax loss while cash-flowing — sheltering income. Rental losses are passive: they offset passive income freely, and up to $25,000/yr can offset ordinary (W-2) income if you actively participate and your MAGI is under $100k (phasing out to $0 by $150k); unused losses carry forward. On sale, claimed depreciation is recaptured at up to 25%, and gains may owe capital-gains tax (a 1031 exchange can defer both). Figures are a year-1 estimate at your 24.0% rate — not tax advice; consult a CPA.
Schools (NCES district)
- District
- Weldon City Schools
- NCES district ID
- 3704890
- Math proficiency
- 10% ▼ -4.00%
- Reading proficiency
- 17% ▼ -7.00%
- Median HH income
- $29,708
- Composite
- 10.56/100
- National rank
- #9779
- State rank
- #178 of 178 in NC
Livability — South Weldon
- Score
- 58/100
- State rank
- #585
- US rank
- #21510
Category grades
Schools grade is shown separately in the Schools card above.
Census & demographics
- Population (ZIP)
- 2,350
Population outlook (Halifax County) Hauer SSP2
- Today (2025)
- 47,976 people
- By 2030
- 45,450 · -5.3%
- By 2040
- 39,980 · -16.7%
- By 2050
- 34,863 · -27.3%
- By 2075
- 25,577 · -46.7%
- By 2100
- 18,365 · -61.7%
Race, ethnicity, and origin ACS 2023
- Neighborhood character
- Predominantly Black (84%)
- Race & ethnicity
- Black 84% White 13% Two or more races 1%
- Common ancestry
- Serbian 1%
- Foreign-born
- 1% · Canada
- Languages at home
- 98% English-only · German/W. Germanic 1% Spanish 1%
Political lean MEDSL · Halifax
- 2024 margin
- D (+17.7) · D 58.5% · R 40.9%
- 2008→2024 swing
- -10.6pp toward R · 2008: 28.2pp · 2024: 17.7pp
- All cycles
- 2024: D+17.7 2020: D+21.2 2016: D+26.9 2012: D+32.0 2008: D+28.2
Not yet ingested
- Civics
- —
Market trends
- HPI YoY
- ▼ -0.10%
- Current HPI
- 160.2443
- Rent YoY
- —
- Metro
- —
- State GDP YoY
- ▲ 3.28%
- F500 in state
- 26
Industry mix (Fortune 500 HQ in NC)
| Industry | F500 HQs | Revenue |
|---|---|---|
| Financial Services | 2 | $213B |
|
||
| Retail | 2 | $95B |
|
||
| Industrial Conglomerate | 1 | $38B |
|
||
| Metals / Steel | 1 | $35B |
|
||
| Utilities | 1 | $30B |
|
||
| Industrial Machinery | 1 | $19B |
|
||
Price history
+64.2% since first listed6 events — show timeline
- 2026-05-02 Relisted — RVLG
- 2026-03-21 Price Changed $55,000 RVLG
- 2025-11-23 Listed $75,000 RVLG
- 2016-07-26 Sold (MLS) $20,000 RVLG
- 2016-03-02 Listed $20,000 RVLG
- 1998-10-08 Sold (Public Records) $33,500 Public Records
Property tax history
+2.6%/yrLatest (2025): $810 · +1.4% YoY. Source: county tax records.
Cash-flow waterfall
monthlySold comps — $/sqft
last 12 mo · ≤1 miLoading sold comps…