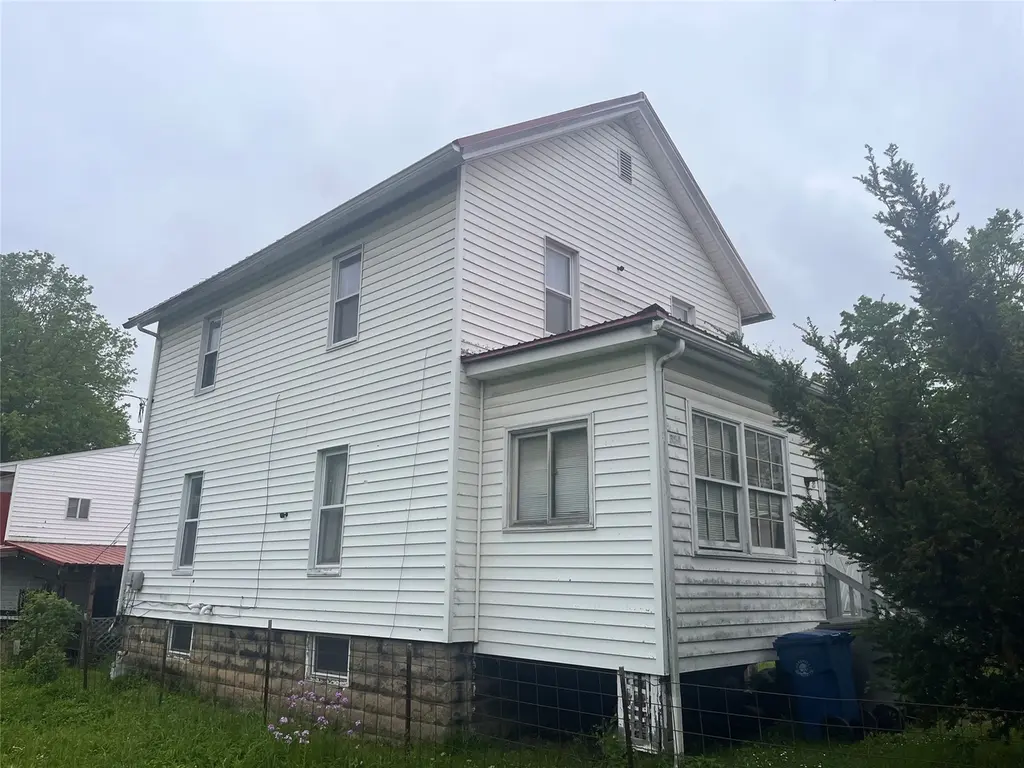
354 Pine St · Meadville, PA
Flood risk 4/10 · Minor
- FEMA flood zone
- X (unshaded)
- Chance of flooding over 30 yrs
- 0.24%
- Est. flood insurance / yr
- $473 – $860
Fire risk 1/10 · Minimal
- Est. fire insurance / yr
- $511 – $949
Heat risk 3/10 · Minor
- Hot days now (above 93°F)
- 7 days/yr
- Hot days in 30 yrs
- 19 days/yr
Wind risk 1/10 · Minimal
- Chance of severe wind over 30 yrs
- —
Air-quality risk 2/10 · Minimal
- Unhealthy air days now
- 1 days/yr
- Unhealthy air days in 30 yrs
- 2 days/yr
Risk factors via First Street. Map © Google.
Why this score? — see what drove the B+ grade
The composite is a weighted blend of 9 inputs, each scored 0–100. Each bar is that input's sub-score; the figure is the points it added to the 100-point composite (weight × sub-score).
- Cash flow +30.0/30.0
- ARV discount +15.0/15.0
- 1% rule +10.0/10.0
- DSCR +10.0/10.0
- Livability +4.2/5.0
- Schools +3.3/10.0
- Rent growth +2.5/5.0
- Condition / age +2.5/5.0
- Appreciation +0.0/10.0
$69,000
🖨 Deal sheet 📄 Offer letter ✓ Due diligence
Listing remarks
3 bed, 1 bath home features durable metal roofs on both the house and the oversized garage, updated windows and a renovated walk-in shower. A large detached garage, with brand new concrete pad, is a standout feature-perfect for hobbyists, business owners or anyone in need of extra space. Garage includes a finished office, a spacious 19'x15' bonus room upstairs and a covered outdoor area-ideal for entertaining or relaxing. Located only minutes from everything downtown.
Key facts
- Updated windows
- Bonus room
- Metal roofs
Tags
Property features AI
Exterior
- Parking: Detached garage (1 car)
- Utilities: Public water; Public sewer
- Home design: Single-family residence; Two levels
- Construction: Vinyl siding; Metal roof
- Exterior features: Enclosed porch; Paved road access
Interior
- Kitchen: Gas oven; Gas range; Refrigerator
- Flooring: Carpet; Laminate
- Bathrooms: 1 full bathroom
- Heating & cooling: Forced air heating
- Interior features: Gas oven, Gas range, Refrigerator; Fireplace (1); Full unfinished basement; 8 total rooms
Neighborhood map
What this means for you Summary
Snapshot
- This is a 3-bed/1.0-bath single-family listed at $69k.
Deal economics
- At list price, monthly cash flow is $453 ($5k/yr) — positive.
- The deal already cash-flows at list — no discount required.
- Meets the 1% rule at list price ($1k rent vs $69k).
- Recommended offer: $68k (1.5% below list) — sets the bar for market timing.
- Cap rate 14.2% vs local median 4.9% in Meadville — top-decile yield for the area; either an underpriced asset or a hidden risk that comps aren't pricing in. Stress-test before assuming the spread holds.
Location & tenants
- Location reads 85/100 on livability (#72 in PA, #502 nationally) — a professional / high-income tenant draw. Strengths: commute A+, cost of living A+, housing A+; Watch: crime C-, employment F.
- Crawford Central SD (town): math 28% / reading 51% proficiency, ranked #367 of 539 in PA (top 68%) — families likely to look elsewhere, expect single-tenant / working-renter base with shorter leases.
- Market conditions: 133 active listings in the ZIP; 83 units permitted in Crawford County in 2024 (0 in 5+ unit buildings).
Forward outlook
- Local home prices are declining (-3.0%/yr); year-one equity from $477 of loan paydown is wiped out by about $2k of value loss. Plan a longer hold.
- Crawford County population projected at -22% by 2050 — secular population decline; favor cash flow + early exit over multi-decade hold.
- At projected returns (-3.0% appreciation + 3.0% rent growth), your $19k cash investment doubles in ~5 years — after that, you're playing with house money.
Negotiation context
- It's been on market 30 days — a 2% lower offer ($68k) is reasonable based on typical stale-listing flexibility.
- 2 sale attempts with the ask held roughly flat each time — persistent listings suggest the price (not the market) is what's stuck; bring a comps-based counter.
Questions for the listing agent
- Is there a deadline driving the sale (1031 exchange, divorce, estate, relocation)? That informs how much negotiation room exists.
- What's the average days-on-market for RENTAL listings here right now (not sales)? A rising rental-DOM trend means longer vacancies and softer asking-rent achievability than the comps imply.
- What's the recent tenant-quality profile in this submarket — average credit score on applications, eviction rate, late-payment / NSF rate, and stable-employment percentage? A property-management company in the area should have these aggregated.
- How much new for-sale + rental construction is in the pipeline within 1–3 miles? Heavy new supply typically softens prices + rents 12–24 months out; constrained supply supports both.
Investment metrics
- 1% rule
- 1.64% ✓
- Cap rate
- 14.16%
- Cash-on-cash
- 28.11%
- DSCR
- 2.25
- GRM
- 5.1
CMA / ARV
- ARV (on-the-fly)
- $108,360
- Comps found
- 12
Show comp detail 12 sales within ~0.75 mi
| Address | Dist | Beds/Ba | Sqft | Sold | Price | $/sf | Match |
|---|---|---|---|---|---|---|---|
| 596 Williamson Rd | 0.43mi | 3/1.0 | 1,152 (-9%) | 9mo | $122,000 | $106 | 58 |
| 18786 Williams St | 0.66mi | 2/1.0 (-1) | 1,248 (-1%) | 7mo | $12,000 | $10 | 57 |
| 362 Randolph St | 0.56mi | 3/1.5 | 1,344 (+7%) | 8mo | $68,000 | $51 | 54 |
| 325 Wallace St | 0.53mi | 3/1.0 | 1,320 (+5%) | 19mo | $45,000 | $34 | 51 |
| 757 Garden St | 0.53mi | 3/1.0 | 1,360 (+8%) | 17mo | $35,000 | $26 | 48 |
| 788 Stewart St | 0.58mi | 3/1.0 | 1,072 (-15%) | 0mo | $92,000 | $86 | 48 |
| 606 Williamson Rd | 0.44mi | 4/1.5 (+1) | 1,204 (-4%) | 22mo | $135,000 | $112 | 46 |
| 1248 Carmont Dr | 0.61mi | 3/1.5 | 1,144 (-9%) | 10mo | $198,000 | $173 | 46 |
| 752 Williamson Rd | 0.67mi | 3/1.5 | 1,184 (-6%) | 13mo | $137,000 | $116 | 46 |
| 1031 Catherine St | 0.37mi | 3/1.0 | 1,400 (+11%) | 23mo | $93,000 | $66 | 45 |
| 761 Stewart St | 0.64mi | 3/2.0 | 1,200 (-5%) | 23mo | $115,500 | $96 | 40 |
| 668 North St | 0.72mi | 3/1.0 | 1,440 (+14%) | 20mo | $70,000 | $49 | 25 |
Match score weights: distance 35% · size 25% · config 20% · recency 20%. Top-matched comps best support the ARV.
Projected returns pro-forma
-3.0% appreciation · 3.0% rent growth · sell at horizon
- IRR
- 22.3%
- Equity multiple
- 1.91×
- Total profit
- $17,644
- Equity at exit
- $10,288
- IRR
- 30.3%
- Equity multiple
- 3.72×
- Total profit
- $52,470
- Equity at exit
- $5,966
Cash invested: $19,320 (down + closing). Projections, not guarantees.
Landlord ↔ Tenant lean methodology
- Overall (STATE)
- 62 Landlord-Friendly
- State Pennsylvania
- 62 Landlord-Friendly · EVEN
- County
- — inherits STATE
- City
- — inherits STATE
ZIP-level market 16335
- Home prices YoY
- -9.0%
- Active inventory
- 133
- Price-to-rent
- 5.1×
Monthly cashflow live
- Estimated rent
- $1,134 medium interval (Pro) →
- Mortgage (P&I)
- −$362
- Tax from tax record
- −$53 /mo · $633/yr
- Insurance
- −$29
- HOA
- −$0
- Vacancy / Maint / Mgmt
- −$238
- Net cashflow
- $453
Break-even live
UW: 25.0% down · 7.5% · 30yr · 1.5% tax · 5.0% vac · 8.0% maint · 8.0% mgmt
Financing live
Cash to close
- Down payment
- $17,250
- Closing costs
- $2,070
- Reserves months
- —
- Total cash needed
- —
Loan-product check · same deal, 3 products live
Conventional
25% down · 7.5% · 30yr
- Down + closing
- —
- Monthly P&I
- —
- Monthly cashflow
- —
- DSCR
- —
- Eligible?
- —
Personal DTI + credit; lowest rate.
DSCR
20% down · 8.5% · 30yr
- Down + closing
- —
- Monthly P&I
- —
- Monthly cashflow
- —
- DSCR
- —
- Eligible?
- —
No personal income docs; deal must DSCR.
Hard money
10% down · 12.0% · 12mo
- Down + closing
- —
- Monthly P&I
- —
- Monthly cashflow
- —
- DSCR
- —
- Eligible?
- —
Short-term bridge; refi at stabilization.
Listing history 17 events
-
2026-06-19days on market $69,000 Active 30 DOM
-
2026-06-18days on market $69,000 Active 29 DOM
-
2026-06-17days on market $69,000 Active 28 DOM
-
2026-06-16days on market $69,000 Active 27 DOM
-
2026-06-15days on market $69,000 Active 26 DOM
-
2026-06-14days on market $69,000 Active 24 DOM
-
2026-06-12days on market $69,000 Active 23 DOM
-
2026-06-09days on market $69,000 Active 20 DOM
-
2026-06-08days on market $69,000 Active 19 DOM
-
2026-06-07days on market $69,000 Active 18 DOM
-
2026-06-07days on market $69,000 Active 17 DOM
-
2026-06-02days on market $69,000 Active 13 DOM
-
2026-06-01days on market $69,000 Active 12 DOM
-
2026-05-31pricedays on market $69,000 Active 11 DOM
-
2026-05-30days on market $72,500 Active 10 DOM
-
2026-05-20$72,500 Active
-
2025-05-12$59,000 Active
ⓘ Source: listings_history table (triggers on properties + properties_extension) + one-shot
backfill from property_details.listing_events for pre-trigger history.
Tax reassessment forecast PA · Partial reset (capped growth)
- Current annual tax
- $633 · $53/mo
- Projected year-2 tax
- $861 · $72/mo
- Expected delta
- +$229/yr (+$19/mo · 36.2%)
ⓘ Screening estimate from a state-policy table — verify with the county assessor before closing.
Climate risk First Street
- Flood 4/10 Moderate FEMA zone X (unshaded) · 24% chance over 30 yrs
- Wildfire 1/10 Low
- Heat 3/10 Moderate 7 d/yr ≥93°F today · 19 d/yr by 30 yrs out
- Wind 1/10 Low
- Air quality 2/10 Low 1 unhealthy d/yr today · 2 by 30 yrs out
Nearby sold comps map
Loading sold comps map…
Walkable amenities ~0.75 mi
Loading nearby amenities…
Taxation est. · year 1
- Rental income
- $13,609
- − Mortgage interest
- −$3,865
- − Property taxes
- −$633
- − Insurance
- −$345
- − Repairs & maintenance
- −$1,089
- − Management
- −$1,089
- − Depreciation
- −$2,007
- Taxable income
- $4,582
- Est. tax owed @ 24.0%
- −$1,100
- After-tax cash flow
- $4,332/yr
For passive investors: Depreciation is non-cash, so a rental often shows a tax loss while cash-flowing — sheltering income. Rental losses are passive: they offset passive income freely, and up to $25,000/yr can offset ordinary (W-2) income if you actively participate and your MAGI is under $100k (phasing out to $0 by $150k); unused losses carry forward. On sale, claimed depreciation is recaptured at up to 25%, and gains may owe capital-gains tax (a 1031 exchange can defer both). Figures are a year-1 estimate at your 24.0% rate — not tax advice; consult a CPA.
Schools (NCES district)
- District
- Crawford Central SD
- NCES district ID
- 4207080
- Math proficiency
- 28% ▼ -11.00%
- Reading proficiency
- 51% ▼ -9.00%
- Median HH income
- $41,837
- Composite
- 33.21/100
- National rank
- #5530
- State rank
- #367 of 539 in PA
Livability — Meadville
- Score
- 85/100
- State rank
- #72
- US rank
- #502
Category grades
Schools grade is shown separately in the Schools card above.
Census & demographics
- Census place
- Meadville, PA
- County
- Crawford County · 27,175 people
- City population
- 27,175
- Metro
- Meadville, PA
- Population (ZIP)
- 27,175
- Household income
- $57,591
- Rent vs Own
- Severe rent burden
- 953.0
Population outlook (Crawford County) Hauer SSP2
- Today (2025)
- 81,399 people
- By 2030
- 77,977 · -4.2%
- By 2040
- 70,659 · -13.2%
- By 2050
- 63,841 · -21.6%
- By 2075
- 50,198 · -38.3%
- By 2100
- 37,898 · -53.4%
Race, ethnicity, and origin ACS 2023
- Neighborhood character
- Predominantly White (91%)
- Race & ethnicity
- White 91% Two or more races 4% Black 3% Hispanic / Latino 1%
- Common ancestry
- Romanian 3% Lithuanian 2% Serbian 2%
- Foreign-born
- 2% · Canada, China
- Languages at home
- 97% English-only · Spanish 1%
Political lean MEDSL · Crawford
- 2024 margin
- Solid R (+39.2) · D 30.0% · R 69.2%
- 2008→2024 swing
- -28.8pp toward R · 2008: -10.4pp · 2024: -39.2pp
- All cycles
- 2024: R+39.2 2020: R+37.2 2016: R+38.5 2012: R+19.6 2008: R+10.4
Not yet ingested
- Civics
- —
Market trends
- HPI YoY
- ▼ -26.80%
- Current HPI
- 272.4095
- Rent YoY
- —
- Metro
- Meadville, PA
- State GDP YoY
- ▲ 1.68%
- F500 in state
- 34
Industry mix (Fortune 500 HQ in PA)
| Industry | F500 HQs | Revenue |
|---|---|---|
| Healthcare | 2 | $309B |
|
||
| Insurance | 2 | $27B |
|
||
| Telecommunications / Media | 1 | $124B |
|
||
| Industrial Distribution | 1 | $22B |
|
||
| Financial Services | 1 | $20B |
|
||
| Chemicals / Materials | 1 | $18B |
|
||
Price history
+22.9% since first listed2 events — show timeline
- 2026-05-20 Listed $72,500 GEBOR
- 2025-05-12 Listed $59,000 GEBOR
Property tax history
-4.4%/yrLatest (2025): $633 · -2.0% YoY. Source: county tax records.
Cash-flow waterfall
monthlySold comps — $/sqft
last 12 mo · ≤1 miLoading sold comps…