1108 Glentana St · Chattanooga, TN
Flood risk 7/10 · Major
- FEMA flood zone
- X (unshaded)
- Chance of flooding over 30 yrs
- 0.77%
- Est. flood insurance / yr
- $507 – $1,088
Fire risk 4/10 · Minor
- Est. fire insurance / yr
- $963 – $1,789
Heat risk 6/10 · Moderate
- Hot days now (above 104°F)
- 7 days/yr
- Hot days in 30 yrs
- 21 days/yr
Wind risk 4/10 · Minor
- Chance of severe wind over 30 yrs
- 11.0%
Air-quality risk 3/10 · Minor
- Unhealthy air days now
- 2 days/yr
- Unhealthy air days in 30 yrs
- 2 days/yr
Risk factors via First Street. Map © Google.
Why this score? — see what drove the B- grade
The composite is a weighted blend of 9 inputs, each scored 0–100. Each bar is that input's sub-score; the figure is the points it added to the 100-point composite (weight × sub-score).
- Cash flow +30.0/30.0
- 1% rule +10.0/10.0
- DSCR +10.0/10.0
- ARV discount +7.5/15.0
- Rent growth +4.4/5.0
- Livability +3.9/5.0
- Schools +2.3/10.0
- Condition / age +1.0/5.0
- Appreciation +0.0/10.0
$39,900
🖨 Deal sheet (PDF) 📄 Offer letter ✓ Due diligence
Listing remarks MLS
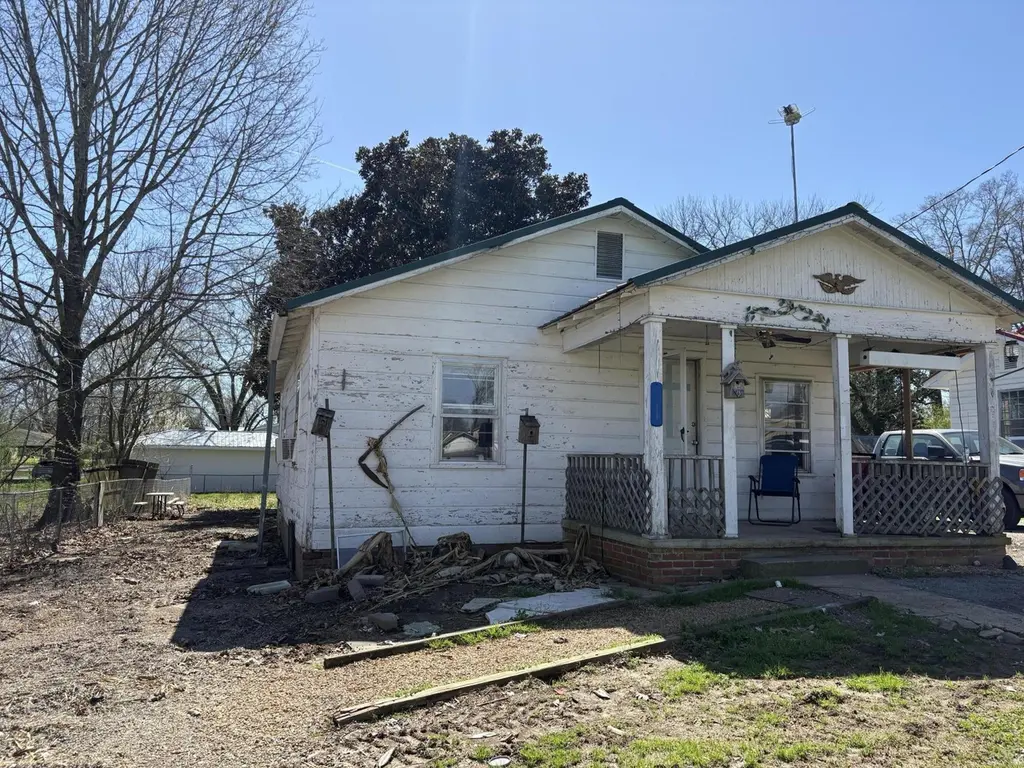
Investor special!!! 2BR 1BA 696 sq ft. Property is being sold ''As-Is''.
Key facts
- 8,276 sq ft lot
- Built 1932
- Listed 4 days
Property features AI
Finance
- Other: Property listed as residential single-family residence on approximately 0.19 acres; Property is described as a fixer
- Financial info: Tax amount reported (not included in details per instructions)
- HOA & community: No community or HOA features listed
Exterior
- Parking: Gravel off-street parking
- Security: No security features listed
- Utilities: Public water; Septic tank; Electricity available; Publicly maintained paved county road frontage
- Home design: Single-family house; One story; Fixer condition; Entry faces unspecified
- Construction: Wood siding; Metal roof; Concrete perimeter foundation; Built year not provided
- Exterior features: Front porch; No additional exterior features listed; Cleared lot
Interior
- Kitchen: No appliances included
- Bedrooms: 5 total rooms (bedroom count not specified)
- Flooring: Carpet; Linoleum
- Bathrooms: 1 full bathroom
- Heating & cooling: Wall furnace heating; Window unit cooling
- Interior features: Storm windows; Carpet and linoleum flooring
- Laundry & utility: No laundry hookups or appliances reported
Neighborhood map
What this means for you Summary
Snapshot
- This is a 2-bed/1.0-bath single-family listed at $40k. Condition is rated poor.
Deal economics
- At list price, monthly cash flow is $515 ($6k/yr) — positive.
- The deal already cash-flows at list — no discount required.
- Meets the 1% rule at list price ($1k rent vs $40k).
- Cap rate 23.8% vs local median 3.4% in Chattanooga — top-decile yield for the area; either an underpriced asset or a hidden risk that comps aren't pricing in. Stress-test before assuming the spread holds.
Location & tenants
- Location reads 78/100 on livability (#3 in TN, #2,582 nationally) — a middle-class / working-renter tenant base. Strengths: amenities A+, commute A+, cost of living A+; Watch: employment D+, crime F.
- Walker County (rural): math 25% / reading 29% proficiency, ranked #114 of 174 in GA (top 66%) — low school quality limits family demand, transient renter base, plan for 1-2y turnover; 61% free/reduced lunch — lower-income household profile, screen leases tightly.
- Zoned schools: Rossville Elementary School (math 22% / reading 17%, grade F, #878 of 1,228 statewide, top 75%, 416 students, 91% FRL); Rossville Middle School (math 13% / reading 25%, grade F, #368 of 470 statewide, top 79%, 444 students, 81% FRL); Ridgeland High School (math 23% / reading 19%, grade F, #225 of 424 statewide, top 54%, 1,244 students, 70% FRL) — zoned schools average 81% FRL vs 61% district-wide (19 pts higher); higher-poverty schools than district average — tighter screening recommended.
- Market conditions: Rents rising fast (+7.4%/yr); 3 comparable units currently listed for rent nearby; rentals at typical pace (median 25d on market — plan ~3-4 weeks tenant-placement turnaround); 347 units permitted in Walker County in 2024 (24 in 5+ unit buildings).
Forward outlook
- Local home prices are declining (-3.0%/yr); year-one equity from $276 of loan paydown is wiped out by about $1k of value loss. Plan a longer hold.
- Walker County population projected at -16% by 2050 — secular population decline; favor cash flow + early exit over multi-decade hold.
- At projected returns (-3.0% appreciation + 7.4% rent growth), your $11k cash investment doubles in ~2 years — after that, you're playing with house money.
Negotiation context
- Only 4 days on market — expect competitive offers; lowballing is unlikely to land.
- 2 sale attempts with the ask held roughly flat each time — persistent listings suggest the price (not the market) is what's stuck; bring a comps-based counter.
Risks & watch-outs
- Watch-outs: flood insurance adds $66/mo; built in 1932 — expect roof / HVAC / electrical / plumbing capex.
- Climate carrying-cost: major flood risk; extreme-heat days projected 7→21/yr by 2055 (HVAC capex compounding) — expect insurance premiums to compound above CPI over the hold.
Questions for the listing agent
- Have any recent inspections been done? Can we get a copy of the seller's disclosures and any deferred-maintenance estimates?
- Built in 1932 — when were the roof, HVAC, electrical panel, plumbing, and water heater last replaced?
- What's the actual annual flood-insurance premium (NFIP or private), and is the property in a SFHA with mandatory coverage?
- Is there a deadline driving the sale (1031 exchange, divorce, estate, relocation)? That informs how much negotiation room exists.
- Schools are F-rated, which usually means shorter tenancies and higher turnover. Who's the typical renter profile here, and what's been the actual vacancy rate?
- Crime grade is F in this area — have there been break-ins, vandalism, or insurance claims at this property in the last 3 years? What carrier currently insures it and at what premium?
- What's the average days-on-market for RENTAL listings here right now (not sales)? A rising rental-DOM trend means longer vacancies and softer asking-rent achievability than the comps imply.
- What's the recent tenant-quality profile in this submarket — average credit score on applications, eviction rate, late-payment / NSF rate, and stable-employment percentage? A property-management company in the area should have these aggregated.
- How much new for-sale + rental construction is in the pipeline within 1–3 miles? Heavy new supply typically softens prices + rents 12–24 months out; constrained supply supports both.
Investment metrics
- 1% rule
- 2.72% ✓
- Cap rate
- 23.77%
- Cash-on-cash
- 62.41%
- DSCR
- 3.78
- GRM
- 3.1
CMA / ARV
- ARV (on-the-fly)
- $144,072
- Comps found
- 2
Show comp detail 2 sales within ~0.75 mi
| Address | Dist | Beds/Ba | Sqft | Sold | Price | $/sf | Match |
|---|---|---|---|---|---|---|---|
| 824 Henderson Ave | 0.72mi | 2/1.0 | 750 (+8%) | 20mo | $155,000 | $207 | 36 |
| 1414 Happy Valley Rd | 0.71mi | 1/1.0 (-1) | 793 (+14%) | 20mo | $82,000 | $103 | 22 |
Match score weights: distance 35% · size 25% · config 20% · recency 20%. Top-matched comps best support the ARV.
Projected returns pro-forma
-3.0% appreciation · 7.44% rent growth · sell at horizon
- IRR
- 59.0%
- Equity multiple
- 3.81×
- Total profit
- $31,427
- Equity at exit
- $5,949
- IRR
- 65.5%
- Equity multiple
- 9.29×
- Total profit
- $92,566
- Equity at exit
- $3,450
Cash invested: $11,172 (down + closing). Projections, not guarantees.
Landlord ↔ Tenant lean methodology
- Overall (STATE)
- 87 Strongly Landlord-Friendly
- State Tennessee
- 87 Strongly Landlord-Friendly · R+13
- County
- — inherits STATE
- City
- — inherits STATE
ZIP-level market 30741
- Home prices YoY
- -30.7%
- Rents YoY
- 7.4%
- Price-to-rent
- 3.1×
Monthly cashflow live
- Estimated rent
- $1,085 medium interval (Pro) →
- Mortgage (P&I)
- −$209
- Tax est. 1.5%
- −$50 /mo · $598/yr
- Insurance
- −$17
- Flood insurance flood zone
- −$66 /mo · $798/yr
- HOA
- −$0
- Vacancy / Maint / Mgmt
- −$228
- Net cashflow
- $515
Break-even live
Sensitivity live
| Price | -10% $542 | -5% $528 | +0% $515 | +5% $501 | +10% $487 |
|---|---|---|---|---|---|
| Rent | -10% $429 | -5% $472 | +0% $515 | +5% $557 | +10% $600 |
| Rate | -1.0pp $535 | -0.5pp $525 | base $515 | +0.5pp $504 | +1.0pp $494 |
UW: 25.0% down · 7.5% · 30yr · 1.5% tax · 5.0% vac · 8.0% maint · 8.0% mgmt
Financing live
Cash to close
- Down payment
- $9,975
- Closing costs
- $1,197
- Reserves months
- —
- Total cash needed
- —
Loan-product check · same deal, 3 products live
Conventional
25% down · 7.5% · 30yr
- Down + closing
- —
- Monthly P&I
- —
- Monthly cashflow
- —
- DSCR
- —
- Eligible?
- —
Personal DTI + credit; lowest rate.
DSCR
20% down · 8.5% · 30yr
- Down + closing
- —
- Monthly P&I
- —
- Monthly cashflow
- —
- DSCR
- —
- Eligible?
- —
No personal income docs; deal must DSCR.
Hard money
10% down · 12.0% · 12mo
- Down + closing
- —
- Monthly P&I
- —
- Monthly cashflow
- —
- DSCR
- —
- Eligible?
- —
Short-term bridge; refi at stabilization.
Rent comps 3 comps
| Address | Beds | Baths | Sqft | Rent | $/sqft | DOM | Units | Dist |
|---|---|---|---|---|---|---|---|---|
| 1205 W 50th St Unit 2 Chattanooga, TN | 1.0 | 1.0 | 600 | $1,025 | $1.71 | 15d | 1 | 1.39mi |
| 5113 Tennessee Ave Unit 58 Chattanooga, TN | 1.0 | 1.0 | 700 | $950 | $1.36 | 25d | 1 | 1.40mi |
| 1209 W 50th St Unit 6 Chattanooga, TN | 1.0 | 1.0 | 524 | $895 | $1.71 | 25d | 1 | 1.40mi |
Listing history 5 events
-
2026-06-10status $39,900 Pending 4 DOM
-
2026-06-09days on market $39,900 Active 4 DOM
-
2026-06-08days on market $39,900 Active 3 DOM
-
2026-06-07remarks 72-char remark
-
2026-06-07$39,900 Active 2 DOM
ⓘ Source: listings_history table (triggers on properties + properties_extension) + one-shot
backfill from property_details.listing_events for pre-trigger history.
Climate risk First Street
- Flood 7/10 Severe FEMA zone X (unshaded) · 77% chance over 30 yrs
- Wildfire 4/10 Moderate
- Heat 6/10 Major 7 d/yr ≥104°F today · 21 d/yr by 30 yrs out
- Wind 4/10 Moderate 11% chance of damaging wind over 30 yrs
- Air quality 3/10 Moderate 2 unhealthy d/yr today · 2 by 30 yrs out
Nearby sold comps map
Loading sold comps map…
Walkable amenities ~0.75 mi
Loading nearby amenities…
Taxation est. · year 1
- Rental income
- $13,014
- − Mortgage interest
- −$2,235
- − Property taxes
- −$598
- − Insurance
- −$997
- − Repairs & maintenance
- −$1,041
- − Management
- −$1,041
- − Depreciation
- −$1,161
- Taxable income
- $5,941
- Est. tax owed @ 24.0%
- −$1,426
- After-tax cash flow
- $4,749/yr
For passive investors: Depreciation is non-cash, so a rental often shows a tax loss while cash-flowing — sheltering income. Rental losses are passive: they offset passive income freely, and up to $25,000/yr can offset ordinary (W-2) income if you actively participate and your MAGI is under $100k (phasing out to $0 by $150k); unused losses carry forward. On sale, claimed depreciation is recaptured at up to 25%, and gains may owe capital-gains tax (a 1031 exchange can defer both). Figures are a year-1 estimate at your 24.0% rate — not tax advice; consult a CPA.
Condition & rehab AI · 9 photos
This property requires extensive renovations, including kitchen and bathroom updates, exterior repairs, and landscaping. Immediate repairs and maintenance are needed to stabilize the structure and improve the property's value.
Repairs flagged
- Major Exposed subfloor in kitchen and bath — Structural damage and potential water damage.
- Major Missing cabinets, countertops, and appliances in kitchen — Essential for functionality and aesthetics.
- Major Missing fixtures in bath — Essential for functionality and aesthetics.
- Major Peeling paint and damaged siding — Structural integrity and aesthetics are compromised.
- Major Overgrown yard and debris on the porch — Reduces curb appeal and could indicate neglect.
Value-add opportunities
- Both Kitchen renovation — Modern kitchen with appliances and cabinets would significantly increase both resale and rental value.
- Both Bathroom renovation — Modern bathroom with fixtures would significantly increase both resale and rental value.
- Both Exterior painting and siding repair — Fresh paint and repaired siding would improve curb appeal and increase both resale and rental value.
- Both Landscaping and yard maintenance — Well-maintained landscaping and yard would improve curb appeal and increase both resale and rental value.
Renovation cost estimate screening
| Repair item | Severity | Est. cost |
|---|---|---|
| Exposed subfloor in kitchen and bath · Structural damage and potential water damage. | Major | $15,000–50,000 |
| Missing cabinets, countertops, and appliances in kitchen · Essential for functionality and aesthetics. | Major | $15,000–50,000 |
| Missing fixtures in bath · Essential for functionality and aesthetics. | Major | $15,000–50,000 |
| Peeling paint and damaged siding · Structural integrity and aesthetics are compromised. | Major | $15,000–50,000 |
| Overgrown yard and debris on the porch · Reduces curb appeal and could indicate neglect. | Major | $15,000–50,000 |
| Total estimated repair cost · 5 items | $75,000–250,000 |
Value-add ROI direction
- Both Kitchen renovation — Modern kitchen with appliances and cabinets would significantly increase both resale and rental value. ↑
- Both Bathroom renovation — Modern bathroom with fixtures would significantly increase both resale and rental value. ↑
- Both Exterior painting and siding repair — Fresh paint and repaired siding would improve curb appeal and increase both resale and rental value. ↑
- Both Landscaping and yard maintenance — Well-maintained landscaping and yard would improve curb appeal and increase both resale and rental value. ↑
ⓘ Cost ranges are severity-bucket heuristics (US national rule-of-thumb). Get contractor quotes + a written scope before underwriting a rehab budget.
Schools (NCES district)
- District
- Walker County
- NCES district ID
- 1305370
- Math proficiency
- 25% ▼ -10.00%
- Reading proficiency
- 29% ▼ -10.00%
- Median HH income
- $39,889
- Composite
- 22.74/100
- National rank
- #8035
- State rank
- #114 of 174 in GA
Livability — Chattanooga
- Score
- 78/100
- State rank
- #3
- US rank
- #2582
Category grades
Schools grade is shown separately in the Schools card above.
Census & demographics
- County
- Walker County
- City population
- 131,999
- Metro
- Chattanooga, TN-GA
- Population (ZIP)
- 30,041
- Household income
- $58,834
- Rent vs Own
- Severe rent burden
- 834.0
Population outlook (Walker County) Hauer SSP2
- Today (2025)
- 66,050 people
- By 2030
- 64,305 · -2.6%
- By 2040
- 60,127 · -9.0%
- By 2050
- 55,551 · -15.9%
- By 2075
- 44,886 · -32.0%
- By 2100
- 34,015 · -48.5%
Race, ethnicity, and origin ACS 2023
- Neighborhood character
- Predominantly White (86%)
- Race & ethnicity
- White 86% Black 5% Two or more races 5% Hispanic / Latino 5%
- Common ancestry
- Slovak 3% Iranian 2% Italian 1%
- Foreign-born
- 2% · Canada
- Languages at home
- 96% English-only · Spanish 3%
Political lean MEDSL · Walker
- 2024 margin
- Solid R (+59.3) · D 20.1% · R 79.4%
- 2008→2024 swing
- -12.5pp toward R · 2008: -46.8pp · 2024: -59.3pp
- All cycles
- 2024: R+59.3 2020: R+59.3 2016: R+61.5 2012: R+50.2 2008: R+46.8
Not yet ingested
- Civics
- —
Market trends
- HPI YoY
- ▼ -118.05%
- Current HPI
- 267.0047
- Rent YoY
- ▲ 7.44%
- Metro
- Chattanooga, TN-GA
- State GDP YoY
- ▲ 2.78%
- F500 in state
- 22
Industry mix (Fortune 500 HQ in TN)
| Industry | F500 HQs | Revenue |
|---|---|---|
| Healthcare | 3 | $91B |
|
||
| Retail | 3 | $72B |
|
||
| Transportation / Logistics | 1 | $88B |
|
||
| Paper / Packaging | 1 | $19B |
|
||
| Insurance | 1 | $13B |
|
||
| Energy | 1 | $12B |
|
||
Price history
+0.0% since first listed2 events — show timeline
- 2026-06-02 Listed $39,900 GAMLS
- 2026-06-02 Listed $39,900 GCAR
Cash-flow waterfall
monthlySold comps — $/sqft
last 12 mo · ≤1 miLoading sold comps…