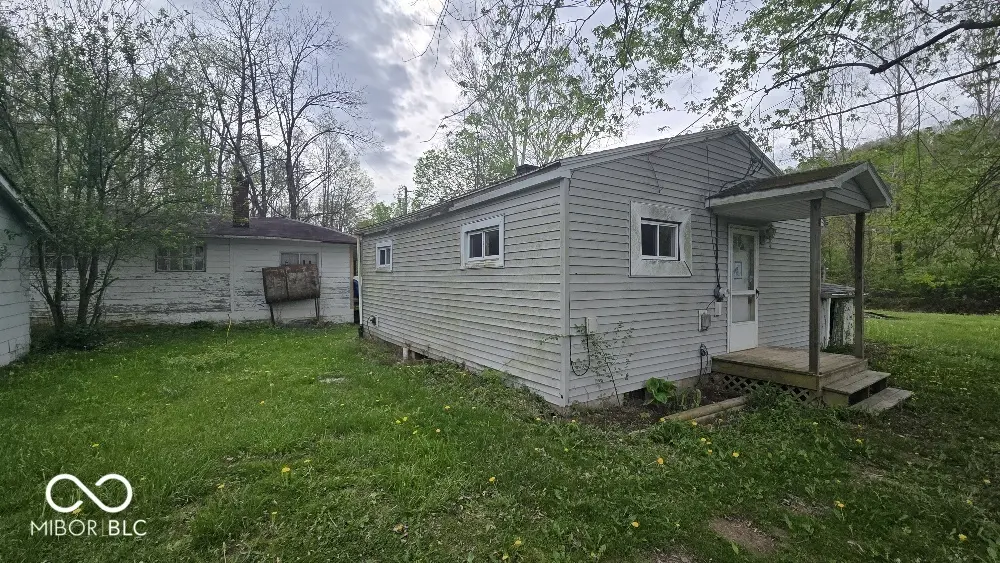
4745 Upper Patton Park Rd · Martinsville, IN
Flood risk 9/10 · Severe
- FEMA flood zone
- X (unshaded)
- Chance of flooding over 30 yrs
- 0.99%
- Est. flood insurance / yr
- $507 – $1,088
Fire risk 1/10 · Minimal
- Est. fire insurance / yr
- $717 – $1,331
Heat risk 3/10 · Minor
- Hot days now (above 102°F)
- 7 days/yr
- Hot days in 30 yrs
- 19 days/yr
Wind risk 2/10 · Minimal
- Chance of severe wind over 30 yrs
- 0.0%
Air-quality risk 2/10 · Minimal
- Unhealthy air days now
- 1 days/yr
- Unhealthy air days in 30 yrs
- 2 days/yr
Risk factors via First Street. Map © Google.
Why this score? — see what drove the B- grade
The composite is a weighted blend of 9 inputs, each scored 0–100. Each bar is that input's sub-score; the figure is the points it added to the 100-point composite (weight × sub-score).
- Cash flow +30.0/30.0
- 1% rule +10.0/10.0
- DSCR +10.0/10.0
- ARV discount +7.5/15.0
- Schools +3.4/10.0
- Livability +3.2/5.0
- Rent growth +2.5/5.0
- Condition / age +2.5/5.0
- Appreciation +0.0/10.0
$54,900
🖨 Deal sheet 📄 Offer letter ✓ Due diligence
Listing remarks MLS
This 2 bedroom 1 bath handy man special has an awesome rural location close to Patton Lake. The home backs up to a small canal and features a 2c-d garage, desirable lot, and much more. This is a rare opportunity on Upper Patton Park and will not last long. Home is being sold through an Auction (See Below). Auction begins on 5/17/2026 and ends on 5/19/2026
Key facts
- 0.26 acre lot
- 2 garage spots
- Built 1950
Neighborhood map
What this means for you Summary
Snapshot
- This is a 2-bed/1.0-bath single-family listed at $55k.
Deal economics
- At list price, monthly cash flow is $387 ($5k/yr) — positive.
- The deal already cash-flows at list — no discount required.
- Meets the 1% rule at list price ($1k rent vs $55k).
- Recommended offer: $52k (6.0% below list) — sets the bar for market timing.
Location & tenants
- Location reads 65/100 on livability (#335 in IN) — a middle-class / working-renter tenant base. Strengths: cost of living A+, housing A+; Watch: employment D+, amenities F, commute F.
- Monroe-Gregg School District (rural): math 31% / reading 45% proficiency, ranked #143 of 301 in IN (top 48%) — families likely to look elsewhere, expect single-tenant / working-renter base with shorter leases.
- Market conditions: 73 active listings in the ZIP; solid renter incomes; 330 units permitted in Morgan County in 2024 (0 in 5+ unit buildings).
- This rent is only 16% of the median local income ($79k/yr) — well below the 30% rent-burden line; pricing power to push rent on renewal without tenant pushback.
Forward outlook
- Local home prices are declining (-3.0%/yr); year-one equity from $380 of loan paydown is wiped out by about $2k of value loss. Plan a longer hold.
- Morgan County population projected to shrink 6% by 2050 — rents likely to lag national; underwrite the cash flow, not the appreciation.
- At projected returns (-3.0% appreciation + 3.0% rent growth), your $15k cash investment doubles in ~4 years — after that, you're playing with house money.
Negotiation context
- It's been on market 62 days — a 6% lower offer ($52k) is reasonable based on typical stale-listing flexibility.
- 5 sale attempts since 26y ago with the ask held roughly flat each time — persistent listings suggest the price (not the market) is what's stuck; bring a comps-based counter.
- Current owner paid $32k; list at $55k implies a 74% gain — meaningful room to come down on a strong offer.
Risks & watch-outs
- Watch-outs: flood insurance adds $66/mo; built in 1950 — expect roof / HVAC / electrical / plumbing capex.
- Climate carrying-cost: severe flood risk — expect insurance premiums to compound above CPI over the hold.
Questions for the listing agent
- It's been on market 62 days. Have you received any prior offers? Is the seller open to a 6% concession, seller financing, or rate buy-down credit?
- Built in 1950 — when were the roof, HVAC, electrical panel, plumbing, and water heater last replaced?
- What's the actual annual flood-insurance premium (NFIP or private), and is the property in a SFHA with mandatory coverage?
- Why hasn't it sold? Are there any deal-killer items the seller is aware of (foundation, flood, title, zoning, code violations)?
- Is there a deadline driving the sale (1031 exchange, divorce, estate, relocation)? That informs how much negotiation room exists.
- What's the average days-on-market for RENTAL listings here right now (not sales)? A rising rental-DOM trend means longer vacancies and softer asking-rent achievability than the comps imply.
- What's the recent tenant-quality profile in this submarket — average credit score on applications, eviction rate, late-payment / NSF rate, and stable-employment percentage? A property-management company in the area should have these aggregated.
- How much new for-sale + rental construction is in the pipeline within 1–3 miles? Heavy new supply typically softens prices + rents 12–24 months out; constrained supply supports both.
Investment metrics
- 1% rule
- 1.92% ✓
- Cap rate
- 16.21%
- Cash-on-cash
- 35.43%
- DSCR
- 2.58
- GRM
- 4.4
CMA / ARV
- ARV (median comp)
- $32,946
- List price
- $54,900
- Delta
- 66.64%
- Verdict
- OVERPRICED
- Comps
- 4 within 1.0 mi
Projected returns pro-forma
-3.0% appreciation · 3.0% rent growth · sell at horizon
- IRR
- 24.9%
- Equity multiple
- 2.03×
- Total profit
- $15,837
- Equity at exit
- $8,186
- IRR
- 32.7%
- Equity multiple
- 3.98×
- Total profit
- $45,790
- Equity at exit
- $4,747
Cash invested: $15,372 (down + closing). Projections, not guarantees.
Landlord ↔ Tenant lean methodology
- Overall (STATE)
- 90 Strongly Landlord-Friendly
- State Indiana
- 90 Strongly Landlord-Friendly · R+11
- County
- — inherits STATE
- City
- — inherits STATE
ZIP-level market 46151
- Active inventory
- 73
- Price-to-rent
- 4.4×
Monthly cashflow live
- Estimated rent
- $1,052 medium interval (Pro) →
- Mortgage (P&I)
- −$288
- Tax from tax record
- −$66 /mo · $793/yr
- Insurance
- −$23
- Flood insurance flood zone
- −$66 /mo · $798/yr
- HOA
- −$0
- Vacancy / Maint / Mgmt
- −$221
- Net cashflow
- $387
Break-even live
UW: 25.0% down · 7.5% · 30yr · 1.5% tax · 5.0% vac · 8.0% maint · 8.0% mgmt
Financing live
Cash to close
- Down payment
- $13,725
- Closing costs
- $1,647
- Reserves months
- —
- Total cash needed
- —
Loan-product check · same deal, 3 products live
Conventional
25% down · 7.5% · 30yr
- Down + closing
- —
- Monthly P&I
- —
- Monthly cashflow
- —
- DSCR
- —
- Eligible?
- —
Personal DTI + credit; lowest rate.
DSCR
20% down · 8.5% · 30yr
- Down + closing
- —
- Monthly P&I
- —
- Monthly cashflow
- —
- DSCR
- —
- Eligible?
- —
No personal income docs; deal must DSCR.
Hard money
10% down · 12.0% · 12mo
- Down + closing
- —
- Monthly P&I
- —
- Monthly cashflow
- —
- DSCR
- —
- Eligible?
- —
Short-term bridge; refi at stabilization.
Listing history 22 events
-
2026-06-18days on market $54,900 Active 62 DOM
-
2026-06-17days on market $54,900 Active 61 DOM
-
2026-06-16days on market $54,900 Active 60 DOM
-
2026-06-15days on market $54,900 Active 59 DOM
-
2026-06-13days on market $54,900 Active 57 DOM
-
2026-06-09days on market $54,900 Active 53 DOM
-
2026-06-08days on market $54,900 Active 52 DOM
-
2026-06-07days on market $54,900 Active 51 DOM
-
2026-06-05days on market $54,900 Active 48 DOM
-
2026-06-03days on market $54,900 Active 47 DOM
-
2026-06-02days on market $54,900 Active 46 DOM
-
2026-06-01days on market $54,900 Active 45 DOM
-
2026-05-31days on market $54,900 Active 44 DOM
-
2026-04-16$54,900 Active 361-char remark
Show marketing remark (361 chars)
This 2 bedroom 1 bath handy man special has an awesome rural location close to Patton Lake. The home backs up to a small canal and features a 2c-d garage, desirable lot, and much more. This is a rare opportunity on Upper Patton Park and will not last long. Home is being sold through an Auction (See Below). Auction begins on 5/17/2026 and ends on 5/19/2026
-
2005-09-15historical
-
2005-03-16$53,000
-
2004-02-21historical
-
2004-02-21historical
-
2003-09-11$57,000
-
2003-01-07$57,000
-
2000-12-22soldstatus $31,500
-
2000-09-12$34,000
ⓘ Source: listings_history table (triggers on properties + properties_extension) + one-shot
backfill from property_details.listing_events for pre-trigger history.
Tax reassessment forecast IN · Partial reset (capped growth)
- Current annual tax
- $793 · $66/mo
- Projected year-2 tax
- $793 · $66/mo
- Expected delta
- $0/yr ($0/mo · 0.0%)
ⓘ Screening estimate from a state-policy table — verify with the county assessor before closing.
Climate risk First Street
- Flood 9/10 Extreme FEMA zone X (unshaded) · 99% chance over 30 yrs
- Wildfire 1/10 Low
- Heat 3/10 Moderate 7 d/yr ≥102°F today · 19 d/yr by 30 yrs out
- Wind 2/10 Low 0% chance of damaging wind over 30 yrs
- Air quality 2/10 Low 1 unhealthy d/yr today · 2 by 30 yrs out
Nearby sold comps map
Loading sold comps map…
Walkable amenities ~0.75 mi
Loading nearby amenities…
Taxation est. · year 1
- Rental income
- $12,619
- − Mortgage interest
- −$3,075
- − Property taxes
- −$793
- − Insurance
- −$1,072
- − Repairs & maintenance
- −$1,010
- − Management
- −$1,010
- − Depreciation
- −$1,597
- Taxable income
- $4,063
- Est. tax owed @ 24.0%
- −$975
- After-tax cash flow
- $3,674/yr
For passive investors: Depreciation is non-cash, so a rental often shows a tax loss while cash-flowing — sheltering income. Rental losses are passive: they offset passive income freely, and up to $25,000/yr can offset ordinary (W-2) income if you actively participate and your MAGI is under $100k (phasing out to $0 by $150k); unused losses carry forward. On sale, claimed depreciation is recaptured at up to 25%, and gains may owe capital-gains tax (a 1031 exchange can defer both). Figures are a year-1 estimate at your 24.0% rate — not tax advice; consult a CPA.
Schools (NCES district)
- District
- Monroe-Gregg School District
- NCES district ID
- 1804140
- Math proficiency
- 31% ▼ -9.00%
- Reading proficiency
- 45% ▼ -4.00%
- Median HH income
- $64,767
- Composite
- 34.2/100
- National rank
- #5266
- State rank
- #143 of 301 in IN
Livability — Martinsville
- Score
- 65/100
- State rank
- #335
- US rank
- #12954
Category grades
Schools grade is shown separately in the Schools card above.
Census & demographics
- County
- Morgan County · 32,446 people
- City population
- 32,446
- Metro
- Indianapolis-Carmel-Anderson, IN
- Population (ZIP)
- 32,446
- Household income
- $78,812
- Rent vs Own
- Severe rent burden
- 471.0
Population outlook (Morgan County) Hauer SSP2
- Today (2025)
- 71,081 people
- By 2030
- 71,178 · +0.1%
- By 2040
- 69,907 · -1.7%
- By 2050
- 66,455 · -6.5%
- By 2075
- 57,291 · -19.4%
- By 2100
- 43,782 · -38.4%
Race, ethnicity, and origin ACS 2023
- Neighborhood character
- Predominantly White (95%)
- Race & ethnicity
- White 95% Two or more races 3% Hispanic / Latino 2%
- Common ancestry
- Slovak 2% Italian 2% Iranian 1%
- Foreign-born
- 1% · Canada
- Languages at home
- 98% English-only · Spanish 1%
Political lean MEDSL · Morgan
- 2024 margin
- Solid R (+54.3) · D 22.0% · R 76.3% · Other 1.7%
- 2008→2024 swing
- -27.3pp toward R · 2008: -27.1pp · 2024: -54.3pp
- All cycles
- 2024: R+54.3 2020: R+54.6 2016: R+56.6 2012: R+41.1 2008: R+27.1
Not yet ingested
- Civics
- —
Market trends
- HPI YoY
- ▼ -170.35%
- Current HPI
- 225.7797
- Rent YoY
- —
- Metro
- Indianapolis-Carmel-Anderson, IN
- State GDP YoY
- ▲ 2.90%
- F500 in state
- 18
Industry mix (Fortune 500 HQ in IN)
| Industry | F500 HQs | Revenue |
|---|---|---|
| Industrial Machinery | 2 | $37B |
|
||
| Healthcare | 1 | $177B |
|
||
| Pharmaceuticals | 1 | $45B |
|
||
| Metals / Steel | 1 | $18B |
|
||
| Agriculture | 1 | $17B |
|
||
| Packaging | 1 | $12B |
|
||
Price history
+61.5% since first listed9 events — show timeline
- 2026-04-16 Listed $54,900 MIBOR as Distributed by MLS Grid
- 2005-09-15 Listing Removed — MIBOR as Distributed by MLS Grid
- 2005-03-16 Listed $53,000 MIBOR as Distributed by MLS Grid
- 2004-02-21 Listing Removed — MIBOR as Distributed by MLS Grid
- 2004-02-21 Listing Removed — MIBOR as Distributed by MLS Grid
- 2003-09-11 Listed $57,000 MIBOR as Distributed by MLS Grid
- 2003-01-07 Listed $57,000 MIBOR as Distributed by MLS Grid
- 2000-12-22 Sold (MLS) $31,500 MIBOR as Distributed by MLS Grid
- 2000-09-12 Listed $34,000 MIBOR as Distributed by MLS Grid
Property tax history
+4.5%/yrLatest (2025): $793 · +10.5% YoY. Source: county tax records.
Cash-flow waterfall
monthlySold comps — $/sqft
last 12 mo · ≤1 miLoading sold comps…