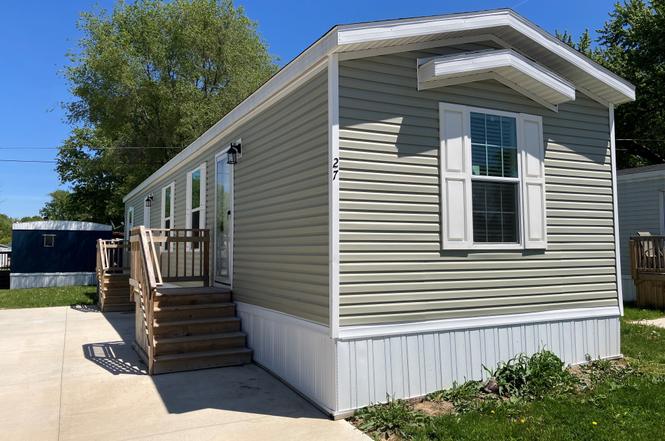
855 E Lake Street Site 27 · Lake Mills, WI
Flood risk No data
- FEMA flood zone
- —
- Chance of flooding over 30 yrs
- —
- Est. flood insurance / yr
- —
Fire risk No data
- Est. fire insurance / yr
- —
Heat risk No data
- Hot days now (above threshold)
- —
- Hot days in 30 yrs
- —
Wind risk No data
- Chance of severe wind over 30 yrs
- —
Air-quality risk No data
- Unhealthy air days now
- —
- Unhealthy air days in 30 yrs
- —
Risk factors via First Street. Map © Google.
Why this score? — see what drove the B- grade
The composite is a weighted blend of 9 inputs, each scored 0–100. Each bar is that input's sub-score; the figure is the points it added to the 100-point composite (weight × sub-score).
- Cash flow +30.0/30.0
- 1% rule +10.0/10.0
- DSCR +10.0/10.0
- ARV discount +7.5/15.0
- Livability +4.0/5.0
- Schools +3.4/10.0
- Rent growth +2.5/5.0
- Condition / age +2.5/5.0
- Appreciation +0.0/10.0
$70,100
🖨 Deal sheet (PDF) 📄 Offer letter ✓ Due diligence
Key facts
- Basketball court
- Clubhouse amenities
- Modern bathroom
Tags
Property features AI
Finance
- Other: Listing status: Active
- Financial info: List price $69,600
Exterior
- Utilities: Natural gas; Central air
- Home design: Spec new construction (Plan 92223)
- Exterior features: Located at 855 E Lake Street Site 27, Lake Mills, WI 53551
Interior
- Bedrooms: 2 bedrooms
- Bathrooms: 1 full bathroom
- Heating & cooling: Natural gas heating; Central air conditioning
- Interior features: Living area of 784
Neighborhood map
What this means for you Summary
Snapshot
- This is a 2-bed/1.0-bath manufactured listed at $70k.
Deal economics
- At list price, monthly cash flow is $624 ($7k/yr) — positive.
- The deal already cash-flows at list — no discount required.
- Meets the 1% rule at list price ($1k rent vs $70k).
- Recommended offer: $66k (6.0% below list) — sets the bar for market timing.
- Cap rate 17.0% vs local median 1.9% in Lake Mills — top-decile yield for the area; either an underpriced asset or a hidden risk that comps aren't pricing in. Stress-test before assuming the spread holds.
Location & tenants
- Location reads 80/100 on livability (#68 in WI, #1,833 nationally) — a professional / high-income tenant draw. Strengths: crime A+, cost of living A+, housing A+; Watch: amenities F, commute F.
- Lake Mills Area School District (town): math 38% / reading 39% proficiency, ranked #152 of 342 in WI (top 44%) — families likely to look elsewhere, expect single-tenant / working-renter base with shorter leases.
- Zoned schools: Lake Mills Elementary (math 42% / reading 42%, grade F, #433 of 1,041 statewide, top 46%, 610 students, 22% FRL); Lake Mills Middle (math 35% / reading 39%, grade F, #175 of 383 statewide, top 48%, 410 students, 30% FRL); Lake Mills High (math 37% / reading 32%, grade F, #144 of 483 statewide, top 36%, 488 students, 30% FRL).
- Market conditions: 34 active listings in the ZIP; 145 units permitted in Jefferson County in 2024 (0 in 5+ unit buildings).
Forward outlook
- Local home prices are declining (-3.0%/yr); year-one equity from $485 of loan paydown is wiped out by about $2k of value loss. Plan a longer hold.
- Jefferson County population projected to shrink 6% by 2050 — rents likely to lag national; underwrite the cash flow, not the appreciation.
- At projected returns (-3.0% appreciation + 3.0% rent growth), your $20k cash investment doubles in ~4 years — after that, you're playing with house money.
Negotiation context
- It's been on market 85 days — a 6% lower offer ($66k) is reasonable based on typical stale-listing flexibility.
Questions for the listing agent
- It's been on market 85 days. Have you received any prior offers? Is the seller open to a 6% concession, seller financing, or rate buy-down credit?
- Why hasn't it sold? Are there any deal-killer items the seller is aware of (foundation, flood, title, zoning, code violations)?
- Is there a deadline driving the sale (1031 exchange, divorce, estate, relocation)? That informs how much negotiation room exists.
- What's the average days-on-market for RENTAL listings here right now (not sales)? A rising rental-DOM trend means longer vacancies and softer asking-rent achievability than the comps imply.
- What's the recent tenant-quality profile in this submarket — average credit score on applications, eviction rate, late-payment / NSF rate, and stable-employment percentage? A property-management company in the area should have these aggregated.
- How much new for-sale + rental construction is in the pipeline within 1–3 miles? Heavy new supply typically softens prices + rents 12–24 months out; constrained supply supports both.
Investment metrics
- 1% rule
- 2.00% ✓
- Cap rate
- 16.98%
- Cash-on-cash
- 38.17%
- DSCR
- 2.70
- GRM
- 4.2
CMA / ARV
No comps found within radius.
Projected returns pro-forma
-3.0% appreciation · 3.0% rent growth · sell at horizon
- IRR
- 34.3%
- Equity multiple
- 2.45×
- Total profit
- $28,421
- Equity at exit
- $10,452
- IRR
- 41.1%
- Equity multiple
- 4.87×
- Total profit
- $76,031
- Equity at exit
- $6,061
Cash invested: $19,628 (down + closing). Projections, not guarantees.
Landlord ↔ Tenant lean methodology
- Overall (STATE)
- 73 Landlord-Friendly
- State Wisconsin
- 73 Landlord-Friendly · R+2
- County
- — inherits STATE
- City
- — inherits STATE
ZIP-level market 53551
- Active inventory
- 34
- Price-to-rent
- 4.2×
Monthly cashflow live
- Estimated rent
- $1,403 medium interval (Pro) →
- Mortgage (P&I)
- −$368
- Tax est. 1.5%
- −$88 /mo · $1,052/yr
- Insurance
- −$29
- HOA
- −$0
- Vacancy / Maint / Mgmt
- −$295
- Net cashflow
- $624
Break-even live
Sensitivity live
| Price | -10% $673 | -5% $648 | +0% $624 | +5% $600 | +10% $576 |
|---|---|---|---|---|---|
| Rent | -10% $513 | -5% $569 | +0% $624 | +5% $680 | +10% $735 |
| Rate | -1.0pp $660 | -0.5pp $642 | base $624 | +0.5pp $606 | +1.0pp $588 |
UW: 25.0% down · 7.5% · 30yr · 1.5% tax · 5.0% vac · 8.0% maint · 8.0% mgmt
Financing live
Cash to close
- Down payment
- $17,525
- Closing costs
- $2,103
- Reserves months
- —
- Total cash needed
- —
Loan-product check · same deal, 3 products live
Conventional
25% down · 7.5% · 30yr
- Down + closing
- —
- Monthly P&I
- —
- Monthly cashflow
- —
- DSCR
- —
- Eligible?
- —
Personal DTI + credit; lowest rate.
DSCR
20% down · 8.5% · 30yr
- Down + closing
- —
- Monthly P&I
- —
- Monthly cashflow
- —
- DSCR
- —
- Eligible?
- —
No personal income docs; deal must DSCR.
Hard money
10% down · 12.0% · 12mo
- Down + closing
- —
- Monthly P&I
- —
- Monthly cashflow
- —
- DSCR
- —
- Eligible?
- —
Short-term bridge; refi at stabilization.
Listing history 18 events
-
2026-06-21days on market $70,100 Active 85 DOM
-
2026-06-19days on market $70,100 Active 83 DOM
-
2026-06-18days on market $70,100 Active 82 DOM
-
2026-06-17days on market $70,100 Active 81 DOM
-
2026-06-16days on market $70,100 Active 80 DOM
-
2026-06-15days on market $70,100 Active 79 DOM
-
2026-06-14days on market $70,100 Active 77 DOM
-
2026-06-12days on market $70,100 Active 76 DOM
-
2026-06-09days on market $70,100 Active 73 DOM
-
2026-06-08days on market $70,100 Active 72 DOM
-
2026-06-07days on market $70,100 Active 71 DOM
-
2026-06-05days on market $70,100 Active 69 DOM
-
2026-06-04days on market $70,100 Active 67 DOM
-
2026-06-02days on market $70,100 Active 66 DOM
-
2026-06-01price $70,100 Active 65 DOM
-
2026-06-01days on market $69,600 Active 65 DOM
-
2026-05-31days on market $69,600 Active 64 DOM
-
2026-05-31days on market $69,600 Active 63 DOM
ⓘ Source: listings_history table (triggers on properties + properties_extension) + one-shot
backfill from property_details.listing_events for pre-trigger history.
Nearby sold comps map
Loading sold comps map…
Walkable amenities ~0.75 mi
Loading nearby amenities…
Taxation est. · year 1
- Rental income
- $16,841
- − Mortgage interest
- −$3,927
- − Property taxes
- −$1,052
- − Insurance
- −$350
- − Repairs & maintenance
- −$1,347
- − Management
- −$1,347
- − Depreciation
- −$2,039
- Taxable income
- $6,779
- Est. tax owed @ 24.0%
- −$1,627
- After-tax cash flow
- $5,864/yr
For passive investors: Depreciation is non-cash, so a rental often shows a tax loss while cash-flowing — sheltering income. Rental losses are passive: they offset passive income freely, and up to $25,000/yr can offset ordinary (W-2) income if you actively participate and your MAGI is under $100k (phasing out to $0 by $150k); unused losses carry forward. On sale, claimed depreciation is recaptured at up to 25%, and gains may owe capital-gains tax (a 1031 exchange can defer both). Figures are a year-1 estimate at your 24.0% rate — not tax advice; consult a CPA.
Schools (NCES district)
- District
- Lake Mills Area School District
- NCES district ID
- 5507710
- Math proficiency
- 38% ▼ -11.00%
- Reading proficiency
- 39% ▼ -6.00%
- Median HH income
- $62,848
- Composite
- 34.48/100
- National rank
- #5186
- State rank
- #152 of 342 in WI
Livability — Lake Mills
- Score
- 80/100
- State rank
- #68
- US rank
- #1833
Category grades
Schools grade is shown separately in the Schools card above.
Census & demographics
- Census place
- Lake Mills, WI
- City population
- 9,485
- Population (ZIP)
- 9,485
Population outlook (Jefferson County) Hauer SSP2
- Today (2025)
- 86,617 people
- By 2030
- 86,818 · +0.2%
- By 2040
- 85,552 · -1.2%
- By 2050
- 81,765 · -5.6%
- By 2075
- 68,937 · -20.4%
- By 2100
- 55,854 · -35.5%
Race, ethnicity, and origin ACS 2023
- Neighborhood character
- Predominantly White (90%)
- Race & ethnicity
- White 90% Hispanic / Latino 6% Two or more races 5% Native American 1%
- Hispanic origin (detail)
- Mexican 4% Cuban 1%
- Common ancestry
- Romanian 8% Portuguese 6% Lithuanian 3%
- Foreign-born
- 2% · Canada
- Languages at home
- 97% English-only · Spanish 1% French/Haitian/Cajun 1% German/W. Germanic 1%
Political lean MEDSL · Jefferson
- 2024 margin
- R (+16.4) · D 41.1% · R 57.5% · Other 1.4%
- 2008→2024 swing
- -17.2pp toward R · 2008: 0.8pp · 2024: -16.4pp
- All cycles
- 2024: R+16.4 2020: R+15.2 2016: R+16.2 2012: R+7.6 2008: D+0.8
Not yet ingested
- Civics
- —
Market trends
- HPI YoY
- ▼ -185.97%
- Current HPI
- 213.919
- Rent YoY
- —
- Metro
- —
- State GDP YoY
- ▲ 2.10%
- F500 in state
- 20
Industry mix (Fortune 500 HQ in WI)
| Industry | F500 HQs | Revenue |
|---|---|---|
| Industrial Machinery | 4 | $23B |
|
||
| Industrial Technology | 2 | $36B |
|
||
| Insurance | 1 | $36B |
|
||
| Professional Services | 1 | $19B |
|
||
| Utilities | 1 | $9B |
|
||
| Consumer Goods | 1 | $3B |
|
||
Cash-flow waterfall
monthlySold comps — $/sqft
last 12 mo · ≤1 miLoading sold comps…