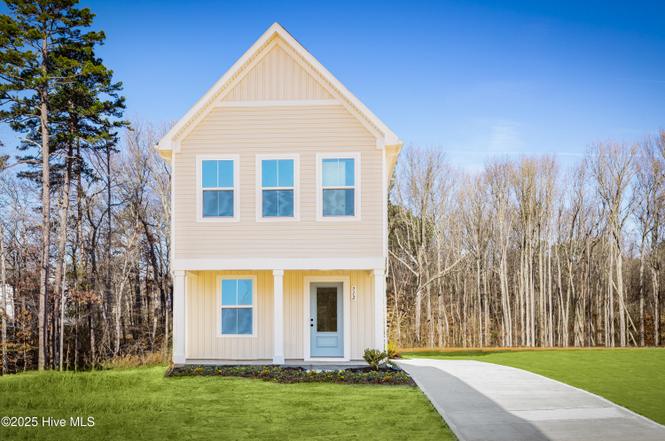
1424 Pine Log Trl NE · Bolivia, NC
Flood risk No data
- FEMA flood zone
- —
- Chance of flooding over 30 yrs
- —
- Est. flood insurance / yr
- —
Fire risk No data
- Est. fire insurance / yr
- —
Heat risk No data
- Hot days now (above threshold)
- —
- Hot days in 30 yrs
- —
Wind risk No data
- Chance of severe wind over 30 yrs
- —
Air-quality risk No data
- Unhealthy air days now
- —
- Unhealthy air days in 30 yrs
- —
Risk factors via First Street. Map © Google.
Why this score? — see what drove the D grade
The composite is a weighted blend of 9 inputs, each scored 0–100. Each bar is that input's sub-score; the figure is the points it added to the 100-point composite (weight × sub-score).
- Cash flow +11.5/30.0
- ARV discount +11.5/15.0
- 1% rule +4.1/10.0
- Schools +3.9/10.0
- DSCR +3.4/10.0
- Livability +3.0/5.0
- Rent growth +2.5/5.0
- Condition / age +2.5/5.0
- Appreciation +0.0/10.0
$249,995
🖨 Deal sheet (PDF) 📄 Offer letter ✓ Due diligence
Listing remarks
Welcome to Middle Creek Village Coastal Cottages & Villas -- the lowest-priced new homes with low-maintenance living just minutes from the beach! Meet The Tate, where the Cottage Collection reaches a new level of style, comfort, and coastal charm. A covered front porch sets the tone with inviting outdoor living space--ideal for morning coffee, evening breezes, or relaxing after a day on the Carolina coast. Step inside to an airy, open-concept main level designed for effortless living and entertaining. The great room features upgraded LVP flooring, adding both durability and modern coastal elegance. The gourmet kitchen shines with upgraded décor island and cabinetry, stainless
Key facts
- Covered front porch
- Gourmet kitchen
- 3,049 sq ft lot
Tags
Neighborhood map
What this means for you Summary
Snapshot
- This is a 3-bed/2.5-bath single-family listed at $250k.
Deal economics
- At list price, monthly cash flow is $-84 ($-1k/yr) — negative.
- To cash-flow at today's rent, offer at most $238k (4.8% below list).
- To meet the 1% rule (rent ≥ 1% of price), the offer needs to be $227k (9.2% below list).
- Recommended offer: $227k (9.2% below list) — sets the bar for 1% rule.
- Cap rate 5.9% vs local median 4.8% in Bolivia — meaningfully above typical; check what's discounted (condition, days-on-market, listing class) to confirm the premium yield is real.
Location & tenants
- Location reads 59/100 on livability (#549 in NC) — a working-class tenant base; expect higher turnover. Strengths: health & safety A+, cost of living B; Watch: amenities F, commute F, employment F.
- Brunswick County Schools (rural): math 45% / reading 47% proficiency, ranked #82 of 178 in NC (top 46%) — families likely to look elsewhere, expect single-tenant / working-renter base with shorter leases.
- Zoned schools: Bolivia Elementary (math 50% / reading 43%, grade D-, #542 of 1,410 statewide, top 39%, 496 students, 99% FRL); South Brunswick Middle (math 41% / reading 49%, grade D, #160 of 475 statewide, top 35%, 572 students, 100% FRL); South Brunswick High (math 62% / reading 57%, grade C+, #216 of 535 statewide, top 43%, 1,172 students, 100% FRL) — zoned schools average 100% FRL vs 53% district-wide (46 pts higher); higher-poverty schools than district average — tighter screening recommended.
- Market conditions: 569 active listings in the ZIP; 1 comparable units currently listed for rent nearby; 6,112 units permitted in Brunswick County in 2024 (990 in 5+ unit buildings).
- This rent runs 39% of the median local income ($69k/yr) — at the standard rent-burdened threshold; future hikes will face affordability resistance.
Forward outlook
- Local home prices are declining (-3.0%/yr); year-one equity from $2k of loan paydown is wiped out by about $8k of value loss. Plan a longer hold.
- Brunswick County population projected at +36% by 2050 — long-run rental-demand tailwind backs the buy-and-hold thesis.
Negotiation context
- It's been on market 43 days — a 3% lower offer ($242k) is reasonable based on typical stale-listing flexibility.
- 2 sale attempts with the ask held roughly flat each time — persistent listings suggest the price (not the market) is what's stuck; bring a comps-based counter.
Questions for the listing agent
- What do current leases actually rent for vs. the listed asking? Can we see a recent rent roll and the last 12 months of T-12 income?
- It's been on market 43 days. Have you received any prior offers? Is the seller open to a 9% concession, seller financing, or rate buy-down credit?
- What does the HOA fee cover, when was the last increase, and are there any pending special assessments or reserve-fund shortfalls?
- Is there a deadline driving the sale (1031 exchange, divorce, estate, relocation)? That informs how much negotiation room exists.
- Schools are D-rated, which usually means shorter tenancies and higher turnover. Who's the typical renter profile here, and what's been the actual vacancy rate?
- The area grade is low — what's the realistic commute time and amenity access for the typical tenant pool here? Any planned neighborhood developments (good or bad) we should know about?
- What's the average days-on-market for RENTAL listings here right now (not sales)? A rising rental-DOM trend means longer vacancies and softer asking-rent achievability than the comps imply.
- What's the recent tenant-quality profile in this submarket — average credit score on applications, eviction rate, late-payment / NSF rate, and stable-employment percentage? A property-management company in the area should have these aggregated.
- How much new for-sale + rental construction is in the pipeline within 1–3 miles? Heavy new supply typically softens prices + rents 12–24 months out; constrained supply supports both.
Investment metrics
- 1% rule
- 0.91% ✗
- Cap rate
- 5.89%
- Cash-on-cash
- -1.43%
- DSCR
- 0.94
- GRM
- 9.2
CMA / ARV
- ARV (on-the-fly)
- $274,482
- Comps found
- 9
Show comp detail 9 sales within ~0.75 mi
| Address | Dist | Beds/Ba | Sqft | Sold | Price | $/sf | Match |
|---|---|---|---|---|---|---|---|
| 1500 Pine Log Trl | 0.11mi | 3/2.5 | 1,326 (0%) | 6mo | $254,997 | $192 | 90 |
| 269 Ocean Pointe Blvd SE #17 | 0.05mi | 3/2.0 | 1,202 (-9%) | 10mo | $254,240 | $212 | 72 |
| 277 Ocean Pointe Blvd SE #19 | 0.05mi | 3/2.0 | 1,510 (+14%) | 9mo | $275,000 | $182 | 65 |
| 245 Ocean Pointe Blvd SE #11 | 0.05mi | 3/2.0 | 1,510 (+14%) | 12mo | $275,000 | $182 | 63 |
| 1496 Pine Log Trl NE | 0.10mi | 2/2.5 (-1) | 1,156 (-13%) | 10mo | $239,575 | $207 | 61 |
| 1678 Piney Creek Rd NE | 0.58mi | 3/2.0 | 1,338 (+1%) | 20mo | $292,465 | $219 | 53 |
| 1682 Piney Creek Rd NE | 0.58mi | 3/2.0 | 1,338 (+1%) | 20mo | $301,145 | $225 | 53 |
| 1702 Piney Creek Dr NE | 0.60mi | 3/2.0 | 1,338 (+1%) | 21mo | $304,250 | $227 | 51 |
| 2944 Old Ocean Hwy | 0.65mi | 2/1.0 (-1) | 1,192 (-10%) | 5mo | $170,000 | $143 | 38 |
Match score weights: distance 35% · size 25% · config 20% · recency 20%. Top-matched comps best support the ARV.
Projected returns pro-forma
-3.0% appreciation · 3.0% rent growth · sell at horizon
- IRR
- -18.6%
- Equity multiple
- 0.35×
- Total profit
- $-45,704
- Equity at exit
- $37,275
- IRR
- -10.9%
- Equity multiple
- 0.34×
- Total profit
- $-46,138
- Equity at exit
- $21,615
Cash invested: $69,999 (down + closing). Projections, not guarantees.
Landlord ↔ Tenant lean methodology
- Overall (STATE)
- 85 Strongly Landlord-Friendly
- State North Carolina
- 85 Strongly Landlord-Friendly · R+3
- County
- — inherits STATE
- City
- — inherits STATE
ZIP-level market 28422
- Home prices YoY
- -23.8%
- Active inventory
- 569
- Price-to-rent
- 9.2×
Monthly cashflow live
- Estimated rent
- $2,270 medium interval (Pro) →
- Mortgage (P&I)
- −$1,311
- Tax est. 1.5%
- −$312 /mo · $3,750/yr
- Insurance
- −$104
- HOA
- −$149
- Vacancy / Maint / Mgmt
- −$477
- Net cashflow
- $-84
Break-even live
Sensitivity live
| Price | -10% $89 | -5% $3 | +0% $-84 | +5% $-170 | +10% $-256 |
|---|---|---|---|---|---|
| Rent | -10% $-263 | -5% $-173 | +0% $-84 | +5% $6 | +10% $96 |
| Rate | -1.0pp $42 | -0.5pp $-20 | base $-84 | +0.5pp $-148 | +1.0pp $-214 |
UW: 25.0% down · 7.5% · 30yr · 1.5% tax · 5.0% vac · 8.0% maint · 8.0% mgmt
Financing live
Cash to close
- Down payment
- $62,499
- Closing costs
- $7,500
- Reserves months
- —
- Total cash needed
- —
Loan-product check · same deal, 3 products live
Conventional
25% down · 7.5% · 30yr
- Down + closing
- —
- Monthly P&I
- —
- Monthly cashflow
- —
- DSCR
- —
- Eligible?
- —
Personal DTI + credit; lowest rate.
DSCR
20% down · 8.5% · 30yr
- Down + closing
- —
- Monthly P&I
- —
- Monthly cashflow
- —
- DSCR
- —
- Eligible?
- —
No personal income docs; deal must DSCR.
Hard money
10% down · 12.0% · 12mo
- Down + closing
- —
- Monthly P&I
- —
- Monthly cashflow
- —
- DSCR
- —
- Eligible?
- —
Short-term bridge; refi at stabilization.
Rent comps 1 comps
| Address | Beds | Baths | Sqft | Rent | $/sqft | DOM | Units | Dist |
|---|---|---|---|---|---|---|---|---|
| 40 Knox St Bolivia, NC | 3.0 | 2.0 | 1569 | $2,200 | $1.40 | 24d | 1 | 1.32mi |
HOA detail
- Monthly dues
- $149 · $1,788/yr
Listing history 8 events
-
2026-04-01status Pending
-
2026-03-30price $249,995
-
2025-12-11status Pending
-
2025-12-03status Pending
-
2025-12-01historical
-
2025-12-01price $259,875
-
2025-02-17$258,145 Active
-
2025-02-07$242,990 Active
ⓘ Source: listings_history table (triggers on properties + properties_extension) + one-shot
backfill from property_details.listing_events for pre-trigger history.
Nearby sold comps map
Loading sold comps map…
Walkable amenities ~0.75 mi
Loading nearby amenities…
Taxation est. · year 1
- Rental income
- $27,237
- − Mortgage interest
- −$14,004
- − Property taxes
- −$3,750
- − Insurance
- −$1,250
- − Repairs & maintenance
- −$2,179
- − Management
- −$2,179
- − HOA
- −$1,788
- − Depreciation
- −$7,273
- Taxable loss
- −$5,185
- Est. tax savings @ 24.0%
- +$1,244
- After-tax cash flow
- $242/yr
For passive investors: Depreciation is non-cash, so a rental often shows a tax loss while cash-flowing — sheltering income. Rental losses are passive: they offset passive income freely, and up to $25,000/yr can offset ordinary (W-2) income if you actively participate and your MAGI is under $100k (phasing out to $0 by $150k); unused losses carry forward. On sale, claimed depreciation is recaptured at up to 25%, and gains may owe capital-gains tax (a 1031 exchange can defer both). Figures are a year-1 estimate at your 24.0% rate — not tax advice; consult a CPA.
Schools (NCES district)
- District
- Brunswick County Schools
- NCES district ID
- 3700420
- Math proficiency
- 45% ▲ 4.00%
- Reading proficiency
- 47% ▲ 4.00%
- Median HH income
- $47,494
- Composite
- 39.23/100
- National rank
- #4011
- State rank
- #82 of 178 in NC
Livability — Bolivia
- Score
- 59/100
- State rank
- #549
- US rank
- #20206
Category grades
Schools grade is shown separately in the Schools card above.
Census & demographics
- County
- Brunswick County · 131,536 people
- City population
- 10,059
- Metro
- Myrtle Beach-Conway-North Myrtle Beach, SC-NC
- Population (ZIP)
- 10,059
- Household income
- $69,412
- Rent vs Own
- Severe rent burden
- 243.0
Population outlook (Brunswick County) Hauer SSP2
- Today (2025)
- 152,111 people
- By 2030
- 165,705 · +8.9%
- By 2040
- 188,494 · +23.9%
- By 2050
- 206,228 · +35.6%
- By 2075
- 237,876 · +56.4%
- By 2100
- 251,451 · +65.3%
Race, ethnicity, and origin ACS 2023
- Neighborhood character
- Predominantly White (80%)
- Race & ethnicity
- White 80% Black 9% Two or more races 8% Hispanic / Latino 3% Native American 1%
- Common ancestry
- Slovak 4% Lithuanian 3% Romanian 2%
- Foreign-born
- 3% · Canada
- Languages at home
- 95% English-only · Spanish 4%
Political lean MEDSL · Brunswick
- 2024 margin
- Strong R (+24.9) · D 37.2% · R 62.0%
- 2008→2024 swing
- -6.9pp toward R · 2008: -17.9pp · 2024: -24.9pp
- All cycles
- 2024: R+24.9 2020: R+25.0 2016: R+28.7 2012: R+22.2 2008: R+17.9
Not yet ingested
- Civics
- —
Market trends
- HPI YoY
- ▼ -44.19%
- Current HPI
- 141.1956
- Rent YoY
- —
- Metro
- Myrtle Beach-Conway-North Myrtle Beach, SC-NC
- State GDP YoY
- ▲ 3.28%
- F500 in state
- 26
Industry mix (Fortune 500 HQ in NC)
| Industry | F500 HQs | Revenue |
|---|---|---|
| Financial Services | 2 | $213B |
|
||
| Retail | 2 | $95B |
|
||
| Industrial Conglomerate | 1 | $38B |
|
||
| Metals / Steel | 1 | $35B |
|
||
| Utilities | 1 | $30B |
|
||
| Industrial Machinery | 1 | $19B |
|
||
Price history
+2.9% since first listed8 events — show timeline
- 2026-04-01 Pending — Hive MLS
- 2026-03-30 Price Changed $249,995 Hive MLS
- 2025-12-11 Pending — Hive MLS
- 2025-12-03 Pending — Hive MLS
- 2025-12-01 Price Changed $259,875 Hive MLS
- 2025-12-01 Listing Removed — Hive MLS
- 2025-02-17 Listed $258,145 Hive MLS
- 2025-02-07 Listed $242,990 Hive MLS
Cash-flow waterfall
monthlySold comps — $/sqft
last 12 mo · ≤1 miLoading sold comps…