 🏷️ Likely Rental
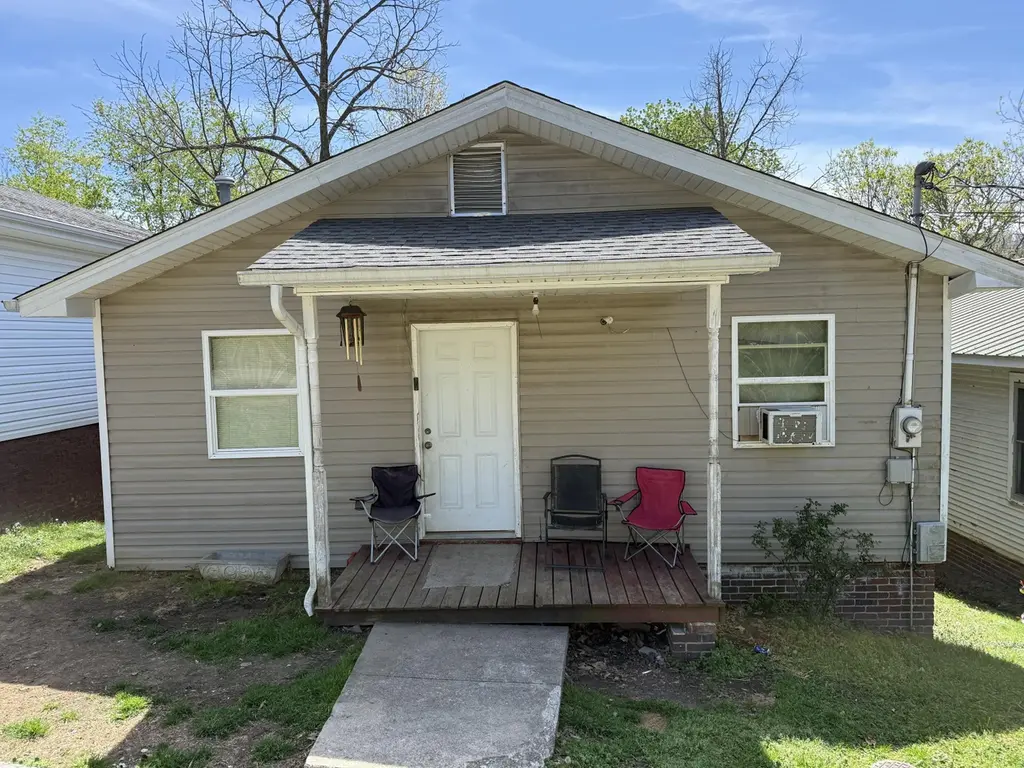
413 W 15th St · Corbin, KY
Flood risk 1/10 · Minimal
- FEMA flood zone
- X (unshaded)
- Chance of flooding over 30 yrs
- 0.0%
- Est. flood insurance / yr
- $473 – $860
Fire risk 3/10 · Minor
- Est. fire insurance / yr
- $839 – $1,559
Heat risk 4/10 · Minor
- Hot days now (above 99°F)
- 7 days/yr
- Hot days in 30 yrs
- 19 days/yr
Wind risk 2/10 · Minimal
- Chance of severe wind over 30 yrs
- 4.0%
Air-quality risk 2/10 · Minimal
- Unhealthy air days now
- 0 days/yr
- Unhealthy air days in 30 yrs
- 1 days/yr
Risk factors via First Street. Map © Google.
Why this score? — see what drove the C grade
The composite is a weighted blend of 9 inputs, each scored 0–100. Each bar is that input's sub-score; the figure is the points it added to the 100-point composite (weight × sub-score).
- Cash flow +15.2/30.0
- ARV discount +15.0/15.0
- Appreciation +5.9/10.0
- DSCR +4.7/10.0
- 1% rule +4.2/10.0
- Schools +3.8/10.0
- Livability +3.5/5.0
- Rent growth +2.5/5.0
- Condition / age +2.5/5.0
$115,000
🖨 Deal sheet (PDF) 📄 Offer letter ✓ Due diligence
Listing remarks
If you're looking for a home within city limits that is conveniently located near shopping, dining, entertainment, and schools, this property may be just what you're looking for. This 2-bedroom, 1-bath home offers a great investment opportunity and features road parking. The home also includes a crawl space large enough for additional storage. Its central location provides easy access to everyday amenities and local attractions. Tenant occupied. Agent/Owner
Key facts
- Crawl space
- Central location
- 6,969 sq ft lot
Tags
Property features AI
Exterior
- Parking: Off-street parking
- Utilities: Public sewer; Electricity connected; Natural gas connected; Sewer connected; Water connected
- Home design: Single-story house
- Construction: Wood siding; Shingle roof; Other foundation; Built area approximately 1,092
- Exterior features: Few trees on the lot; Public water
Interior
- Kitchen: Refrigerator; Oven
- Bedrooms: 2 total rooms
- Flooring: Hardwood floors
- Bathrooms: 1 full bathroom
- Heating & cooling: Natural gas heating; Window air conditioning unit(s)
- Interior features: Refrigerator; Oven
- Laundry & utility: Washer hookup; Electric dryer hookup
Neighborhood map
What this means for you Summary
Snapshot
- This is a 2-bed/1.0-bath single-family listed at $115k.
Deal economics
- At list price, monthly cash flow is $40 ($479/yr) — positive.
- The deal already cash-flows at list — no discount required.
- To meet the 1% rule (rent ≥ 1% of price), the offer needs to be $106k (8.1% below list).
- Recommended offer: $106k (8.1% below list) — sets the bar for 1% rule.
- Cap rate 6.7% vs local median 3.3% in Corbin — top-decile yield for the area; either an underpriced asset or a hidden risk that comps aren't pricing in. Stress-test before assuming the spread holds.
Location & tenants
- Location reads 69/100 on livability (#179 in KY) — a middle-class / working-renter tenant base. Strengths: cost of living A+, housing A+, crime A-; Watch: amenities F, commute F, employment F.
- Corbin Independent (town): math 42% / reading 50% proficiency, ranked #20 of 165 in KY (top 12%) — families likely to look elsewhere, expect single-tenant / working-renter base with shorter leases.
- Zoned schools: Corbin Elementary School (math 53% / reading 58%, grade C, #60 of 676 statewide, top 9%, 373 students, 61% FRL); Corbin Middle School (math 46% / reading 56%, grade C, #20 of 217 statewide, top 10%, 646 students, 58% FRL); Corbin High School (math 22% / reading 42%, grade F, #97 of 254 statewide, top 46%, 829 students, 53% FRL).
- Market conditions: 332 active listings in the ZIP; 65 units permitted in Whitley County in 2024 (0 in 5+ unit buildings).
Forward outlook
- In year one you build about $3k of equity ($795 loan paydown + $2k appreciation (1.8% local appreciation)).
- Whitley County population projected to shrink 8% by 2050 — rents likely to lag national; underwrite the cash flow, not the appreciation.
- At projected returns (1.8% appreciation + 3.0% rent growth), your $32k cash investment doubles in ~8 years — after that, you're playing with house money.
Negotiation context
- It's been on market 66 days — a 6% lower offer ($108k) is reasonable based on typical stale-listing flexibility.
Questions for the listing agent
- It's been on market 66 days. Have you received any prior offers? Is the seller open to a 8% concession, seller financing, or rate buy-down credit?
- Why hasn't it sold? Are there any deal-killer items the seller is aware of (foundation, flood, title, zoning, code violations)?
- Is there a deadline driving the sale (1031 exchange, divorce, estate, relocation)? That informs how much negotiation room exists.
- Schools are B-rated — typically a magnet for longer-tenancy family renters. What's the average tenant stay here, and is there a school-zone premium baked into asking?
- What's the average days-on-market for RENTAL listings here right now (not sales)? A rising rental-DOM trend means longer vacancies and softer asking-rent achievability than the comps imply.
- What's the recent tenant-quality profile in this submarket — average credit score on applications, eviction rate, late-payment / NSF rate, and stable-employment percentage? A property-management company in the area should have these aggregated.
- How much new for-sale + rental construction is in the pipeline within 1–3 miles? Heavy new supply typically softens prices + rents 12–24 months out; constrained supply supports both.
Investment metrics
- 1% rule
- 0.92% ✗
- Cap rate
- 6.71%
- Cash-on-cash
- 1.49%
- DSCR
- 1.07
- GRM
- 9.1
CMA / ARV
- ARV (on-the-fly)
- $216,216
- Comps found
- 5
Show comp detail 5 sales within ~0.75 mi
| Address | Dist | Beds/Ba | Sqft | Sold | Price | $/sf | Match |
|---|---|---|---|---|---|---|---|
| 1307 Roosevelt St | 0.19mi | 3/2.5 (+1) | 2,100 (-4%) | 16mo | $265,000 | $126 | 61 |
| 1313 Roosevelt St | 0.17mi | 3/2.5 (+1) | 1,916 (-12%) | 2mo | $254,000 | $133 | 59 |
| 805 Holly Ln | 0.35mi | 3/2.5 (+1) | 2,431 (+11%) | 14mo | $235,000 | $97 | 42 |
| 911 W 8th St | 0.62mi | 3/2.0 (+1) | 2,353 (+8%) | 14mo | $205,000 | $87 | 38 |
| 1507 Sherwood Dr | 0.56mi | 3/2.5 (+1) | 2,080 (-5%) | 23mo | $206,000 | $99 | 36 |
Match score weights: distance 35% · size 25% · config 20% · recency 20%. Top-matched comps best support the ARV.
Projected returns pro-forma
1.82% appreciation · 3.0% rent growth · sell at horizon
- IRR
- 5.5%
- Equity multiple
- 1.29×
- Total profit
- $9,421
- Equity at exit
- $44,271
- IRR
- 9.1%
- Equity multiple
- 2.22×
- Total profit
- $39,146
- Equity at exit
- $62,925
Cash invested: $32,200 (down + closing). Projections, not guarantees.
Landlord ↔ Tenant lean methodology
- Overall (STATE)
- 83 Strongly Landlord-Friendly
- State Kentucky
- 83 Strongly Landlord-Friendly · R+16
- County
- — inherits STATE
- City
- — inherits STATE
ZIP-level market 40701
- Home prices YoY
- 0.6%
- Active inventory
- 332
- Price-to-rent
- 9.1×
Monthly cashflow live
- Estimated rent
- $1,057 medium interval (Pro) →
- Mortgage (P&I)
- −$603
- Tax est. 1.5%
- −$144 /mo · $1,725/yr
- Insurance
- −$48
- HOA
- −$0
- Vacancy / Maint / Mgmt
- −$222
- Net cashflow
- $40
Break-even live
Sensitivity live
| Price | -10% $119 | -5% $80 | +0% $40 | +5% $0 | +10% $-40 |
|---|---|---|---|---|---|
| Rent | -10% $-44 | -5% $-2 | +0% $40 | +5% $82 | +10% $123 |
| Rate | -1.0pp $98 | -0.5pp $69 | base $40 | +0.5pp $10 | +1.0pp $-20 |
UW: 25.0% down · 7.5% · 30yr · 1.5% tax · 5.0% vac · 8.0% maint · 8.0% mgmt
Financing live
Cash to close
- Down payment
- $28,750
- Closing costs
- $3,450
- Reserves months
- —
- Total cash needed
- —
Loan-product check · same deal, 3 products live
Conventional
25% down · 7.5% · 30yr
- Down + closing
- —
- Monthly P&I
- —
- Monthly cashflow
- —
- DSCR
- —
- Eligible?
- —
Personal DTI + credit; lowest rate.
DSCR
20% down · 8.5% · 30yr
- Down + closing
- —
- Monthly P&I
- —
- Monthly cashflow
- —
- DSCR
- —
- Eligible?
- —
No personal income docs; deal must DSCR.
Hard money
10% down · 12.0% · 12mo
- Down + closing
- —
- Monthly P&I
- —
- Monthly cashflow
- —
- DSCR
- —
- Eligible?
- —
Short-term bridge; refi at stabilization.
Listing history 12 events
-
2026-06-12days on market $115,000 Active 66 DOM
-
2026-06-09days on market $115,000 Active 63 DOM
-
2026-06-08days on market $115,000 Active 62 DOM
-
2026-06-07days on market $115,000 Active 61 DOM
-
2026-06-04days on market $115,000 Active 57 DOM
-
2026-06-02days on market $115,000 Active 56 DOM
-
2026-06-01days on market $115,000 Active 55 DOM
-
2026-05-31days on market $115,000 Active 54 DOM
-
2026-05-31days on market $115,000 Active 53 DOM
-
2026-04-07$120,000 Active
-
2024-01-02soldstatus $151,500
-
2021-10-22soldstatus $45,000
ⓘ Source: listings_history table (triggers on properties + properties_extension) + one-shot
backfill from property_details.listing_events for pre-trigger history.
Climate risk First Street
- Flood 1/10 Low FEMA zone X (unshaded) · 0% chance over 30 yrs
- Wildfire 3/10 Moderate
- Heat 4/10 Moderate 7 d/yr ≥99°F today · 19 d/yr by 30 yrs out
- Wind 2/10 Low 4% chance of damaging wind over 30 yrs
- Air quality 2/10 Low 0 unhealthy d/yr today · 1 by 30 yrs out
Nearby sold comps map
Loading sold comps map…
Walkable amenities ~0.75 mi
Loading nearby amenities…
Taxation est. · year 1
- Rental income
- $12,679
- − Mortgage interest
- −$6,442
- − Property taxes
- −$1,725
- − Insurance
- −$575
- − Repairs & maintenance
- −$1,014
- − Management
- −$1,014
- − Depreciation
- −$3,345
- Taxable loss
- −$1,437
- Est. tax savings @ 24.0%
- +$345
- After-tax cash flow
- $824/yr
For passive investors: Depreciation is non-cash, so a rental often shows a tax loss while cash-flowing — sheltering income. Rental losses are passive: they offset passive income freely, and up to $25,000/yr can offset ordinary (W-2) income if you actively participate and your MAGI is under $100k (phasing out to $0 by $150k); unused losses carry forward. On sale, claimed depreciation is recaptured at up to 25%, and gains may owe capital-gains tax (a 1031 exchange can defer both). Figures are a year-1 estimate at your 24.0% rate — not tax advice; consult a CPA.
Schools (NCES district)
- District
- Corbin Independent
- NCES district ID
- 2101320
- Math proficiency
- 42% ▼ -19.00%
- Reading proficiency
- 50% ▼ -13.00%
- Median HH income
- $36,928
- Composite
- 38.19/100
- National rank
- #4259
- State rank
- #20 of 165 in KY
Livability — Corbin
- Score
- 69/100
- State rank
- #179
- US rank
- #8891
Category grades
Schools grade is shown separately in the Schools card above.
Census & demographics
- Census place
- Corbin, KY
- Population (ZIP)
- 29,767
Population outlook (Whitley County) Hauer SSP2
- Today (2025)
- 35,362 people
- By 2030
- 34,807 · -1.6%
- By 2040
- 33,525 · -5.2%
- By 2050
- 32,550 · -8.0%
- By 2075
- 29,555 · -16.4%
- By 2100
- 24,308 · -31.3%
Race, ethnicity, and origin ACS 2023
- Neighborhood character
- Predominantly White (95%)
- Race & ethnicity
- White 95% Two or more races 3% Hispanic / Latino 1%
- Common ancestry
- Serbian 2% Slovak 2% Italian 1%
- Foreign-born
- 1% · Canada
- Languages at home
- 99% English-only · Spanish 1%
Political lean MEDSL · Whitley
- 2024 margin
- Solid R (+69.3) · D 14.8% · R 84.2% · Other 1.0%
- 2008→2024 swing
- -21.7pp toward R · 2008: -47.7pp · 2024: -69.3pp
- All cycles
- 2024: R+69.3 2020: R+65.2 2016: R+67.2 2012: R+57.8 2008: R+47.7
Not yet ingested
- Civics
- —
Market trends
- HPI YoY
- ▲ 1.82%
- Current HPI
- 294.7961
- Rent YoY
- —
- Metro
- —
- State GDP YoY
- ▲ 1.81%
- F500 in state
- 4
Industry mix (Fortune 500 HQ in KY)
| Industry | F500 HQs | Revenue |
|---|---|---|
| Healthcare | 1 | $118B |
|
||
| Food / Beverage | 1 | $7B |
|
||
Price history
+166.7% since first listed3 events — show timeline
- 2026-04-07 Listed $120,000 ImagineMLS
- 2024-01-02 Sold (Public Records) $151,500 Public Records
- 2021-10-22 Sold (Public Records) $45,000 Public Records
Property tax history
+10.8%/yrLatest (2024): $148 · -3.8% YoY. Source: county tax records.
Cash-flow waterfall
monthlySold comps — $/sqft
last 12 mo · ≤1 miLoading sold comps…