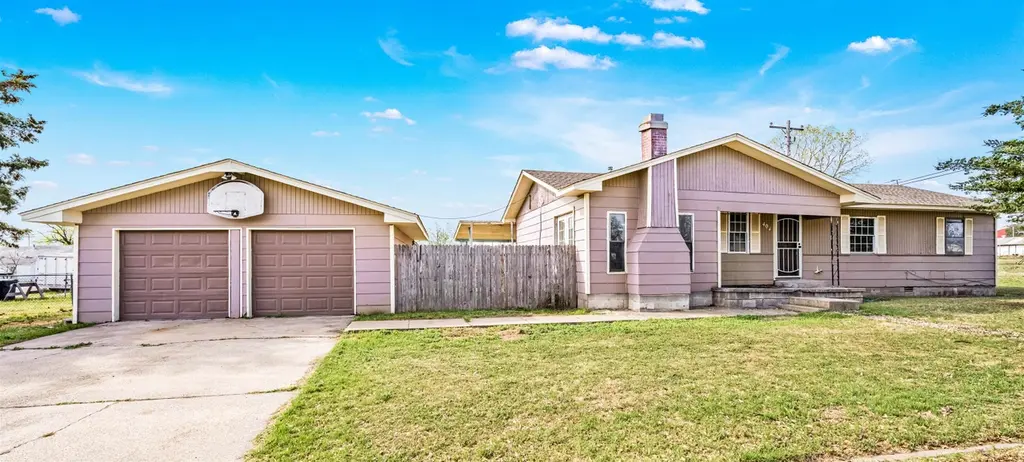
404 Hereford · Indiahoma, OK
Flood risk No data
- FEMA flood zone
- —
- Chance of flooding over 30 yrs
- —
- Est. flood insurance / yr
- —
Fire risk No data
- Est. fire insurance / yr
- —
Heat risk No data
- Hot days now (above threshold)
- —
- Hot days in 30 yrs
- —
Wind risk No data
- Chance of severe wind over 30 yrs
- —
Air-quality risk No data
- Unhealthy air days now
- —
- Unhealthy air days in 30 yrs
- —
Risk factors via First Street. Map © Google.
Why this score? — see what drove the C+ grade
The composite is a weighted blend of 9 inputs, each scored 0–100. Each bar is that input's sub-score; the figure is the points it added to the 100-point composite (weight × sub-score).
- Cash flow +23.6/30.0
- Appreciation +7.9/10.0
- DSCR +7.6/10.0
- ARV discount +6.2/15.0
- 1% rule +6.1/10.0
- Livability +2.9/5.0
- Rent growth +2.5/5.0
- Condition / age +2.2/5.0
- Schools +1.7/10.0
$95,000
🖨 Deal sheet (PDF) 📄 Offer letter ✓ Due diligence
Listing remarks
--LISTED BY JENNIFER LOWE 580-475-6252 Located on a corner lot in the quiet community of Indiahoma, this 2-bedroom, 2-bath home offers approximately 1,300 square feet of living space with a flexible layout that could accommodate a third bedroom option using the spacious family room. The home features fresh interior paint and a functional floor plan, including a comfortable family room with a gas log fireplace. With a little updating and personal touch, this property has great potential to be transformed into a comfortable primary residence or investment opportunity. A detached two-car garage provides ample space for parking, storage, or use as a workshop. The fully fenced yard offers adde
Key facts
- Flexible layout
- Gas log fireplace
- Near local school
Tags
Property features AI
Finance
- Other: Corner lot
Exterior
- Parking: 2 total parking spaces; 2-car garage
- Utilities: Public water; Public sewer
- Home design: Single-family residence; One-story
- Construction: Wood siding; Composition roof
- Exterior features: Covered patio/porch; Chain link fencing; Fenced yard; Outbuilding and workshop
Interior
- Bathrooms: 2 full bathrooms
- Heating & cooling: Central heating (electric); Central air conditioning
- Interior features: Gas log fireplace in the family room
Neighborhood map
What this means for you Summary
Snapshot
- This is a 2-bed/2.0-bath single-family listed at $95k. Condition is rated fair.
Deal economics
- At list price, monthly cash flow is $179 ($2k/yr) — positive.
- The deal already cash-flows at list — no discount required.
- Meets the 1% rule at list price ($1k rent vs $95k).
- Recommended offer: $89k (6.0% below list) — sets the bar for market timing.
Location & tenants
- Location reads 58/100 on livability (#450 in OK) — a working-class tenant base; expect higher turnover. Strengths: cost of living A+, housing A; Watch: schools D-, crime F, amenities F.
- Indiahoma (rural): math 10% / reading 20% proficiency, ranked #453 of 513 in OK (top 88%) — low school quality limits family demand, transient renter base, plan for 1-2y turnover; 69% free/reduced lunch — lower-income household profile, screen leases tightly.
- Market conditions: 4 active listings in the ZIP; 133 units permitted in Comanche County in 2024 (0 in 5+ unit buildings).
Forward outlook
- In year one you build about $6k of equity ($657 loan paydown + $5k appreciation (5.7% local appreciation)).
- Comanche County population projected to shrink 3% by 2050 — rents likely to lag national; underwrite the cash flow, not the appreciation.
- At projected returns (5.7% appreciation + 3.0% rent growth), your $27k cash investment doubles in ~4 years — after that, you're playing with house money.
- By year 6, paydown + projected appreciation supports a ~$33k cash-out refi (75% LTV) — recoverable capital for the next deal without selling this one.
Negotiation context
- It's been on market 77 days — a 6% lower offer ($89k) is reasonable based on typical stale-listing flexibility.
Questions for the listing agent
- It's been on market 77 days. Have you received any prior offers? Is the seller open to a 6% concession, seller financing, or rate buy-down credit?
- Have any recent inspections been done? Can we get a copy of the seller's disclosures and any deferred-maintenance estimates?
- Why hasn't it sold? Are there any deal-killer items the seller is aware of (foundation, flood, title, zoning, code violations)?
- Is there a deadline driving the sale (1031 exchange, divorce, estate, relocation)? That informs how much negotiation room exists.
- Schools are D-rated, which usually means shorter tenancies and higher turnover. Who's the typical renter profile here, and what's been the actual vacancy rate?
- Crime grade is F in this area — have there been break-ins, vandalism, or insurance claims at this property in the last 3 years? What carrier currently insures it and at what premium?
- What's the average days-on-market for RENTAL listings here right now (not sales)? A rising rental-DOM trend means longer vacancies and softer asking-rent achievability than the comps imply.
- What's the recent tenant-quality profile in this submarket — average credit score on applications, eviction rate, late-payment / NSF rate, and stable-employment percentage? A property-management company in the area should have these aggregated.
- How much new for-sale + rental construction is in the pipeline within 1–3 miles? Heavy new supply typically softens prices + rents 12–24 months out; constrained supply supports both.
Investment metrics
- 1% rule
- 1.11% ✓
- Cap rate
- 8.55%
- Cash-on-cash
- 8.08%
- DSCR
- 1.36
- GRM
- 7.5
CMA / ARV
- ARV (on-the-fly)
- $92,300
- Comps found
- 1
Show comp detail 1 sale within ~0.75 mi
| Address | Dist | Beds/Ba | Sqft | Sold | Price | $/sf | Match |
|---|---|---|---|---|---|---|---|
| 100 Hereford Ave | 0.27mi | 2/2.0 | 1,400 (+8%) | 19mo | $100,000 | $71 | 59 |
Match score weights: distance 35% · size 25% · config 20% · recency 20%. Top-matched comps best support the ARV.
Projected returns pro-forma
5.72% appreciation · 3.0% rent growth · sell at horizon
- IRR
- 21.4%
- Equity multiple
- 2.40×
- Total profit
- $37,269
- Equity at exit
- $58,043
- IRR
- 20.6%
- Equity multiple
- 4.80×
- Total profit
- $101,173
- Equity at exit
- $103,839
Cash invested: $26,600 (down + closing). Projections, not guarantees.
Landlord ↔ Tenant lean methodology
- Overall (STATE)
- 83 Strongly Landlord-Friendly
- State Oklahoma
- 83 Strongly Landlord-Friendly · R+20
- County
- — inherits STATE
- City
- — inherits STATE
ZIP-level market 73552
- Home prices YoY
- 4.0%
- Active inventory
- 4
- Price-to-rent
- 7.5×
Monthly cashflow live
- Estimated rent
- $1,058 medium interval (Pro) →
- Mortgage (P&I)
- −$498
- Tax est. 1.5%
- −$119 /mo · $1,425/yr
- Insurance
- −$40
- HOA
- −$0
- Vacancy / Maint / Mgmt
- −$222
- Net cashflow
- $179
Break-even live
Sensitivity live
| Price | -10% $245 | -5% $212 | +0% $179 | +5% $146 | +10% $113 |
|---|---|---|---|---|---|
| Rent | -10% $95 | -5% $137 | +0% $179 | +5% $221 | +10% $263 |
| Rate | -1.0pp $227 | -0.5pp $203 | base $179 | +0.5pp $154 | +1.0pp $129 |
UW: 25.0% down · 7.5% · 30yr · 1.5% tax · 5.0% vac · 8.0% maint · 8.0% mgmt
Financing live
Cash to close
- Down payment
- $23,750
- Closing costs
- $2,850
- Reserves months
- —
- Total cash needed
- —
Loan-product check · same deal, 3 products live
Conventional
25% down · 7.5% · 30yr
- Down + closing
- —
- Monthly P&I
- —
- Monthly cashflow
- —
- DSCR
- —
- Eligible?
- —
Personal DTI + credit; lowest rate.
DSCR
20% down · 8.5% · 30yr
- Down + closing
- —
- Monthly P&I
- —
- Monthly cashflow
- —
- DSCR
- —
- Eligible?
- —
No personal income docs; deal must DSCR.
Hard money
10% down · 12.0% · 12mo
- Down + closing
- —
- Monthly P&I
- —
- Monthly cashflow
- —
- DSCR
- —
- Eligible?
- —
Short-term bridge; refi at stabilization.
Listing history 18 events
-
2026-06-19days on market $95,000 Active 77 DOM
-
2026-06-18days on market $95,000 Active 76 DOM
-
2026-06-17days on market $95,000 Active 75 DOM
-
2026-06-16days on market $95,000 Active 74 DOM
-
2026-06-15days on market $95,000 Active 73 DOM
-
2026-06-14days on market $95,000 Active 71 DOM
-
2026-06-13days on market $95,000 Active 70 DOM
-
2026-06-10days on market $95,000 Active 68 DOM
-
2026-06-09days on market $95,000 Active 67 DOM
-
2026-06-08days on market $95,000 Active 66 DOM
-
2026-06-07days on market $95,000 Active 65 DOM
-
2026-06-03days on market $95,000 Active 61 DOM
-
2026-06-02days on market $95,000 Active 60 DOM
-
2026-06-01days on market $95,000 Active 59 DOM
-
2026-05-31days on market $95,000 Active 58 DOM
-
2026-05-30days on market $95,000 Active 57 DOM
-
2026-04-25price $95,000
-
2026-04-03$105,000 Active
ⓘ Source: listings_history table (triggers on properties + properties_extension) + one-shot
backfill from property_details.listing_events for pre-trigger history.
Nearby sold comps map
Loading sold comps map…
Walkable amenities ~0.75 mi
Loading nearby amenities…
Taxation est. · year 1
- Rental income
- $12,692
- − Mortgage interest
- −$5,321
- − Property taxes
- −$1,425
- − Insurance
- −$475
- − Repairs & maintenance
- −$1,015
- − Management
- −$1,015
- − Depreciation
- −$2,764
- Taxable income
- $676
- Est. tax owed @ 24.0%
- −$162
- After-tax cash flow
- $1,986/yr
For passive investors: Depreciation is non-cash, so a rental often shows a tax loss while cash-flowing — sheltering income. Rental losses are passive: they offset passive income freely, and up to $25,000/yr can offset ordinary (W-2) income if you actively participate and your MAGI is under $100k (phasing out to $0 by $150k); unused losses carry forward. On sale, claimed depreciation is recaptured at up to 25%, and gains may owe capital-gains tax (a 1031 exchange can defer both). Figures are a year-1 estimate at your 24.0% rate — not tax advice; consult a CPA.
Condition & rehab AI · 13 photos
The property requires moderate repairs and maintenance, including painting and landscaping, to improve its curb appeal and interior aesthetics, which would increase its resale and rental value.
Repairs flagged
- Moderate Siding — Weathered and needs repainting
- Moderate Paint — Worn and needs touch-up
Value-add opportunities
- Both Painting and repainting the exterior and interior — Enhances curb appeal and interior aesthetics
- Both Landscaping and curb appeal improvements — Improves curb appeal and enhances property value
- Both Kitchen updates — Modernizes the kitchen and increases functionality
- Both Bathroom updates — Enhances the bathrooms and improves overall living experience
Renovation cost estimate screening
| Repair item | Severity | Est. cost |
|---|---|---|
| Siding · Weathered and needs repainting | Moderate | $3,000–15,000 |
| Paint · Worn and needs touch-up | Moderate | $3,000–15,000 |
| Total estimated repair cost · 2 items | $6,000–30,000 |
Value-add ROI direction
- Both Painting and repainting the exterior and interior — Enhances curb appeal and interior aesthetics ↑
- Both Landscaping and curb appeal improvements — Improves curb appeal and enhances property value ↑
- Both Kitchen updates — Modernizes the kitchen and increases functionality ↑
- Both Bathroom updates — Enhances the bathrooms and improves overall living experience ↑
ⓘ Cost ranges are severity-bucket heuristics (US national rule-of-thumb). Get contractor quotes + a written scope before underwriting a rehab budget.
Schools (NCES district)
- District
- Indiahoma
- NCES district ID
- 4015420
- Math proficiency
- 10% ▬ 0.00%
- Reading proficiency
- 20% ▼ -10.00%
- Median HH income
- $52,168
- Composite
- 17.4/100
- National rank
- #14151
- State rank
- #453 of 513 in OK
Livability — Indiahoma
- Score
- 58/100
- State rank
- #450
- US rank
- #21442
Category grades
Schools grade is shown separately in the Schools card above.
Census & demographics
- Census place
- Indiahoma, OK
- Population (ZIP)
- 1,367
Population outlook (Comanche County) Hauer SSP2
- Today (2025)
- 124,518 people
- By 2030
- 124,231 · -0.2%
- By 2040
- 122,193 · -1.9%
- By 2050
- 120,368 · -3.3%
- By 2075
- 120,492 · -3.2%
- By 2100
- 123,113 · -1.1%
Race, ethnicity, and origin ACS 2023
- Neighborhood character
- Predominantly White (77%)
- Race & ethnicity
- White 77% Native American 12% Two or more races 7% Hispanic / Latino 3%
- Common ancestry
- Iranian 5% Lithuanian 2% Scotch-Irish 2%
- Foreign-born
- 2% · Canada, South Korea
- Languages at home
- 96% English-only · German/W. Germanic 2% Spanish 1%
Political lean MEDSL · Comanche
- 2024 margin
- Strong R (+23.3) · D 37.4% · R 60.7% · Other 1.9%
- 2008→2024 swing
- -5.8pp toward R · 2008: -17.5pp · 2024: -23.3pp
- All cycles
- 2024: R+23.3 2020: R+20.1 2016: R+23.7 2012: R+17.0 2008: R+17.5
Not yet ingested
- Civics
- —
Market trends
- HPI YoY
- ▲ 5.72%
- Current HPI
- 149.9901
- Rent YoY
- —
- Metro
- —
- State GDP YoY
- ▲ 1.55%
- F500 in state
- 6
Industry mix (Fortune 500 HQ in OK)
| Industry | F500 HQs | Revenue |
|---|---|---|
| Energy | 3 | $48B |
|
||
Price history
-9.5% since first listed2 events — show timeline
- 2026-04-25 Price Changed $95,000 DAOR
- 2026-04-03 Listed $105,000 DAOR
Cash-flow waterfall
monthlySold comps — $/sqft
last 12 mo · ≤1 miLoading sold comps…