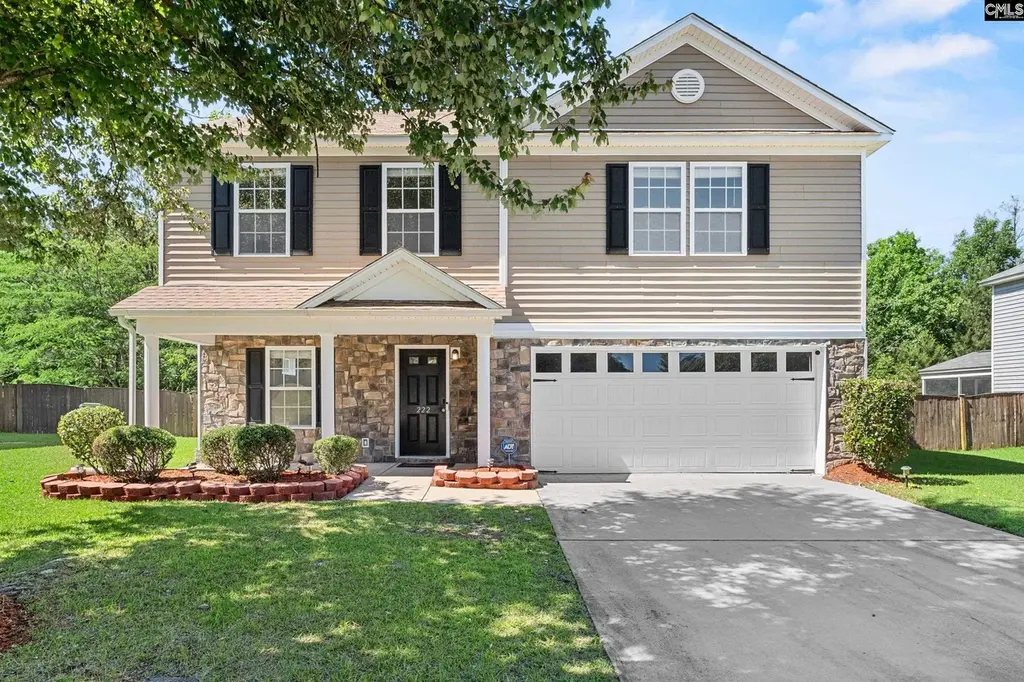
222 Sepia Ct · Blythewood, SC
Flood risk 1/10 · Minimal
- FEMA flood zone
- X (unshaded)
- Chance of flooding over 30 yrs
- 0.0%
- Est. flood insurance / yr
- $507 – $1,088
Fire risk 2/10 · Minimal
- Est. fire insurance / yr
- $783 – $1,453
Heat risk 6/10 · Moderate
- Hot days now (above 107°F)
- 7 days/yr
- Hot days in 30 yrs
- 16 days/yr
Wind risk 6/10 · Moderate
- Chance of severe wind over 30 yrs
- 62.0%
Air-quality risk 3/10 · Minor
- Unhealthy air days now
- 2 days/yr
- Unhealthy air days in 30 yrs
- 3 days/yr
Risk factors via First Street. Map © Google.
Why this score? — see what drove the D- grade
The composite is a weighted blend of 9 inputs, each scored 0–100. Each bar is that input's sub-score; the figure is the points it added to the 100-point composite (weight × sub-score).
- Cash flow +12.6/30.0
- ARV discount +5.7/15.0
- DSCR +3.7/10.0
- Schools +3.6/10.0
- Livability +3.5/5.0
- Rent growth +3.2/5.0
- 1% rule +2.7/10.0
- Condition / age +2.5/5.0
- Appreciation +0.0/10.0
$299,000
🖨 Deal sheet 📄 Offer letter ✓ Due diligence
Listing remarks
Charming and well-maintained home with private fenced backyard backing to woods! This move-in ready home has plenty of space for the whole family! This property offers a spacious layout with comfortable living areas, a bright kitchen, and a private backyard perfect for relaxing or entertaining. Granite countertops throughout kitchen and all 3 full baths! The owner's suite is a true retreat with huge sitting area to relax or work from home! Don't sleep on this one or you won't sleep in it! Conveniently located near shopping, dining, and top-rated schools, it’s an ideal place to call home. Some photos virtually staged Disclaimer: CMLS has not reviewed and, therefore, does not endorse
Key facts
- Backs to woods
- Granite countertops
- Owner's suite
Tags
Property features AI
Finance
- HOA & community: Property is part of an association
Exterior
- Parking: Attached garage with 2 spaces (garage at main level)
- Utilities: Public water; Public sewer
- Home design: Two-story home; Paved road access
- Construction: Slab foundation
- Exterior features: Patio; Sprinkler system; Partial wood fencing; Stone and vinyl exterior
Interior
- Kitchen: Island; Breakfast bar / counter seating; Eat-in area; Pantry; Granite countertops; Dishwasher; Disposal; Microwave (above stove); Free‑standing range with self‑cleaning feature
- Bedrooms: Primary suite with cathedral ceilings, double vanity, garden tub, private bath, separate shower, sitting area, walk-in closet, and high ceilings (located on the second floor); Additional bedrooms located on the second floor
- Bathrooms: Three full bathrooms; One half bathroom; Secondary full bathrooms (three) — configuration indicates multiple full baths on second level
- Heating & cooling: Central heating; Central air conditioning
- Interior features: Garage opener; Smoke detector; Attic access; Cable TV available
- Laundry & utility: Laundry located on the second floor; Laundry/heated space
Neighborhood map
What this means for you Summary
Snapshot
- This is a 4-bed/4.0-bath single-family listed at $299k.
Deal economics
- At list price, monthly cash flow is $-39 ($-473/yr) — negative.
- To cash-flow at today's rent, offer at most $292k (2.3% below list).
- To meet the 1% rule (rent ≥ 1% of price), the offer needs to be $230k (23.1% below list).
- Recommended offer: $230k (23.1% below list) — sets the bar for 1% rule.
Location & tenants
- Location reads 70/100 on livability (#58 in SC) — a middle-class / working-renter tenant base. Strengths: crime A+, employment A+, housing A+; Watch: amenities F, commute F, health & safety F.
- Richland 02 (suburban): math 35% / reading 47% proficiency, ranked #29 of 80 in SC (top 36%) — families likely to look elsewhere, expect single-tenant / working-renter base with shorter leases.
- Zoned schools: Sandlapper Elementary (math 30% / reading 34%, grade F, #369 of 597 statewide, top 64%, 656 students, 71% FRL); Blythewood High (math 72% / reading 92%, grade A, #19 of 196 statewide, top 10%, 2,094 students, 39% FRL) — zoned schools average 55% FRL vs 38% district-wide (17 pts higher); higher-poverty schools than district average — tighter screening recommended.
- Zoned-school proficiency averages 57% at this address vs 41% district-wide (+16 pts) — the actual schools serving this property are materially stronger than the Richland 02 average implies; a family-tenant draw the district grade alone would hide.
- Market conditions: Rents rising (+2.8%/yr); 406 active listings in the ZIP; 12 comparable units currently listed for rent nearby; rentals leasing fast (median 3d on market — plan ~1-2 weeks tenant-placement turnaround); 3,472 units permitted in Richland County in 2024 (1,096 in 5+ unit buildings).
- This rent runs 37% of the median local income ($74k/yr) — at the standard rent-burdened threshold; future hikes will face affordability resistance.
Forward outlook
- Local home prices are declining (-3.0%/yr); year-one equity from $2k of loan paydown is wiped out by about $9k of value loss. Plan a longer hold.
- Richland County population projected at +30% by 2050 — long-run rental-demand tailwind backs the buy-and-hold thesis.
Negotiation context
- It's been on market 30 days — a 2% lower offer ($295k) is reasonable based on typical stale-listing flexibility.
Risks & watch-outs
- Climate carrying-cost: major wind risk, 62% chance of damaging wind over 30y; extreme-heat days projected 7→16/yr by 2055 (HVAC capex compounding) — expect insurance premiums to compound above CPI over the hold.
Questions for the listing agent
- What do current leases actually rent for vs. the listed asking? Can we see a recent rent roll and the last 12 months of T-12 income?
- What does the HOA fee cover, when was the last increase, and are there any pending special assessments or reserve-fund shortfalls?
- Is there a deadline driving the sale (1031 exchange, divorce, estate, relocation)? That informs how much negotiation room exists.
- Schools are B-rated — typically a magnet for longer-tenancy family renters. What's the average tenant stay here, and is there a school-zone premium baked into asking?
- The area grade is low — what's the realistic commute time and amenity access for the typical tenant pool here? Any planned neighborhood developments (good or bad) we should know about?
- What's the average days-on-market for RENTAL listings here right now (not sales)? A rising rental-DOM trend means longer vacancies and softer asking-rent achievability than the comps imply.
- What's the recent tenant-quality profile in this submarket — average credit score on applications, eviction rate, late-payment / NSF rate, and stable-employment percentage? A property-management company in the area should have these aggregated.
- How much new for-sale + rental construction is in the pipeline within 1–3 miles? Heavy new supply typically softens prices + rents 12–24 months out; constrained supply supports both.
Investment metrics
- 1% rule
- 0.77% ✗
- Cap rate
- 6.13%
- Cash-on-cash
- -0.57%
- DSCR
- 0.97
- GRM
- 10.8
CMA / ARV
- ARV (on-the-fly)
- $287,496
- Comps found
- 1
Show comp detail 1 sale within ~0.75 mi
| Address | Dist | Beds/Ba | Sqft | Sold | Price | $/sf | Match |
|---|---|---|---|---|---|---|---|
| 288 Big Game Loop | 0.21mi | 3/2.0 (-1) | 2,071 (-13%) | 20mo | $250,000 | $121 | 39 |
Match score weights: distance 35% · size 25% · config 20% · recency 20%. Top-matched comps best support the ARV.
Projected returns pro-forma
-3.0% appreciation · 2.81% rent growth · sell at horizon
- IRR
- -17.5%
- Equity multiple
- 0.38×
- Total profit
- $-51,495
- Equity at exit
- $44,582
- IRR
- -9.9%
- Equity multiple
- 0.40×
- Total profit
- $-50,251
- Equity at exit
- $25,852
Cash invested: $83,720 (down + closing). Projections, not guarantees.
Landlord ↔ Tenant lean methodology
- Overall (STATE)
- 90 Strongly Landlord-Friendly
- State South Carolina
- 90 Strongly Landlord-Friendly · R+6
- County
- — inherits STATE
- City
- — inherits STATE
ZIP-level market 29229
- Home prices YoY
- -21.5%
- Rents YoY
- 2.8%
- Active inventory
- 406
- Price-to-rent
- 10.8×
Monthly cashflow live
- Estimated rent
- $2,300 high interval (Pro) →
- Mortgage (P&I)
- −$1,568
- Tax from tax record
- −$124 /mo · $1,488/yr
- Insurance
- −$125
- HOA
- −$40
- Vacancy / Maint / Mgmt
- −$483
- Net cashflow
- $-39
Break-even live
UW: 25.0% down · 7.5% · 30yr · 1.5% tax · 5.0% vac · 8.0% maint · 8.0% mgmt
Financing live
Cash to close
- Down payment
- $74,750
- Closing costs
- $8,970
- Reserves months
- —
- Total cash needed
- —
Loan-product check · same deal, 3 products live
Conventional
25% down · 7.5% · 30yr
- Down + closing
- —
- Monthly P&I
- —
- Monthly cashflow
- —
- DSCR
- —
- Eligible?
- —
Personal DTI + credit; lowest rate.
DSCR
20% down · 8.5% · 30yr
- Down + closing
- —
- Monthly P&I
- —
- Monthly cashflow
- —
- DSCR
- —
- Eligible?
- —
No personal income docs; deal must DSCR.
Hard money
10% down · 12.0% · 12mo
- Down + closing
- —
- Monthly P&I
- —
- Monthly cashflow
- —
- DSCR
- —
- Eligible?
- —
Short-term bridge; refi at stabilization.
Rent comps 12 comps
| Address | Beds | Baths | Sqft | Rent | $/sqft | DOM | Units | Dist |
|---|---|---|---|---|---|---|---|---|
| 608 Cottontail Ct N Columbia, SC | 4.0 | 2.0 | 1701 | $2,139 | $1.26 | 3d | 1 | 0.38mi |
| 13 Coral Ct Columbia, SC | 5.0 | 2.5 | 2424 | $2,469 | $1.02 | 23d | 1 | 0.56mi |
| 830 Wing Stripe Ct Columbia, SC | 5.0 | 3.5 | 3044 | $2,395 | $0.79 | 3d | 1 | 0.61mi |
| 213 Sagamare Rd Columbia, SC | 4.0 | 3.0 | 1664 | $1,970 | $1.18 | 23d | 1 | 0.62mi |
| 102 Petworth Dr Columbia, SC | 4.0 | 3.0 | 1664 | $2,050 | $1.23 | 2d | 1 | 0.94mi |
| 429 Buttonbush Ct Columbia, SC | 4.0 | 2.5 | 2715 | $1,995 | $0.73 | 2d | 1 | 1.05mi |
| 2108 Wilkinson Dr Columbia, SC | 4.0 | 2.5 | 2181 | $2,139 | $0.98 | 2d | 1 | 1.07mi |
| 13 Tomafield Ct Columbia, SC | 3.0 | 2.0 | 1721 | $2,000 | $1.16 | 3d | 1 | 1.10mi |
| 412 Killian Green Dr Columbia, SC | 3.0 | 2.5 | 2280 | $1,999 | $0.88 | 11d | 1 | 1.17mi |
| 221 Meyer Ln Columbia, SC | 4.0 | 3.5 | 2184 | $2,349 | $1.08 | 14d | 1 | 1.18mi |
| 621 Heron Glen Dr Columbia, SC | 4.0 | 2.5 | 2195 | $2,095 | $0.95 | 3d | 1 | 1.39mi |
| 669 Pine Lilly Dr Columbia, SC | 4.0 | 2.5 | 2912 | $2,595 | $0.89 | 23d | 1 | 1.41mi |
HOA detail
- Monthly dues
- $40 · $480/yr
Listing history 16 events
-
2026-06-18days on market $299,000 Active 30 DOM
-
2026-06-17days on market $299,000 Active 29 DOM
-
2026-06-16days on market $299,000 Active 28 DOM
-
2026-06-15days on market $299,000 Active 27 DOM
-
2026-06-14days on market $299,000 Active 25 DOM
-
2026-06-13days on market $299,000 Active 24 DOM
-
2026-06-10days on market $299,000 Active 22 DOM
-
2026-06-09days on market $299,000 Active 21 DOM
-
2026-06-08days on market $299,000 Active 20 DOM
-
2026-06-07days on market $299,000 Active 19 DOM
-
2026-06-05pricedays on market $299,000 Active 16 DOM
-
2026-06-03days on market $300,000 Active 15 DOM
-
2026-06-03days on market $300,000 Active 14 DOM
-
2026-06-01days on market $300,000 Active 13 DOM
-
2026-05-31days on market $300,000 Active 12 DOM
-
2026-05-19$300,000 Active
ⓘ Source: listings_history table (triggers on properties + properties_extension) + one-shot
backfill from property_details.listing_events for pre-trigger history.
Tax reassessment forecast SC · Resets to sale price
- Current annual tax
- $1,488 · $124/mo
- Projected year-2 tax
- $1,704 · $142/mo
- Expected delta
- +$216/yr (+$18/mo · 14.5%)
ⓘ Screening estimate from a state-policy table — verify with the county assessor before closing.
Climate risk First Street
- Flood 1/10 Low FEMA zone X (unshaded) · 0% chance over 30 yrs
- Wildfire 2/10 Low
- Heat 6/10 Major 7 d/yr ≥107°F today · 16 d/yr by 30 yrs out
- Wind 6/10 Major 62% chance of damaging wind over 30 yrs
- Air quality 3/10 Moderate 2 unhealthy d/yr today · 3 by 30 yrs out
Nearby sold comps map
Loading sold comps map…
Walkable amenities ~0.75 mi
Loading nearby amenities…
Taxation est. · year 1
- Rental income
- $27,602
- − Mortgage interest
- −$16,749
- − Property taxes
- −$1,488
- − Insurance
- −$1,495
- − Repairs & maintenance
- −$2,208
- − Management
- −$2,208
- − HOA
- −$480
- − Depreciation
- −$8,698
- Taxable loss
- −$5,724
- Est. tax savings @ 24.0%
- +$1,374
- After-tax cash flow
- $901/yr
For passive investors: Depreciation is non-cash, so a rental often shows a tax loss while cash-flowing — sheltering income. Rental losses are passive: they offset passive income freely, and up to $25,000/yr can offset ordinary (W-2) income if you actively participate and your MAGI is under $100k (phasing out to $0 by $150k); unused losses carry forward. On sale, claimed depreciation is recaptured at up to 25%, and gains may owe capital-gains tax (a 1031 exchange can defer both). Figures are a year-1 estimate at your 24.0% rate — not tax advice; consult a CPA.
Schools (NCES district)
- District
- Richland 02
- NCES district ID
- 4503390
- Math proficiency
- 35% ▼ -15.00%
- Reading proficiency
- 47% ▼ -5.00%
- Median HH income
- $59,684
- Composite
- 36.2/100
- National rank
- #4730
- State rank
- #29 of 80 in SC
Livability — Blythewood
- Score
- 70/100
- State rank
- #58
- US rank
- #7406
Category grades
Schools grade is shown separately in the Schools card above.
Census & demographics
- County
- Richland County · 389,530 people
- City population
- 30,454
- Metro
- Columbia, SC
- Population (ZIP)
- 51,861
- Household income
- $74,043
- Rent vs Own
- Severe rent burden
- 1939.0
Population outlook (Richland County) Hauer SSP2
- Today (2025)
- 459,667 people
- By 2030
- 487,524 · +6.1%
- By 2040
- 542,035 · +17.9%
- By 2050
- 595,371 · +29.5%
- By 2075
- 732,998 · +59.5%
- By 2100
- 820,415 · +78.5%
Race, ethnicity, and origin ACS 2023
- Neighborhood character
- Diverse neighborhood (Simpson 0.56)
- Race & ethnicity
- Black 62% White 24% Hispanic / Latino 8% Two or more races 6% Asian 3%
- Hispanic origin (detail)
- Mexican 2% Puerto Rican 2%
- Common ancestry
- Slovak 1% Lithuanian 1% Romanian 1%
- Foreign-born
- 7% · Canada, South Korea, Jamaica
- Languages at home
- 89% English-only · Spanish 6% Other Indo-European 1% Korean 1%
Political lean MEDSL · Richland
- 2024 margin
- Solid D (+34.6) · D 66.4% · R 31.8% · Other 1.8%
- 2008→2024 swing
- +5.7pp toward D · 2008: 28.9pp · 2024: 34.6pp
- All cycles
- 2024: D+34.6 2020: D+38.3 2016: D+32.9 2012: D+33.3 2008: D+28.9
Not yet ingested
- Civics
- —
Market trends
- HPI YoY
- ▼ -51.11%
- Current HPI
- 186.782
- Rent YoY
- ▲ 2.81%
- Metro
- Columbia, SC
- State GDP YoY
- ▲ 4.51%
- F500 in state
- 2
Industry mix (Fortune 500 HQ in SC)
| Industry | F500 HQs | Revenue |
|---|---|---|
| Packaging | 1 | $7B |
|
||
Price history
1 event — show timeline
- 2026-05-19 Listed $300,000 Consolidated MLS
Property tax history
+1.7%/yrLatest (2025): $1,488 · +3.6% YoY. Source: county tax records.
Cash-flow waterfall
monthlySold comps — $/sqft
last 12 mo · ≤1 miLoading sold comps…