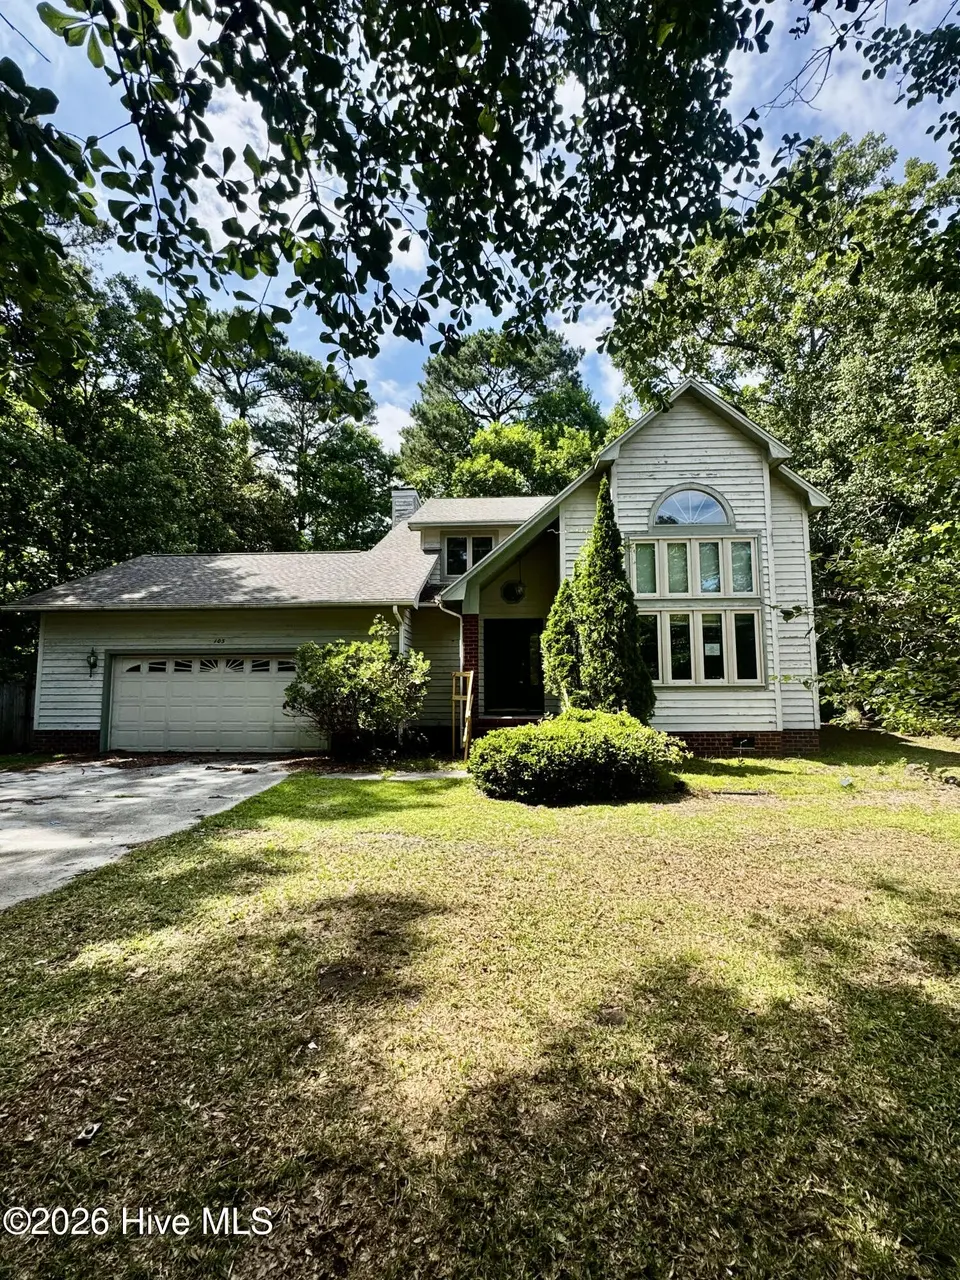
103 Willbarry Rd · Jacksonville, NC
Flood risk 1/10 · Minimal
- FEMA flood zone
- X (unshaded)
- Chance of flooding over 30 yrs
- 0.0%
- Est. flood insurance / yr
- $507 – $1,088
Fire risk 5/10 · Moderate
- Est. fire insurance / yr
- $906 – $1,684
Heat risk 8/10 · Major
- Hot days now (above 105°F)
- 7 days/yr
- Hot days in 30 yrs
- 18 days/yr
Wind risk 8/10 · Major
- Chance of severe wind over 30 yrs
- 98.0%
Air-quality risk 2/10 · Minimal
- Unhealthy air days now
- 1 days/yr
- Unhealthy air days in 30 yrs
- 2 days/yr
Risk factors via First Street. Map © Google.
Why this score? — see what drove the D+ grade
The composite is a weighted blend of 9 inputs, each scored 0–100. Each bar is that input's sub-score; the figure is the points it added to the 100-point composite (weight × sub-score).
- ARV discount +15.0/15.0
- Cash flow +13.9/30.0
- DSCR +4.2/10.0
- Schools +3.9/10.0
- Rent growth +3.6/5.0
- Livability +3.6/5.0
- 1% rule +3.3/10.0
- Condition / age +2.5/5.0
- Appreciation +0.0/10.0
$199,000
🖨 Deal sheet (PDF) 📄 Offer letter ✓ Due diligence
Listing remarks
Desirable neighborhood with no City Taxes or HOA's, a subdivision where homes were built with their own charm no cookie cutter homes or the same floorplan right next door. This one has been neglected of recent TLC, but the charm is still there waiting for someone to bring life back into to this house so a family can call it home. This 2-story home has 3 bedrooms, 2 1/2 bath living room and dining room combination, kitchen and eat in area, Family room with a fireplace, 3 bedrooms 2 bath upstairs. Several nice features include the enclosed sunroom, 2 car garage, nice private back yard.
Key facts
- Enclosed sunroom
- Private back yard
- 0.49 acre lot
Tags
Property features AI
Exterior
- Parking: Attached 2-car garage; Paved parking
- Utilities: Public water; Septic tank sewer; Cable available
- Home design: Single family residence; Two levels; Entry level 1
- Construction: Cedar and frame construction; Slab foundation; Built recently (year built not provided)
- Exterior features: Deck; Partial wood fencing (fenced); Shingle roof; Shed(s); Has view; Paved road access (city street / state road)
Interior
- Kitchen: Dishwasher; Electric range; Microwave; Pantry; Eat-in kitchen
- Bedrooms: Total rooms: 7
- Flooring: Carpet; Ceramic tile
- Bathrooms: 2 full bathrooms; 1 half bathroom
- Heating & cooling: Heat pump heating; Electric heating; Ceiling fan(s); Heat pump cooling
- Interior features: Walk-in closet(s); Vaulted ceiling(s); Entrance foyer; Ceiling fan(s); Pantry; Eat-in kitchen
- Laundry & utility: Washer; Dryer; Laundry room; Electric water heater
Neighborhood map
What this means for you Summary
Snapshot
- This is a 3-bed/2.5-bath single-family listed at $199k.
Deal economics
- At list price, monthly cash flow is $23 ($277/yr) — positive.
- The deal already cash-flows at list — no discount required.
- To meet the 1% rule (rent ≥ 1% of price), the offer needs to be $165k (17.2% below list).
- Recommended offer: $165k (17.2% below list) — sets the bar for 1% rule.
- Cap rate 6.4% vs local median 4.4% in Jacksonville — top-decile yield for the area; either an underpriced asset or a hidden risk that comps aren't pricing in. Stress-test before assuming the spread holds.
Location & tenants
- Location reads 71/100 on livability (#111 in NC) — a middle-class / working-renter tenant base. Strengths: cost of living A+, housing A+, health & safety A+; Watch: employment D, crime F, amenities F.
- Onslow County Schools (other): math 42% / reading 49% proficiency, ranked #84 of 178 in NC (top 47%) — families likely to look elsewhere, expect single-tenant / working-renter base with shorter leases.
- Zoned schools: Blue Creek Elementary (math 42% / reading 47%, grade F, #574 of 1,410 statewide, top 43%, 490 students, 66% FRL); Southwest Middle (math 22% / reading 42%, grade F, #317 of 475 statewide, top 68%, 527 students, 64% FRL); Southwest High (math 52% / reading 47%, grade D, #311 of 535 statewide, top 60%, 702 students, 54% FRL) — zoned schools average 61% FRL vs 37% district-wide (25 pts higher); higher-poverty schools than district average — tighter screening recommended.
- Market conditions: Rents rising fast (+4.5%/yr); 386 active listings in the ZIP; 2 comparable units currently listed for rent nearby; 1,246 units permitted in Onslow County in 2024 (0 in 5+ unit buildings).
- This rent runs 30% of the median local income ($66k/yr) — at the standard rent-burdened threshold; future hikes will face affordability resistance.
Forward outlook
- Local home prices are declining (-3.0%/yr); year-one equity from $1k of loan paydown is wiped out by about $6k of value loss. Plan a longer hold.
Negotiation context
- Only 8 days on market — expect competitive offers; lowballing is unlikely to land.
Risks & watch-outs
- Climate carrying-cost: severe wind risk, 98% chance of damaging wind over 30y; moderate wildfire risk; extreme-heat days projected 7→18/yr by 2055 (HVAC capex compounding) — expect insurance premiums to compound above CPI over the hold.
Questions for the listing agent
- Is there a deadline driving the sale (1031 exchange, divorce, estate, relocation)? That informs how much negotiation room exists.
- Crime grade is F in this area — have there been break-ins, vandalism, or insurance claims at this property in the last 3 years? What carrier currently insures it and at what premium?
- The area grade is low — what's the realistic commute time and amenity access for the typical tenant pool here? Any planned neighborhood developments (good or bad) we should know about?
- What's the average days-on-market for RENTAL listings here right now (not sales)? A rising rental-DOM trend means longer vacancies and softer asking-rent achievability than the comps imply.
- What's the recent tenant-quality profile in this submarket — average credit score on applications, eviction rate, late-payment / NSF rate, and stable-employment percentage? A property-management company in the area should have these aggregated.
- How much new for-sale + rental construction is in the pipeline within 1–3 miles? Heavy new supply typically softens prices + rents 12–24 months out; constrained supply supports both.
Investment metrics
- 1% rule
- 0.83% ✗
- Cap rate
- 6.43%
- Cash-on-cash
- 0.50%
- DSCR
- 1.02
- GRM
- 10.1
CMA / ARV
- ARV (on-the-fly)
- $336,186
- Comps found
- 6
Show comp detail 6 sales within ~0.75 mi
| Address | Dist | Beds/Ba | Sqft | Sold | Price | $/sf | Match |
|---|---|---|---|---|---|---|---|
| 105 Willbarry Rd | 0.02mi | 4/2.5 (+1) | 2,075 (+6%) | 4mo | $330,400 | $159 | 81 |
| 110 Deerfield Rd | 0.05mi | 3/2.0 | 1,823 (-7%) | 8mo | $334,000 | $183 | 77 |
| 107 Riverbend Rd | 0.16mi | 3/2.5 | 2,208 (+12%) | 2mo | $368,000 | $167 | 70 |
| 516 Carriage Ln | 0.17mi | 4/2.5 (+1) | 2,192 (+12%) | 0mo | $375,000 | $171 | 67 |
| 202 Willbarry Rd | 0.09mi | 3/2.5 | 1,728 (-12%) | 14mo | $200,000 | $116 | 64 |
| 231 Country Squire Ln | 0.51mi | 3/2.5 | 2,172 (+10%) | 18mo | $430,000 | $198 | 43 |
Match score weights: distance 35% · size 25% · config 20% · recency 20%. Top-matched comps best support the ARV.
Projected returns pro-forma
-3.0% appreciation · 4.47% rent growth · sell at horizon
- IRR
- -14.0%
- Equity multiple
- 0.49×
- Total profit
- $-28,336
- Equity at exit
- $29,672
- IRR
- -3.2%
- Equity multiple
- 0.78×
- Total profit
- $-12,458
- Equity at exit
- $17,206
Cash invested: $55,720 (down + closing). Projections, not guarantees.
Landlord ↔ Tenant lean methodology
- Overall (STATE)
- 85 Strongly Landlord-Friendly
- State North Carolina
- 85 Strongly Landlord-Friendly · R+3
- County
- — inherits STATE
- City
- — inherits STATE
ZIP-level market 28540
- Home prices YoY
- -21.5%
- Rents YoY
- 4.5%
- Active inventory
- 386
- Price-to-rent
- 10.1×
Monthly cashflow live
- Estimated rent
- $1,649 medium interval (Pro) →
- Mortgage (P&I)
- −$1,044
- Tax from tax record
- −$153 /mo · $1,834/yr
- Insurance
- −$83
- HOA
- −$0
- Vacancy / Maint / Mgmt
- −$346
- Net cashflow
- $23
Break-even live
Sensitivity live
| Price | -10% $136 | -5% $79 | +0% $23 | +5% $-33 | +10% $-90 |
|---|---|---|---|---|---|
| Rent | -10% $-107 | -5% $-42 | +0% $23 | +5% $88 | +10% $153 |
| Rate | -1.0pp $123 | -0.5pp $74 | base $23 | +0.5pp $-28 | +1.0pp $-81 |
UW: 25.0% down · 7.5% · 30yr · 1.5% tax · 5.0% vac · 8.0% maint · 8.0% mgmt
Financing live
Cash to close
- Down payment
- $49,750
- Closing costs
- $5,970
- Reserves months
- —
- Total cash needed
- —
Loan-product check · same deal, 3 products live
Conventional
25% down · 7.5% · 30yr
- Down + closing
- —
- Monthly P&I
- —
- Monthly cashflow
- —
- DSCR
- —
- Eligible?
- —
Personal DTI + credit; lowest rate.
DSCR
20% down · 8.5% · 30yr
- Down + closing
- —
- Monthly P&I
- —
- Monthly cashflow
- —
- DSCR
- —
- Eligible?
- —
No personal income docs; deal must DSCR.
Hard money
10% down · 12.0% · 12mo
- Down + closing
- —
- Monthly P&I
- —
- Monthly cashflow
- —
- DSCR
- —
- Eligible?
- —
Short-term bridge; refi at stabilization.
Rent comps 2 comps
| Address | Beds | Baths | Sqft | Rent | $/sqft | DOM | Units | Dist |
|---|---|---|---|---|---|---|---|---|
| 1162 Shroyer Cir Jacksonville, NC | 3.0 | 2.0 | 1294 | $1,700 | $1.31 | 15d | 1 | 1.19mi |
| 3751 Richlands Hwy Jacksonville, NC | 3.0 | 1.5 | 1250 | $1,600 | $1.28 | 23d | 1 | 1.30mi |
Listing history 7 events
-
2026-06-10status $199,000 Pending 8 DOM
-
2026-06-09days on market $199,000 Active 8 DOM
-
2026-06-09days on market $199,000 Active 7 DOM
-
2026-06-07days on market $199,000 Active 6 DOM
-
2026-06-03days on market $199,000 Active 2 DOM
-
2026-06-01remarks 590-char remark
-
2026-06-01$199,000 Active 1 DOM
ⓘ Source: listings_history table (triggers on properties + properties_extension) + one-shot
backfill from property_details.listing_events for pre-trigger history.
Tax reassessment forecast NC · Resets to sale price
- Current annual tax
- $1,834 · $153/mo
- Projected year-2 tax
- $1,834 · $153/mo
- Expected delta
- $0/yr ($0/mo · 0.0%)
ⓘ Screening estimate from a state-policy table — verify with the county assessor before closing.
Climate risk First Street
- Flood 1/10 Low FEMA zone X (unshaded) · 0% chance over 30 yrs
- Wildfire 5/10 Major
- Heat 8/10 Severe 7 d/yr ≥105°F today · 18 d/yr by 30 yrs out
- Wind 8/10 Severe 98% chance of damaging wind over 30 yrs
- Air quality 2/10 Low 1 unhealthy d/yr today · 2 by 30 yrs out
Nearby sold comps map
Loading sold comps map…
Walkable amenities ~0.75 mi
Loading nearby amenities…
Taxation est. · year 1
- Rental income
- $19,784
- − Mortgage interest
- −$11,147
- − Property taxes
- −$1,834
- − Insurance
- −$995
- − Repairs & maintenance
- −$1,583
- − Management
- −$1,583
- − Depreciation
- −$5,789
- Taxable loss
- −$3,147
- Est. tax savings @ 24.0%
- +$755
- After-tax cash flow
- $1,032/yr
For passive investors: Depreciation is non-cash, so a rental often shows a tax loss while cash-flowing — sheltering income. Rental losses are passive: they offset passive income freely, and up to $25,000/yr can offset ordinary (W-2) income if you actively participate and your MAGI is under $100k (phasing out to $0 by $150k); unused losses carry forward. On sale, claimed depreciation is recaptured at up to 25%, and gains may owe capital-gains tax (a 1031 exchange can defer both). Figures are a year-1 estimate at your 24.0% rate — not tax advice; consult a CPA.
Schools (NCES district)
- District
- Onslow County Schools
- NCES district ID
- 3703450
- Math proficiency
- 42% ▲ 6.00%
- Reading proficiency
- 49% ▲ 5.00%
- Median HH income
- $46,076
- Composite
- 38.66/100
- National rank
- #4148
- State rank
- #84 of 178 in NC
Livability — Jacksonville
- Score
- 71/100
- State rank
- #111
- US rank
- #6991
Category grades
Schools grade is shown separately in the Schools card above.
Census & demographics
- County
- Onslow County · 164,453 people
- City population
- 96,397
- Metro
- Jacksonville, NC
- Population (ZIP)
- 49,141
- Household income
- $65,625
- Rent vs Own
- Severe rent burden
- 1304.0
Population outlook (Onslow County) Hauer SSP2
- Today (2025)
- 189,789 people
- By 2030
- 194,463 · +2.5%
- By 2040
- 193,629 · +2.0%
- By 2050
- 193,248 · +1.8%
- By 2075
- 196,995 · +3.8%
- By 2100
- 201,513 · +6.2%
Race, ethnicity, and origin ACS 2023
- Neighborhood character
- Diverse neighborhood (Simpson 0.58)
- Race & ethnicity
- White 62% Black 14% Hispanic / Latino 14% Two or more races 13% Asian 2%
- Hispanic origin (detail)
- Mexican 5% Puerto Rican 6%
- Common ancestry
- Italian 3% Serbian 2% Romanian 2%
- Foreign-born
- 4% · Canada, China
- Languages at home
- 90% English-only · Spanish 7% Chinese 1% Other Asian/Pacific 1%
Political lean MEDSL · Onslow
- 2024 margin
- Solid R (+35.9) · D 31.5% · R 67.5% · Other 1.0%
- 2008→2024 swing
- -14.5pp toward R · 2008: -21.5pp · 2024: -35.9pp
- All cycles
- 2024: R+35.9 2020: R+30.2 2016: R+34.6 2012: R+27.0 2008: R+21.5
Not yet ingested
- Civics
- —
Market trends
- HPI YoY
- ▼ -60.11%
- Current HPI
- 219.5571
- Rent YoY
- ▲ 4.47%
- Metro
- Jacksonville, NC
- State GDP YoY
- ▲ 3.28%
- F500 in state
- 26
Industry mix (Fortune 500 HQ in NC)
| Industry | F500 HQs | Revenue |
|---|---|---|
| Financial Services | 2 | $213B |
|
||
| Retail | 2 | $95B |
|
||
| Industrial Conglomerate | 1 | $38B |
|
||
| Metals / Steel | 1 | $35B |
|
||
| Utilities | 1 | $30B |
|
||
| Industrial Machinery | 1 | $19B |
|
||
Price history
+15.7% since first listed3 events — show timeline
- 2026-05-30 Listed $199,000 Hive MLS
- 2009-04-01 Sold (Public Records) $220,000 Public Records
- 2004-10-01 Sold (Public Records) $172,000 Public Records
Property tax history
+2.2%/yrLatest (2025): $1,834 · +0.0% YoY. Source: county tax records.
Cash-flow waterfall
monthlySold comps — $/sqft
last 12 mo · ≤1 miLoading sold comps…