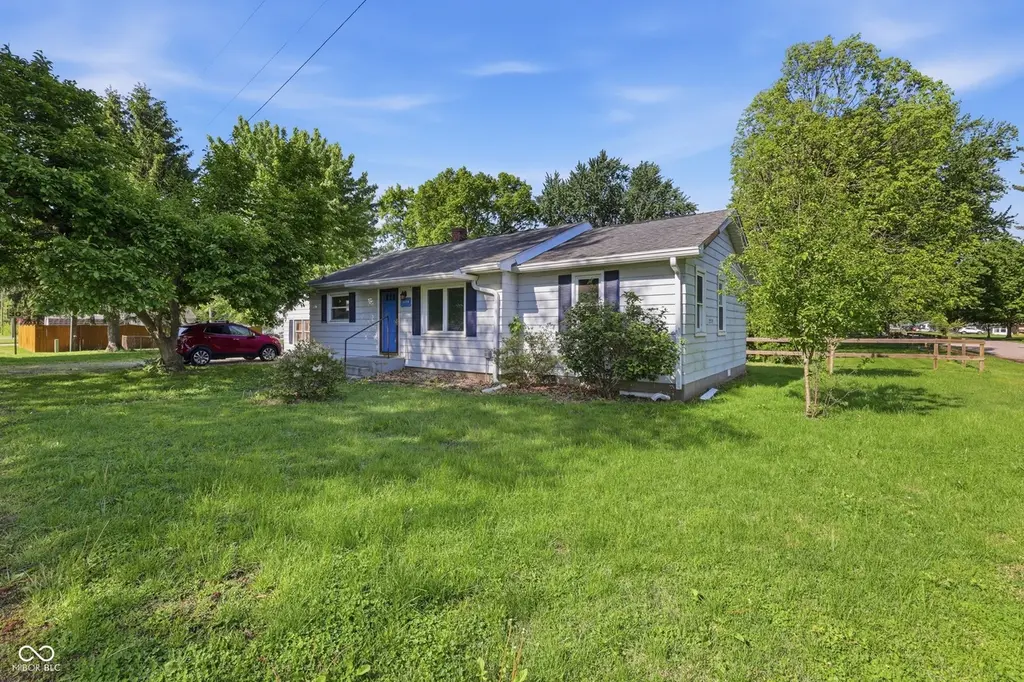
2279 Berne Ave · Terre Haute, IN
Flood risk 3/10 · Minor
- FEMA flood zone
- X (unshaded)
- Chance of flooding over 30 yrs
- 0.2%
- Est. flood insurance / yr
- $473 – $860
Fire risk 1/10 · Minimal
- Est. fire insurance / yr
- $717 – $1,331
Heat risk 4/10 · Minor
- Hot days now (above 105°F)
- 7 days/yr
- Hot days in 30 yrs
- 19 days/yr
Wind risk 2/10 · Minimal
- Chance of severe wind over 30 yrs
- 1.0%
Air-quality risk 3/10 · Minor
- Unhealthy air days now
- 3 days/yr
- Unhealthy air days in 30 yrs
- 4 days/yr
Risk factors via First Street. Map © Google.
Why this score? — see what drove the B grade
The composite is a weighted blend of 9 inputs, each scored 0–100. Each bar is that input's sub-score; the figure is the points it added to the 100-point composite (weight × sub-score).
- Cash flow +28.1/30.0
- ARV discount +15.0/15.0
- DSCR +10.0/10.0
- 1% rule +6.9/10.0
- Livability +3.8/5.0
- Schools +2.9/10.0
- Rent growth +2.5/5.0
- Condition / age +2.5/5.0
- Appreciation +0.0/10.0
$115,000
🖨 Deal sheet 📄 Offer letter ✓ Due diligence
Listing remarks MLS
Cute home in Terre Town! This 3 bedroom 2 bath home has been well maintained, and has many updates throughout! Bonus space for a computer room or man cave or craft room. Partial basement for added storage. Large fenced in yard is perfect for the kids' toys or for entertaining.
Key facts
- Added space
- Large fenced-in yard
- Partial basement
Tags
Property features AI
Exterior
- Parking: No dedicated parking listed
- Utilities: Public water; Municipal sewer connected; Electricity connected; Natural gas connected; Sewer connected; Water connected
- Home design: Single family residence; One level
- Construction: Vinyl siding; Partial foundation
- Exterior features: Chain link fence; Corner lot; Irregular lot
Interior
- Kitchen: Dishwasher; Microwave; Electric oven; Refrigerator
- Bedrooms: Three bedrooms on the main level; Primary bedroom with walk-in closet
- Flooring: Hardwood floors
- Bathrooms: Two full bathrooms on the main level; Primary bathroom with full shower stall
- Heating & cooling: Baseboard heating; Electric heating; Forced air; Central air conditioning
- Interior features: Walk-in closet(s); Hardwood floors; Basement (partial, unfinished)
- Laundry & utility: Laundry located in the basement; Electric water heater
Neighborhood map
What this means for you Summary
Snapshot
- This is a 4-bed/2.0-bath single-family listed at $115k.
Deal economics
- At list price, monthly cash flow is $361 ($4k/yr) — positive.
- The deal already cash-flows at list — no discount required.
- Meets the 1% rule at list price ($1k rent vs $115k).
- Cap rate 10.1% vs local median 4.7% in Terre Haute — top-decile yield for the area; either an underpriced asset or a hidden risk that comps aren't pricing in. Stress-test before assuming the spread holds.
Location & tenants
- Location reads 75/100 on livability (#63 in IN, #4,186 nationally) — a middle-class / working-renter tenant base. Strengths: cost of living A+, housing A+, health & safety A+; Watch: crime F, employment F.
- Vigo County School Corporation (urban): math 32% / reading 37% proficiency, ranked #202 of 301 in IN (top 67%) — families likely to look elsewhere, expect single-tenant / working-renter base with shorter leases.
- Zoned schools: Terre Town Elementary School (math 43% / reading 35%, grade F, #530 of 994 statewide, top 54%, 556 students, 82% FRL); Terre Haute North Vigo High School (math 25% / reading 62%, grade F, #191 of 369 statewide, top 52%, 1,507 students, 51% FRL) — zoned schools average 67% FRL vs 47% district-wide (19 pts higher); higher-poverty schools than district average — tighter screening recommended.
- Market conditions: 81 active listings in the ZIP; 1 comparable units currently listed for rent nearby; 60 units permitted in Vigo County in 2024 (0 in 5+ unit buildings).
Forward outlook
- Local home prices are declining (-3.0%/yr); year-one equity from $795 of loan paydown is wiped out by about $3k of value loss. Plan a longer hold.
- Vigo County population projected to shrink 5% by 2050 — rents likely to lag national; underwrite the cash flow, not the appreciation.
- At projected returns (-3.0% appreciation + 3.0% rent growth), your $32k cash investment doubles in ~9 years — after that, you're playing with house money.
Negotiation context
- Only 7 days on market — expect competitive offers; lowballing is unlikely to land.
- 4 sale attempts since 6y ago with the ask held roughly flat each time — persistent listings suggest the price (not the market) is what's stuck; bring a comps-based counter.
- Current owner paid $80k; 44% above their basis — modest negotiation headroom, anchor on the comps not their cost.
Risks & watch-outs
- Watch-outs: built in 1951 — expect roof / HVAC / electrical / plumbing capex.
Questions for the listing agent
- Built in 1951 — when were the roof, HVAC, electrical panel, plumbing, and water heater last replaced?
- Is there a deadline driving the sale (1031 exchange, divorce, estate, relocation)? That informs how much negotiation room exists.
- Schools are D-rated, which usually means shorter tenancies and higher turnover. Who's the typical renter profile here, and what's been the actual vacancy rate?
- Crime grade is F in this area — have there been break-ins, vandalism, or insurance claims at this property in the last 3 years? What carrier currently insures it and at what premium?
- What's the average days-on-market for RENTAL listings here right now (not sales)? A rising rental-DOM trend means longer vacancies and softer asking-rent achievability than the comps imply.
- What's the recent tenant-quality profile in this submarket — average credit score on applications, eviction rate, late-payment / NSF rate, and stable-employment percentage? A property-management company in the area should have these aggregated.
- How much new for-sale + rental construction is in the pipeline within 1–3 miles? Heavy new supply typically softens prices + rents 12–24 months out; constrained supply supports both.
Investment metrics
- 1% rule
- 1.19% ✓
- Cap rate
- 10.06%
- Cash-on-cash
- 13.46%
- DSCR
- 1.60
- GRM
- 7.0
CMA / ARV
- ARV (median comp)
- $171,246
- List price
- $115,000
- Delta
- -32.85%
- Verdict
- UNDERPRICED
- Comps
- 20 within 1.0 mi
Show comp detail 12 sales within ~0.75 mi
| Address | Dist | Beds/Ba | Sqft | Sold | Price | $/sf | Match |
|---|---|---|---|---|---|---|---|
| 2101 Frisco Ave | 0.26mi | 3/1.5 (-1) | 1,360 (+1%) | 5mo | $166,000 | $122 | 76 |
| 1906 Winslow Ave | 0.39mi | 3/2.0 (-1) | 1,360 (+1%) | 2mo | $234,900 | $173 | 74 |
| 1905 E Haythorne Ave | 0.42mi | 3/2.0 (-1) | 1,348 (-0%) | 1mo | $239,900 | $178 | 74 |
| 2106 Clay Ave | 0.24mi | 3/1.0 (-1) | 1,244 (-8%) | 6mo | $35,000 | $28 | 62 |
| 4523 N 14th st St | 0.75mi | 3/2.0 (-1) | 1,360 (+1%) | 1mo | $238,400 | $175 | 58 |
| 4531 N 14th St St | 0.75mi | 3/2.0 (-1) | 1,344 (-1%) | 6mo | $243,000 | $181 | 54 |
| 4308 N 14th 1/2 St | 0.71mi | 3/2.0 (-1) | 1,288 (-5%) | 1mo | $205,000 | $159 | 54 |
| 1955 Winslow Ave | 0.29mi | 3/1.5 (-1) | 1,160 (-14%) | 4mo | $170,000 | $147 | 53 |
| 4527 N 14th st St | 0.75mi | 3/2.0 (-1) | 1,416 (+5%) | 3mo | $240,000 | $169 | 50 |
| 4519 N 14th St | 0.75mi | 3/2.0 (-1) | 1,300 (-4%) | 7mo | $239,900 | $185 | 48 |
| 4518 N 16th St | 0.59mi | 3/2.0 (-1) | 1,152 (-15%) | 5mo | $162,500 | $141 | 38 |
| 4535 N 14th st St | 0.75mi | 3/2.0 (-1) | 1,540 (+14%) | 4mo | $249,900 | $162 | 34 |
Match score weights: distance 35% · size 25% · config 20% · recency 20%. Top-matched comps best support the ARV.
Projected returns pro-forma
-3.0% appreciation · 3.0% rent growth · sell at horizon
- IRR
- 3.5%
- Equity multiple
- 1.14×
- Total profit
- $4,349
- Equity at exit
- $17,147
- IRR
- 13.0%
- Equity multiple
- 2.03×
- Total profit
- $33,315
- Equity at exit
- $9,943
Cash invested: $32,200 (down + closing). Projections, not guarantees.
Landlord ↔ Tenant lean methodology
- Overall (STATE)
- 90 Strongly Landlord-Friendly
- State Indiana
- 90 Strongly Landlord-Friendly · R+11
- County
- — inherits STATE
- City
- — inherits STATE
ZIP-level market 47805
- Home prices YoY
- -20.3%
- Active inventory
- 81
- Price-to-rent
- 7.0×
Monthly cashflow live
- Estimated rent
- $1,371 medium interval (Pro) →
- Mortgage (P&I)
- −$603
- Tax from tax record
- −$70 /mo · $846/yr
- Insurance
- −$48
- HOA
- −$0
- Vacancy / Maint / Mgmt
- −$288
- Net cashflow
- $361
Break-even live
UW: 25.0% down · 7.5% · 30yr · 1.5% tax · 5.0% vac · 8.0% maint · 8.0% mgmt
Financing live
Cash to close
- Down payment
- $28,750
- Closing costs
- $3,450
- Reserves months
- —
- Total cash needed
- —
Loan-product check · same deal, 3 products live
Conventional
25% down · 7.5% · 30yr
- Down + closing
- —
- Monthly P&I
- —
- Monthly cashflow
- —
- DSCR
- —
- Eligible?
- —
Personal DTI + credit; lowest rate.
DSCR
20% down · 8.5% · 30yr
- Down + closing
- —
- Monthly P&I
- —
- Monthly cashflow
- —
- DSCR
- —
- Eligible?
- —
No personal income docs; deal must DSCR.
Hard money
10% down · 12.0% · 12mo
- Down + closing
- —
- Monthly P&I
- —
- Monthly cashflow
- —
- DSCR
- —
- Eligible?
- —
Short-term bridge; refi at stabilization.
Rent comps 1 comps
| Address | Beds | Baths | Sqft | Rent | $/sqft | DOM | Units | Dist |
|---|---|---|---|---|---|---|---|---|
| 3100 N 14th St Terre Haute, IN | 3.0 | 1.5 | 990 | $1,450 | $1.46 | 43d | 1 | 1.20mi |
Listing history 8 events
-
2026-05-08status Pending 373-char remark
-
2026-04-23$115,000 Active 373-char remark
-
2021-07-19soldstatus $80,000 277-char remark
Show marketing remark (277 chars)
Cute home in Terre Town! This 3 bedroom 2 bath home has been well maintained, and has many updates throughout! Bonus space for a computer room or man cave or craft room. Partial basement for added storage. Large fenced in yard is perfect for the kids' toys or for entertaining.
-
2021-07-19soldstatus $80,000
Show marketing remark (277 chars)
Cute home in Terre Town! This 3 bedroom 2 bath home has been well maintained, and has many updates throughout! Bonus space for a computer room or man cave or craft room. Partial basement for added storage. Large fenced in yard is perfect for the kids' toys or for entertaining.
-
2021-05-31$89,900
Show marketing remark (277 chars)
Cute home in Terre Town! This 3 bedroom 2 bath home has been well maintained, and has many updates throughout! Bonus space for a computer room or man cave or craft room. Partial basement for added storage. Large fenced in yard is perfect for the kids' toys or for entertaining.
-
2021-05-31$89,900 277-char remark
Show marketing remark (277 chars)
Cute home in Terre Town! This 3 bedroom 2 bath home has been well maintained, and has many updates throughout! Bonus space for a computer room or man cave or craft room. Partial basement for added storage. Large fenced in yard is perfect for the kids' toys or for entertaining.
-
2020-12-03historical
-
2020-08-19$75,000
ⓘ Source: listings_history table (triggers on properties + properties_extension) + one-shot
backfill from property_details.listing_events for pre-trigger history.
Tax reassessment forecast IN · Partial reset (capped growth)
- Current annual tax
- $846 · $70/mo
- Projected year-2 tax
- $912 · $76/mo
- Expected delta
- +$66/yr (+$5/mo · 7.8%)
ⓘ Screening estimate from a state-policy table — verify with the county assessor before closing.
Climate risk First Street
- Flood 3/10 Moderate FEMA zone X (unshaded) · 20% chance over 30 yrs
- Wildfire 1/10 Low
- Heat 4/10 Moderate 7 d/yr ≥105°F today · 19 d/yr by 30 yrs out
- Wind 2/10 Low 100% chance of damaging wind over 30 yrs
- Air quality 3/10 Moderate 3 unhealthy d/yr today · 4 by 30 yrs out
Nearby sold comps map
Loading sold comps map…
Walkable amenities ~0.75 mi
Loading nearby amenities…
Taxation est. · year 1
- Rental income
- $16,446
- − Mortgage interest
- −$6,442
- − Property taxes
- −$846
- − Insurance
- −$575
- − Repairs & maintenance
- −$1,316
- − Management
- −$1,316
- − Depreciation
- −$3,345
- Taxable income
- $2,607
- Est. tax owed @ 24.0%
- −$626
- After-tax cash flow
- $3,709/yr
For passive investors: Depreciation is non-cash, so a rental often shows a tax loss while cash-flowing — sheltering income. Rental losses are passive: they offset passive income freely, and up to $25,000/yr can offset ordinary (W-2) income if you actively participate and your MAGI is under $100k (phasing out to $0 by $150k); unused losses carry forward. On sale, claimed depreciation is recaptured at up to 25%, and gains may owe capital-gains tax (a 1031 exchange can defer both). Figures are a year-1 estimate at your 24.0% rate — not tax advice; consult a CPA.
Schools (NCES district)
- District
- Vigo County School Corporation
- NCES district ID
- 1812090
- Math proficiency
- 32% ▼ -10.00%
- Reading proficiency
- 37% ▼ -8.00%
- Median HH income
- $40,100
- Composite
- 28.97/100
- National rank
- #6625
- State rank
- #202 of 301 in IN
Livability — Terre Haute
- Score
- 75/100
- State rank
- #63
- US rank
- #4186
Category grades
Schools grade is shown separately in the Schools card above.
Census & demographics
- Census place
- Terre Haute, IN
- County
- Vigo County · 91,193 people
- City population
- 91,193
- Metro
- Terre Haute, IN
- Population (ZIP)
- 12,619
- Household income
- $72,411
- Rent vs Own
- Severe rent burden
- 192.0
Population outlook (Vigo County) Hauer SSP2
- Today (2025)
- 106,366 people
- By 2030
- 105,674 · -0.7%
- By 2040
- 103,731 · -2.5%
- By 2050
- 101,200 · -4.9%
- By 2075
- 95,674 · -10.1%
- By 2100
- 85,910 · -19.2%
Race, ethnicity, and origin ACS 2023
- Neighborhood character
- Predominantly White (92%)
- Race & ethnicity
- White 92% Two or more races 5% Hispanic / Latino 2% Black 1%
- Common ancestry
- Italian 3% Slovak 2% Lithuanian 2%
- Foreign-born
- 1% · South Korea
- Languages at home
- 98% English-only · Spanish 1%
Political lean MEDSL · Vigo
- 2024 margin
- R (+18.1) · D 40.0% · R 58.1% · Other 2.0%
- 2008→2024 swing
- -33.9pp toward R · 2008: 15.8pp · 2024: -18.1pp
- All cycles
- 2024: R+18.1 2020: R+14.7 2016: R+15.2 2012: D+0.8 2008: D+15.8
Not yet ingested
- Civics
- —
Market trends
- HPI YoY
- ▼ -48.03%
- Current HPI
- 188.402
- Rent YoY
- —
- Metro
- Terre Haute, IN
- State GDP YoY
- ▲ 2.90%
- F500 in state
- 18
Industry mix (Fortune 500 HQ in IN)
| Industry | F500 HQs | Revenue |
|---|---|---|
| Industrial Machinery | 2 | $37B |
|
||
| Healthcare | 1 | $177B |
|
||
| Pharmaceuticals | 1 | $45B |
|
||
| Metals / Steel | 1 | $18B |
|
||
| Agriculture | 1 | $17B |
|
||
| Packaging | 1 | $12B |
|
||
Price history
+53.3% since first listed8 events — show timeline
- 2026-05-08 Pending — MIBOR as Distributed by MLS Grid
- 2026-04-23 Listed $115,000 MIBOR as Distributed by MLS Grid
- 2021-07-19 Sold (MLS) $80,000 MIBOR as Distributed by MLS Grid
- 2021-07-19 Sold (MLS) $80,000 THAAR
- 2021-05-31 Listed $89,900 MIBOR as Distributed by MLS Grid
- 2021-05-31 Listed $89,900 THAAR
- 2020-12-03 Listing Removed — MIBOR as Distributed by MLS Grid
- 2020-08-19 Listed $75,000 MIBOR as Distributed by MLS Grid
Property tax history
+5.5%/yrLatest (2024): $846 · +3.0% YoY. Source: county tax records.
Cash-flow waterfall
monthlySold comps — $/sqft
last 12 mo · ≤1 miLoading sold comps…