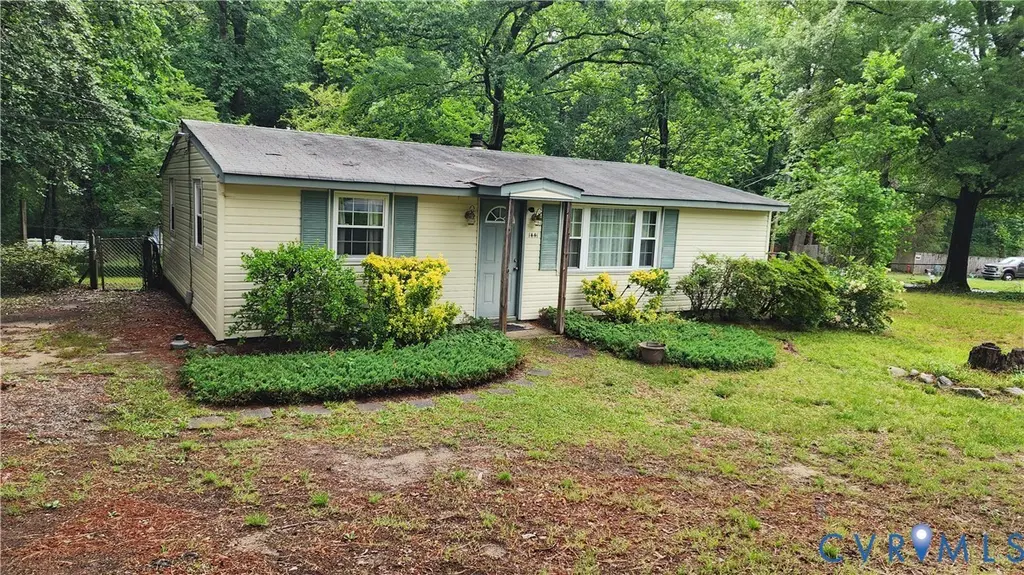
1441 Stansbury Ave · Richmond, VA
Flood risk 1/10 · Minimal
- FEMA flood zone
- X (unshaded)
- Chance of flooding over 30 yrs
- 0.0%
- Est. flood insurance / yr
- $507 – $1,088
Fire risk 1/10 · Minimal
- Est. fire insurance / yr
- $666 – $1,236
Heat risk 7/10 · Major
- Hot days now (above 105°F)
- 7 days/yr
- Hot days in 30 yrs
- 16 days/yr
Wind risk 6/10 · Moderate
- Chance of severe wind over 30 yrs
- 27.0%
Air-quality risk 2/10 · Minimal
- Unhealthy air days now
- 1 days/yr
- Unhealthy air days in 30 yrs
- 1 days/yr
Risk factors via First Street. Map © Google.
Why this score? — see what drove the C- grade
The composite is a weighted blend of 9 inputs, each scored 0–100. Each bar is that input's sub-score; the figure is the points it added to the 100-point composite (weight × sub-score).
- ARV discount +15.0/15.0
- Cash flow +14.9/30.0
- DSCR +4.5/10.0
- Livability +4.2/5.0
- 1% rule +3.4/10.0
- Schools +3.3/10.0
- Rent growth +2.7/5.0
- Condition / age +2.5/5.0
- Appreciation +0.0/10.0
$175,000
🖨 Deal sheet (PDF) 📄 Offer letter ✓ Due diligence
Listing remarks
Home needs some updating. Roof is approximately 10 years old. HVAC is about 3 years old. Has Vinyl Thermal Windows. Water Heater is about 7 years old. House being sold in "As Is" Condition.
Key facts
- 0.28 acre lot
- Built 1956
- Listed 6 days
Tags
Property features AI
Exterior
- Parking: Oversized parking
- Utilities: Public water; Public sewer
- Home design: Single-story home; Resale property; R-3 zoning
- Construction: Frame and mixed construction with vinyl siding; Composition roof; Slab foundation; Built as actual year (year built details: Actual)
- Exterior features: Chain link fenced yard; Fenced
Interior
- Kitchen: Electric cooking
- Bedrooms: Two bedrooms on the first floor
- Flooring: Concrete; Vinyl
- Bathrooms: One full bathroom with tub and shower on the first floor
- Heating & cooling: Heat pump and electric heating; Central air conditioning
- Interior features: Thermal windows; Insulated doors; Concrete and vinyl flooring
- Laundry & utility: Electric water heater
Neighborhood map
What this means for you Summary
Snapshot
- This is a 2-bed/1.0-bath single-family listed at $175k.
Deal economics
- At list price, monthly cash flow is $50 ($603/yr) — positive.
- The deal already cash-flows at list — no discount required.
- To meet the 1% rule (rent ≥ 1% of price), the offer needs to be $146k (16.3% below list).
- Recommended offer: $146k (16.3% below list) — sets the bar for 1% rule.
- Cap rate 6.6% vs local median 3.2% in Richmond — top-decile yield for the area; either an underpriced asset or a hidden risk that comps aren't pricing in. Stress-test before assuming the spread holds.
Location & tenants
- Location reads 84/100 on livability (#33 in VA, #793 nationally) — a professional / high-income tenant draw. Strengths: amenities A+, commute A+, health & safety A+; Watch: crime D-.
- Richmond City Public School District (urban): math 32% / reading 47% proficiency, ranked #123 of 131 in VA (top 94%) — families likely to look elsewhere, expect single-tenant / working-renter base with shorter leases; 74% free/reduced lunch — lower-income household profile, screen leases tightly.
- Zoned schools: G.H. Reid Elementary (math 12% / reading 17%, grade F, #1,104 of 1,108 statewide, top 100%, 637 students, 99% FRL); River City Middle (math 14% / reading 31%, grade F, #337 of 342 statewide, top 99%, 1,180 students, 98% FRL); Huguenot High (math 37% / reading 57%, grade D-, #305 of 319 statewide, top 97%, 1,551 students, 88% FRL) — zoned schools average 95% FRL vs 74% district-wide (21 pts higher); higher-poverty schools than district average — tighter screening recommended.
- Market conditions: Rents flat; 167 active listings in the ZIP; 13 comparable units currently listed for rent nearby; rentals lingering (median 46d on market — plan ~5-8 weeks vacancy on turnover, expect pricing pressure); 54% of comp listings sitting > 30 days — soft ceiling on asking rent; 2,540 units permitted in Richmond city in 2024 (2,077 in 5+ unit buildings).
Forward outlook
- Local home prices are declining (-3.0%/yr); year-one equity from $1k of loan paydown is wiped out by about $5k of value loss. Plan a longer hold.
- Richmond County population projected at +40% by 2050 — long-run rental-demand tailwind backs the buy-and-hold thesis.
Negotiation context
- Only 6 days on market — expect competitive offers; lowballing is unlikely to land.
- Current owner paid $10k; list at $175k implies a 1723% gain — meaningful room to come down on a strong offer.
Risks & watch-outs
- Watch-outs: built in 1956 — expect roof / HVAC / electrical / plumbing capex.
- Climate carrying-cost: major wind risk, 27% chance of damaging wind over 30y; extreme-heat days projected 7→16/yr by 2055 (HVAC capex compounding) — expect insurance premiums to compound above CPI over the hold.
Questions for the listing agent
- Built in 1956 — when were the roof, HVAC, electrical panel, plumbing, and water heater last replaced?
- Is there a deadline driving the sale (1031 exchange, divorce, estate, relocation)? That informs how much negotiation room exists.
- Schools are A-rated — typically a magnet for longer-tenancy family renters. What's the average tenant stay here, and is there a school-zone premium baked into asking?
- Crime grade is D in this area — have there been break-ins, vandalism, or insurance claims at this property in the last 3 years? What carrier currently insures it and at what premium?
- What's the average days-on-market for RENTAL listings here right now (not sales)? A rising rental-DOM trend means longer vacancies and softer asking-rent achievability than the comps imply.
- What's the recent tenant-quality profile in this submarket — average credit score on applications, eviction rate, late-payment / NSF rate, and stable-employment percentage? A property-management company in the area should have these aggregated.
- How much new for-sale + rental construction is in the pipeline within 1–3 miles? Heavy new supply typically softens prices + rents 12–24 months out; constrained supply supports both.
Investment metrics
- 1% rule
- 0.84% ✗
- Cap rate
- 6.64%
- Cash-on-cash
- 1.23%
- DSCR
- 1.05
- GRM
- 10.0
CMA / ARV
- ARV (on-the-fly)
- $223,776
- Comps found
- 10
Show comp detail 10 sales within ~0.75 mi
| Address | Dist | Beds/Ba | Sqft | Sold | Price | $/sf | Match |
|---|---|---|---|---|---|---|---|
| 1406 Bramwell Rd | 0.15mi | 3/1.0 (+1) | 864 (0%) | 0mo | $185,000 | $214 | 88 |
| 1401 Bramwell Rd | 0.14mi | 2/1.5 | 892 (+3%) | 2mo | $237,200 | $266 | 85 |
| 6001 Worthington Rd | 0.22mi | 3/1.0 (+1) | 884 (+2%) | 12mo | $251,000 | $284 | 71 |
| 6118 Coniston Ave | 0.21mi | 3/1.0 (+1) | 864 (0%) | 21mo | $265,000 | $307 | 67 |
| 1655 Tennyson Ave | 0.23mi | 2/1.0 | 900 (+4%) | 23mo | $235,000 | $261 | 63 |
| 5946 Swanson Rd | 0.35mi | 3/1.0 (+1) | 925 (+7%) | 10mo | $240,000 | $259 | 59 |
| 5912 Sawston Rd | 0.27mi | 3/1.5 (+1) | 960 (+11%) | 12mo | $209,950 | $219 | 52 |
| 1037 Barlen Dr | 0.41mi | 3/1.0 (+1) | 984 (+14%) | 12mo | $224,000 | $228 | 43 |
| 6358 Elkhardt Ln | 0.66mi | 2/2.0 | 834 (-4%) | 22mo | $120,000 | $144 | 41 |
| 943 Barlen Dr | 0.57mi | 3/1.0 (+1) | 984 (+14%) | 6mo | $229,000 | $233 | 41 |
Match score weights: distance 35% · size 25% · config 20% · recency 20%. Top-matched comps best support the ARV.
Projected returns pro-forma
-3.0% appreciation · 0.63% rent growth · sell at horizon
- IRR
- -16.8%
- Equity multiple
- 0.42×
- Total profit
- $-28,608
- Equity at exit
- $26,093
- IRR
- -13.3%
- Equity multiple
- 0.30×
- Total profit
- $-34,304
- Equity at exit
- $15,131
Cash invested: $49,000 (down + closing). Projections, not guarantees.
Landlord ↔ Tenant lean methodology
- Overall (STATE)
- 55 Moderately Landlord-Leaning
- State Virginia
- 55 Moderately Landlord-Leaning · D+2
- County
- — inherits STATE
- City
- — inherits STATE
ZIP-level market 23225
- Rents YoY
- 0.6%
- Active inventory
- 167
- Price-to-rent
- 10.0×
Monthly cashflow live
- Estimated rent
- $1,464 high interval (Pro) →
- Mortgage (P&I)
- −$918
- Tax from tax record
- −$116 /mo · $1,392/yr
- Insurance
- −$73
- HOA
- −$0
- Vacancy / Maint / Mgmt
- −$308
- Net cashflow
- $50
Break-even live
Sensitivity live
| Price | -10% $149 | -5% $100 | +0% $50 | +5% $1 | +10% $-49 |
|---|---|---|---|---|---|
| Rent | -10% $-65 | -5% $-8 | +0% $50 | +5% $108 | +10% $166 |
| Rate | -1.0pp $138 | -0.5pp $95 | base $50 | +0.5pp $5 | +1.0pp $-41 |
UW: 25.0% down · 7.5% · 30yr · 1.5% tax · 5.0% vac · 8.0% maint · 8.0% mgmt
Financing live
Cash to close
- Down payment
- $43,750
- Closing costs
- $5,250
- Reserves months
- —
- Total cash needed
- —
Loan-product check · same deal, 3 products live
Conventional
25% down · 7.5% · 30yr
- Down + closing
- —
- Monthly P&I
- —
- Monthly cashflow
- —
- DSCR
- —
- Eligible?
- —
Personal DTI + credit; lowest rate.
DSCR
20% down · 8.5% · 30yr
- Down + closing
- —
- Monthly P&I
- —
- Monthly cashflow
- —
- DSCR
- —
- Eligible?
- —
No personal income docs; deal must DSCR.
Hard money
10% down · 12.0% · 12mo
- Down + closing
- —
- Monthly P&I
- —
- Monthly cashflow
- —
- DSCR
- —
- Eligible?
- —
Short-term bridge; refi at stabilization.
Rent comps 13 comps
| Address | Beds | Baths | Sqft | Rent | $/sqft | DOM | Units | Dist |
|---|---|---|---|---|---|---|---|---|
| 1018 Barlen Dr Richmond, VA | 3.0 | 1.0 | 935 | $1,700 | $1.82 | 45d | 1 | 0.43mi |
| 6540 Greenbank Rd Richmond, VA | 1.0–3.0 | 1.0–1.5 | 887 | $1,390 | $1.57 | 3d | 59 | 0.53mi |
| 6428 Elkhardt Rd Unit D Richmond, VA | 1.0 | 1.0 | 610 | $940 | $1.54 | 45d | 1 | 0.55mi |
| 2336 Sara Ln Richmond, VA | 3.0 | 1.0 | 1120 | $1,695 | $1.51 | 45d | 1 | 0.58mi |
| 6434 Elkhardt Rd Unit P Richmond, VA | 1.0 | 1.0 | 610 | $940 | $1.54 | 45d | 1 | 0.59mi |
| 6434 Elkhardt Rd Unit K Richmond, VA | 1.0 | 1.0 | 610 | $940 | $1.54 | 25d | 1 | 0.60mi |
| 1501 Ivymount Rd Richmond, VA | 3.0 | 1.5 | 1084 | $1,750 | $1.61 | 45d | 1 | 0.60mi |
| 5616 Kendall Rd Richmond, VA | 3.0 | 1.0 | 1054 | $1,575 | $1.49 | 23d | 1 | 0.91mi |
| 6925 Starview Ct Richmond, VA | 1.0–2.0 | 1.5 | 953 | $1,642 | $1.72 | 4d | 4 | 0.98mi |
| 1200 Southwood Pkwy Richmond, VA | 1.0–2.0 | 1.0–2.0 | 916 | $1,605 | $1.75 | 45d | 11 | 1.23mi |
| 311 Karl Linn Dr North Chesterfield, VA | 1.0–3.0 | 1.0–3.0 | 1271 | $2,616 | $2.06 | 3d | 21 | 1.35mi |
| 4904 Warwick Rd Unit 4705 Richmond, VA | 2.0 | 1.5 | 900 | $1,400 | $1.56 | 45d | 1 | 1.36mi |
| 3124 Snead Ct Richmond, VA | 2.0 | 1.5 | 1000 | $1,349 | $1.35 | 25d | 3 | 1.43mi |
Listing history 5 events
-
2026-06-02statusdays on market $175,000 Pending 6 DOM
-
2026-06-01days on market $175,000 Active 5 DOM
-
2026-05-31days on market $175,000 Active 4 DOM
-
2026-05-25$175,000 Active
-
1964-07-20soldstatus $9,600
ⓘ Source: listings_history table (triggers on properties + properties_extension) + one-shot
backfill from property_details.listing_events for pre-trigger history.
Tax reassessment forecast VA · Resets to sale price
- Current annual tax
- $1,392 · $116/mo
- Projected year-2 tax
- $1,435 · $120/mo
- Expected delta
- +$43/yr (+$4/mo · 3.1%)
ⓘ Screening estimate from a state-policy table — verify with the county assessor before closing.
Climate risk First Street
- Flood 1/10 Low FEMA zone X (unshaded) · 0% chance over 30 yrs
- Wildfire 1/10 Low
- Heat 7/10 Severe 7 d/yr ≥105°F today · 16 d/yr by 30 yrs out
- Wind 6/10 Major 27% chance of damaging wind over 30 yrs
- Air quality 2/10 Low 1 unhealthy d/yr today · 1 by 30 yrs out
Nearby sold comps map
Loading sold comps map…
Walkable amenities ~0.75 mi
Loading nearby amenities…
Taxation est. · year 1
- Rental income
- $17,573
- − Mortgage interest
- −$9,803
- − Property taxes
- −$1,392
- − Insurance
- −$875
- − Repairs & maintenance
- −$1,406
- − Management
- −$1,406
- − Depreciation
- −$5,091
- Taxable loss
- −$2,399
- Est. tax savings @ 24.0%
- +$576
- After-tax cash flow
- $1,179/yr
For passive investors: Depreciation is non-cash, so a rental often shows a tax loss while cash-flowing — sheltering income. Rental losses are passive: they offset passive income freely, and up to $25,000/yr can offset ordinary (W-2) income if you actively participate and your MAGI is under $100k (phasing out to $0 by $150k); unused losses carry forward. On sale, claimed depreciation is recaptured at up to 25%, and gains may owe capital-gains tax (a 1031 exchange can defer both). Figures are a year-1 estimate at your 24.0% rate — not tax advice; consult a CPA.
Schools (NCES district)
- District
- Richmond City Public School District
- NCES district ID
- 5103240
- Math proficiency
- 32% ▼ -24.00%
- Reading proficiency
- 47% ▼ -9.00%
- Median HH income
- $40,276
- Composite
- 33.09/100
- National rank
- #5564
- State rank
- #123 of 131 in VA
Livability — Richmond
- Score
- 84/100
- State rank
- #33
- US rank
- #793
Category grades
Schools grade is shown separately in the Schools card above.
Census & demographics
- Census place
- Richmond, VA
- County
- Richmond City · 178,280 people
- City population
- 287,109
- Metro
- Richmond, VA
- Population (ZIP)
- 42,771
- Household income
- $62,949
- Rent vs Own
- Severe rent burden
- 2516.0
Population outlook (Richmond County) Hauer SSP2
- Today (2025)
- 262,263 people
- By 2030
- 284,503 · +8.5%
- By 2040
- 327,353 · +24.8%
- By 2050
- 367,946 · +40.3%
- By 2075
- 449,560 · +71.4%
- By 2100
- 500,301 · +90.8%
Race, ethnicity, and origin ACS 2023
- Neighborhood character
- Diverse neighborhood (Simpson 0.66)
- Race & ethnicity
- Black 42% White 38% Hispanic / Latino 14% Two or more races 7% Asian 1%
- Hispanic origin (detail)
- Mexican 2% Puerto Rican 1% Dominican 1%
- Common ancestry
- Slovak 2% Lithuanian 2% Serbian 1%
- Foreign-born
- 9% · Canada
- Languages at home
- 86% English-only · Spanish 11% Other Indo-European 1% Other Asian/Pacific 1%
Political lean MEDSL · Richmond
- 2024 margin
- Solid D (+66.3) · D 82.0% · R 15.8% · Other 2.2%
- 2008→2024 swing
- +7.2pp toward D · 2008: 59.1pp · 2024: 66.3pp
- All cycles
- 2024: D+66.3 2020: D+68.0 2016: D+63.8 2012: D+55.7 2008: D+59.1
Not yet ingested
- Civics
- —
Market trends
- HPI YoY
- ▼ -392.89%
- Current HPI
- 339.408
- Rent YoY
- ▲ 0.63%
- Metro
- Richmond, VA
- State GDP YoY
- ▲ 2.40%
- F500 in state
- 50
Industry mix (Fortune 500 HQ in VA)
| Industry | F500 HQs | Revenue |
|---|---|---|
| Aerospace / Defense | 4 | $236B |
|
||
| Technology / Defense | 3 | $32B |
|
||
| Financial Services | 2 | $176B |
|
||
| Utilities | 2 | $27B |
|
||
| Insurance | 2 | $25B |
|
||
| Technology | 2 | $15B |
|
||
Price history
+1722.9% since first listed2 events — show timeline
- 2026-05-25 Listed $175,000 CVRMLS
- 1964-07-20 Sold (Public Records) $9,600 Public Records
Property tax history
+11.3%/yrLatest (2022): $1,392 · +70.6% YoY. Source: county tax records.
Cash-flow waterfall
monthlySold comps — $/sqft
last 12 mo · ≤1 miLoading sold comps…