3721 Longbranch Dr · Crandall, TX
Flood risk No data
- FEMA flood zone
- —
- Chance of flooding over 30 yrs
- —
- Est. flood insurance / yr
- —
Fire risk No data
- Est. fire insurance / yr
- —
Heat risk No data
- Hot days now (above threshold)
- —
- Hot days in 30 yrs
- —
Wind risk No data
- Chance of severe wind over 30 yrs
- —
Air-quality risk No data
- Unhealthy air days now
- —
- Unhealthy air days in 30 yrs
- —
Risk factors via First Street. Map © Google.
Why this score? — see what drove the D+ grade
The composite is a weighted blend of 9 inputs, each scored 0–100. Each bar is that input's sub-score; the figure is the points it added to the 100-point composite (weight × sub-score).
- Cash flow +18.9/30.0
- ARV discount +6.1/15.0
- DSCR +6.0/10.0
- 1% rule +4.4/10.0
- Schools +3.6/10.0
- Livability +3.4/5.0
- Rent growth +2.5/5.0
- Condition / age +2.5/5.0
- Appreciation +0.0/10.0
$232,499
🖨 Deal sheet (PDF) 📄 Offer letter ✓ Due diligence
Listing remarks MLS
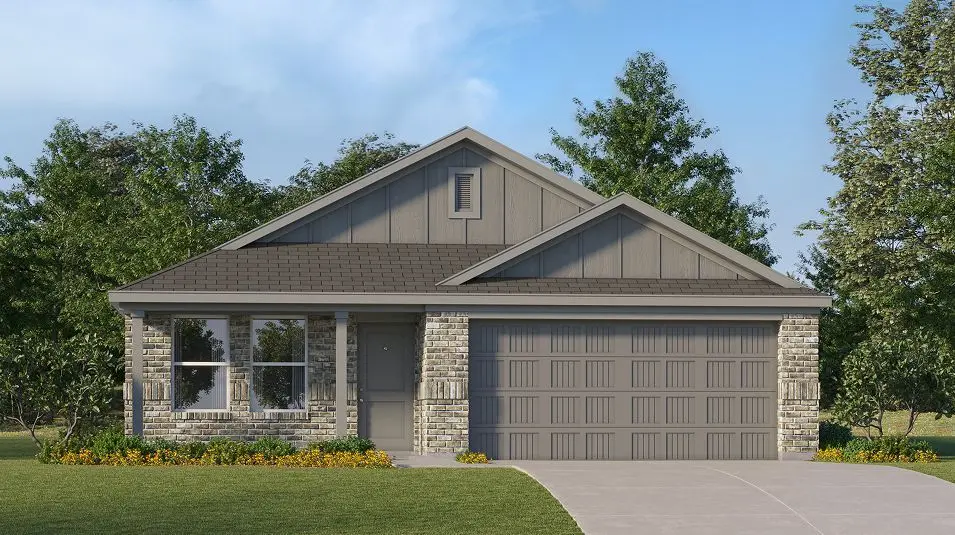
This new home is conveniently laid out on a single floor for maximum comfort and convenience. At its heart stands an open-concept layout connecting a spacious family room, a multi-functional kitchen and lovely dining area. The owner's suite is situated in a private corner and comes complete with an adjoining bathroom, while the two secondary bedrooms are located near the foyer.
Key facts
- 5,663 sq ft lot
- 2 garage spots
- Built 2025
Property features AI
Finance
- Other: Builder special listing condition; Possession at closing/funding
- Financial info: Accepts Cash, Conventional, FHA, USDA, and VA loans; No second mortgage
- HOA & community: Mandatory association; Annual association fee of 750; Association includes full use of facilities, grounds maintenance, and management fees; HOA managed by Essex Management
Exterior
- Parking: Attached 2-car garage (garage faces front); 2 covered parking spaces
- Security: Carbon monoxide detector(s); Fire alarm; Smoke detector(s)
- Utilities: City water; City sewer; Concrete (drive/approach); Municipal utility district; Sidewalk
- Home design: Single family residence (attached); One story; New construction - incomplete (year built 2025)
- Construction: Brick and siding exterior; Composition roof; Slab foundation; Built in 2025 (new construction - incomplete)
- Exterior features: Wood fencing; Few trees; Interior lot; Landscaped yard; Sprinkler system; Curbs and sidewalks
Interior
- Kitchen: Gas oven and gas range; Microwave; Dishwasher; Vented exhaust fan; Kitchen island; Natural stone/granite counters; Built-in cabinets; Walk-in pantry
- Bedrooms: 3 bedrooms (all on the main level); Primary bedroom with dual sinks, linen closet, and walk-in closet
- Flooring: Carpet; Other
- Bathrooms: 2 full bathrooms
- Heating & cooling: Central heating (electric); Central air (electric); ENERGY STAR qualified equipment; Thermostat listed as energy-efficient feature
- Interior features: Built-in features; Cable TV available; Decorative lighting; High-speed internet available; Kitchen island; Open floorplan; Pantry; Walk-in closet(s); Room count: 6; One level
- Laundry & utility: Energy-efficient water heater listed under green features
Neighborhood map
What this means for you Summary
Snapshot
- This is a 3-bed/2.0-bath land listed at $232k.
Deal economics
- At list price, monthly cash flow is $240 ($3k/yr) — positive.
- The deal already cash-flows at list — no discount required.
- To meet the 1% rule (rent ≥ 1% of price), the offer needs to be $219k (6.0% below list).
- Recommended offer: $219k (6.0% below list) — sets the bar for 1% rule.
- Cap rate 7.5% vs local median 5.3% in Crandall — top-decile yield for the area; either an underpriced asset or a hidden risk that comps aren't pricing in. Stress-test before assuming the spread holds.
Location & tenants
- Location reads 68/100 on livability (#507 in TX) — a middle-class / working-renter tenant base. Strengths: employment A+, cost of living A+, housing A+; Watch: crime F, amenities F, commute F.
- Crandall ISD (rural): math 36% / reading 42% proficiency, ranked #351 of 826 in TX (top 42%) — families likely to look elsewhere, expect single-tenant / working-renter base with shorter leases.
- Zoned schools: Noble Reed (math 32% / reading 36%, grade F, #2,149 of 4,322 statewide, top 50%, 595 students, 74% FRL); Crandall Middle (math 38% / reading 42%, grade F, #646 of 1,662 statewide, top 40%, 983 students, 60% FRL); Crandall H S (math 33% / reading 53%, grade F, #713 of 1,632 statewide, top 44%, 1,707 students, 56% FRL) — zoned schools average 63% FRL vs 41% district-wide (22 pts higher); higher-poverty schools than district average — tighter screening recommended.
- Market conditions: 802 active listings in the ZIP; 6 comparable units currently listed for rent nearby; rentals lingering (median 46d on market — plan ~5-8 weeks vacancy on turnover, expect pricing pressure); 50% of comp listings sitting > 30 days — soft ceiling on asking rent; solid renter incomes; 1,747 units permitted in Kaufman County in 2024 (180 in 5+ unit buildings).
Forward outlook
- Local home prices are declining (-3.0%/yr); year-one equity from $2k of loan paydown is wiped out by about $7k of value loss. Plan a longer hold.
- Kaufman County population projected at +43% by 2050 — long-run rental-demand tailwind backs the buy-and-hold thesis.
Negotiation context
- It's been on market 17 days — a 2% lower offer ($229k) is reasonable based on typical stale-listing flexibility.
- 2 sale attempts with the ask held roughly flat each time — persistent listings suggest the price (not the market) is what's stuck; bring a comps-based counter.
Questions for the listing agent
- What does the HOA fee cover, when was the last increase, and are there any pending special assessments or reserve-fund shortfalls?
- Is there a deadline driving the sale (1031 exchange, divorce, estate, relocation)? That informs how much negotiation room exists.
- Schools are B-rated — typically a magnet for longer-tenancy family renters. What's the average tenant stay here, and is there a school-zone premium baked into asking?
- Crime grade is F in this area — have there been break-ins, vandalism, or insurance claims at this property in the last 3 years? What carrier currently insures it and at what premium?
- The area grade is low — what's the realistic commute time and amenity access for the typical tenant pool here? Any planned neighborhood developments (good or bad) we should know about?
- What's the average days-on-market for RENTAL listings here right now (not sales)? A rising rental-DOM trend means longer vacancies and softer asking-rent achievability than the comps imply.
- What's the recent tenant-quality profile in this submarket — average credit score on applications, eviction rate, late-payment / NSF rate, and stable-employment percentage? A property-management company in the area should have these aggregated.
- How much new for-sale + rental construction is in the pipeline within 1–3 miles? Heavy new supply typically softens prices + rents 12–24 months out; constrained supply supports both.
Investment metrics
- 1% rule
- 0.94% ✗
- Cap rate
- 7.53%
- Cash-on-cash
- 4.42%
- DSCR
- 1.20
- GRM
- 8.9
CMA / ARV
- ARV (median comp)
- $225,439
- List price
- $232,499
- Delta
- 3.13%
- Verdict
- FAIR
- Comps
- 20 within 1.0 mi
Projected returns pro-forma
-3.0% appreciation · 3.0% rent growth · sell at horizon
- IRR
- -9.4%
- Equity multiple
- 0.66×
- Total profit
- $-22,440
- Equity at exit
- $34,666
- IRR
- -0.0%
- Equity multiple
- 1.00×
- Total profit
- $-34
- Equity at exit
- $20,102
Cash invested: $65,100 (down + closing). Projections, not guarantees.
Landlord ↔ Tenant lean methodology
- Overall (STATE)
- 87 Strongly Landlord-Friendly
- State Texas
- 87 Strongly Landlord-Friendly · R+5
- County
- — inherits STATE
- City
- — inherits STATE
ZIP-level market 75114
- Home prices YoY
- -26.7%
- Active inventory
- 802
- Price-to-rent
- 8.9×
Monthly cashflow live
- Estimated rent
- $2,187 high interval (Pro) →
- Mortgage (P&I)
- −$1,219
- Tax from tax record
- −$108 /mo · $1,301/yr
- Insurance
- −$97
- HOA
- −$63
- Vacancy / Maint / Mgmt
- −$459
- Net cashflow
- $240
Break-even live
Sensitivity live
| Price | -10% $371 | -5% $306 | +0% $240 | +5% $174 | +10% $108 |
|---|---|---|---|---|---|
| Rent | -10% $67 | -5% $153 | +0% $240 | +5% $326 | +10% $413 |
| Rate | -1.0pp $357 | -0.5pp $299 | base $240 | +0.5pp $180 | +1.0pp $118 |
UW: 25.0% down · 7.5% · 30yr · 1.5% tax · 5.0% vac · 8.0% maint · 8.0% mgmt
Financing live
Cash to close
- Down payment
- $58,125
- Closing costs
- $6,975
- Reserves months
- —
- Total cash needed
- —
Loan-product check · same deal, 3 products live
Conventional
25% down · 7.5% · 30yr
- Down + closing
- —
- Monthly P&I
- —
- Monthly cashflow
- —
- DSCR
- —
- Eligible?
- —
Personal DTI + credit; lowest rate.
DSCR
20% down · 8.5% · 30yr
- Down + closing
- —
- Monthly P&I
- —
- Monthly cashflow
- —
- DSCR
- —
- Eligible?
- —
No personal income docs; deal must DSCR.
Hard money
10% down · 12.0% · 12mo
- Down + closing
- —
- Monthly P&I
- —
- Monthly cashflow
- —
- DSCR
- —
- Eligible?
- —
Short-term bridge; refi at stabilization.
Rent comps 6 comps
| Address | Beds | Baths | Sqft | Rent | $/sqft | DOM | Units | Dist |
|---|---|---|---|---|---|---|---|---|
| 1322 Olivewood Pl Crandall, TX | 3.0 | 2.0 | 1458 | $2,100 | $1.44 | 9d | 1 | 0.22mi |
| 1322 Olivewood Pl Crandall, TX | 3.0 | 2.0 | 1458 | $2,100 | $1.44 | 0d | 1 | 0.22mi |
| 505 S 5th St Crandall, TX | 3.0 | 2.0 | 1360 | $1,900 | $1.40 | 45d | 1 | 1.14mi |
| 106 N 4th St Crandall, TX | 3.0 | 2.0 | 1200 | $2,000 | $1.67 | 45d | 1 | 1.28mi |
| 106 W Church St Crandall, TX | 2.0 | 1.0 | 984 | $1,500 | $1.52 | 22d | 1 | 1.35mi |
| 2043 Serval Ln Crandall, TX | 3.0 | 2.0 | 1544 | $2,100 | $1.36 | 45d | 1 | 1.48mi |
HOA detail
- Monthly dues
- $63 · $756/yr
Listing history 17 events
-
2026-06-21days on market $232,499 Active 17 DOM
-
2026-06-18days on market $232,499 Active 14 DOM
-
2026-06-17days on market $232,499 Active 13 DOM
-
2026-06-16days on market $232,499 Active 12 DOM
-
2026-06-15days on market $232,499 Active 11 DOM
-
2026-06-13days on market $232,499 Active 9 DOM
-
2026-06-09days on market $232,499 Active 5 DOM
-
2026-06-08days on market $232,499 Active 4 DOM
-
2026-06-07remarks 459-char remark
-
2026-06-07days on market $232,499 Active 3 DOM
-
2026-06-04days on market $232,499 Active 33 DOM
-
2026-06-03days on market $232,499 Active 32 DOM
-
2026-06-02days on market $232,499 Active 31 DOM
-
2026-06-01days on market $232,499 Active 30 DOM
-
2026-05-31days on market $232,499 Active 29 DOM
-
2026-05-03price $232,499 380-char remark
Show marketing remark (380 chars)
This new home is conveniently laid out on a single floor for maximum comfort and convenience. At its heart stands an open-concept layout connecting a spacious family room, a multi-functional kitchen and lovely dining area. The owner's suite is situated in a private corner and comes complete with an adjoining bathroom, while the two secondary bedrooms are located near the foyer.
-
2026-05-02$248,999 Active 380-char remark
Show marketing remark (380 chars)
This new home is conveniently laid out on a single floor for maximum comfort and convenience. At its heart stands an open-concept layout connecting a spacious family room, a multi-functional kitchen and lovely dining area. The owner's suite is situated in a private corner and comes complete with an adjoining bathroom, while the two secondary bedrooms are located near the foyer.
ⓘ Source: listings_history table (triggers on properties + properties_extension) + one-shot
backfill from property_details.listing_events for pre-trigger history.
Tax reassessment forecast TX · Resets to sale price
- Current annual tax
- $1,301 · $108/mo
- Projected year-2 tax
- $4,255 · $355/mo
- Expected delta
- +$2,954/yr (+$246/mo · 227.1%)
ⓘ Screening estimate from a state-policy table — verify with the county assessor before closing.
Nearby sold comps map
Loading sold comps map…
Walkable amenities ~0.75 mi
Loading nearby amenities…
Taxation est. · year 1
- Rental income
- $26,239
- − Mortgage interest
- −$13,024
- − Property taxes
- −$1,301
- − Insurance
- −$1,162
- − Repairs & maintenance
- −$2,099
- − Management
- −$2,099
- − HOA
- −$756
- − Depreciation
- −$6,764
- Taxable loss
- −$966
- Est. tax savings @ 24.0%
- +$232
- After-tax cash flow
- $3,110/yr
For passive investors: Depreciation is non-cash, so a rental often shows a tax loss while cash-flowing — sheltering income. Rental losses are passive: they offset passive income freely, and up to $25,000/yr can offset ordinary (W-2) income if you actively participate and your MAGI is under $100k (phasing out to $0 by $150k); unused losses carry forward. On sale, claimed depreciation is recaptured at up to 25%, and gains may owe capital-gains tax (a 1031 exchange can defer both). Figures are a year-1 estimate at your 24.0% rate — not tax advice; consult a CPA.
Schools (NCES district)
- District
- Crandall ISD
- NCES district ID
- 4815510
- Math proficiency
- 36% ▼ -13.00%
- Reading proficiency
- 42% ▼ -8.00%
- Median HH income
- $70,076
- Composite
- 35.57/100
- National rank
- #4901
- State rank
- #351 of 826 in TX
Livability — Crandall
- Score
- 68/100
- State rank
- #507
- US rank
- #10022
Category grades
Schools grade is shown separately in the Schools card above.
Census & demographics
- Census place
- Crandall, TX
- County
- Kaufman County · 122,338 people
- City population
- 9,333
- Metro
- Dallas-Fort Worth-Arlington, TX
- Population (ZIP)
- 9,333
- Household income
- $88,013
- Rent vs Own
- Severe rent burden
- 33.0
Population outlook (Kaufman County) Hauer SSP2
- Today (2025)
- 138,716 people
- By 2030
- 150,815 · +8.7%
- By 2040
- 174,877 · +26.1%
- By 2050
- 198,020 · +42.8%
- By 2075
- 251,908 · +81.6%
- By 2100
- 285,325 · +105.7%
Race, ethnicity, and origin ACS 2023
- Neighborhood character
- Diverse neighborhood (Simpson 0.62)
- Race & ethnicity
- White 48% Hispanic / Latino 36% Two or more races 14% Black 14%
- Hispanic origin (detail)
- Mexican 34%
- Common ancestry
- Slovak 1%
- Foreign-born
- 18% · Canada, China
- Languages at home
- 71% English-only · Spanish 27% Other Indo-European 1%
Political lean MEDSL · Kaufman
- 2024 margin
- Strong R (+27.9) · D 35.6% · R 63.5%
- 2008→2024 swing
- +7.9pp toward D · 2008: -35.8pp · 2024: -27.9pp
- All cycles
- 2024: R+27.9 2020: R+33.9 2016: R+47.0 2012: R+44.4 2008: R+35.8
Not yet ingested
- Civics
- —
Market trends
- HPI YoY
- ▼ -71.61%
- Current HPI
- 196.4773
- Rent YoY
- —
- Metro
- Dallas-Fort Worth-Arlington, TX
- State GDP YoY
- ▲ 3.95%
- F500 in state
- 110
Industry mix (Fortune 500 HQ in TX)
| Industry | F500 HQs | Revenue |
|---|---|---|
| Energy | 16 | $1,198B |
|
||
| Technology | 5 | $198B |
|
||
| Engineering / Construction | 4 | $72B |
|
||
| Energy Services | 3 | $60B |
|
||
| Utilities | 3 | $41B |
|
||
| Healthcare | 2 | $330B |
|
||
Price history
-6.6% since first listed3 events — show timeline
- 2026-06-04 Listed $232,499 NTREIS
- 2026-05-03 Price Changed $232,499 Zillow
- 2026-05-02 Listed $248,999 Zillow
Property tax history
-7.4%/yrLatest (2025): $1,301 · -7.4% YoY. Source: county tax records.
Cash-flow waterfall
monthlySold comps — $/sqft
last 12 mo · ≤1 miLoading sold comps…