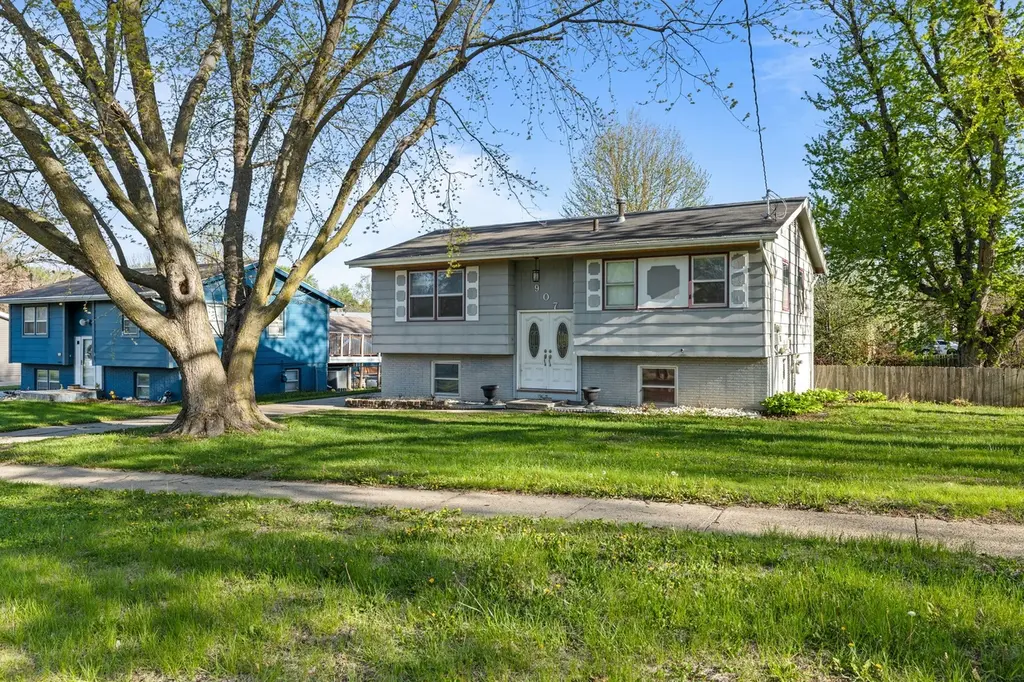
907 4th St SW · Altoona, IA
Flood risk 1/10 · Minimal
- FEMA flood zone
- X (unshaded)
- Chance of flooding over 30 yrs
- 0.0%
- Est. flood insurance / yr
- $473 – $860
Fire risk 1/10 · Minimal
- Est. fire insurance / yr
- $902 – $1,676
Heat risk 3/10 · Minor
- Hot days now (above 103°F)
- 7 days/yr
- Hot days in 30 yrs
- 15 days/yr
Wind risk 2/10 · Minimal
- Chance of severe wind over 30 yrs
- —
Air-quality risk 1/10 · Minimal
- Unhealthy air days now
- 0 days/yr
- Unhealthy air days in 30 yrs
- 0 days/yr
Risk factors via First Street. Map © Google.
Why this score? — see what drove the D grade
The composite is a weighted blend of 9 inputs, each scored 0–100. Each bar is that input's sub-score; the figure is the points it added to the 100-point composite (weight × sub-score).
- ARV discount +15.0/15.0
- Cash flow +6.7/30.0
- Schools +6.4/10.0
- Livability +4.0/5.0
- Rent growth +3.7/5.0
- Condition / age +2.5/5.0
- 1% rule +1.6/10.0
- DSCR +0.9/10.0
- Appreciation +0.0/10.0
$215,000
🖨 Deal sheet (PDF) 📄 Offer letter ✓ Due diligence
Listing remarks MLS
Property is HUD owned and is to be sold As-Is, without repairs or warranties. For more information concerning Lead Based Paint notification, Radon Gas and Mold Disclosure, electronic bidding deadlines and procedures, earnest money procedures, any defects known to Best Assets or listing broker, contact Listing Agent.
Key facts
- 0.29 acre lot
- Built 1972
- Listed 28 days
Property features AI
Exterior
- Utilities: Public water; Public sewer
- Home design: Residential zoning; Poured foundation
- Construction: Asphalt shingle roof; Construction details: see remarks
- Exterior features: Deck; Patio; Fully fenced yard (wood, full fence); Open deck/patio
Interior
- Kitchen: Dishwasher; Microwave; Refrigerator; Stove
- Flooring: Carpet; Vinyl
- Bathrooms: 1 full bathroom
- Heating & cooling: Forced air heating (natural gas); Central air conditioning
- Interior features: Dining area; Daylight, finished basement
- Laundry & utility: Washer; Dryer
Neighborhood map
What this means for you Summary
Snapshot
- This is a 3-bed/1.0-bath single-family listed at $215k.
Deal economics
- At list price, monthly cash flow is $-345 ($-4k/yr) — negative.
- To cash-flow at today's rent, offer at most $154k (28.4% below list).
- To meet the 1% rule (rent ≥ 1% of price), the offer needs to be $142k (34.0% below list).
- Recommended offer: $142k (34.0% below list) — sets the bar for 1% rule.
- Cap rate 4.4% vs local median 3.1% in Altoona — top-decile yield for the area; either an underpriced asset or a hidden risk that comps aren't pricing in. Stress-test before assuming the spread holds.
Location & tenants
- Location reads 80/100 on livability (#85 in IA, #1,757 nationally) — a professional / high-income tenant draw. Strengths: cost of living A+, housing A+, health & safety A+; Watch: amenities F, commute F.
- Southeast Polk Community School District (rural): math 73% / reading 73% proficiency, ranked #70 of 289 in IA (top 24%) — strong family-tenant draw, lease renewals of 3-5y typical.
- Zoned schools: Altoona Elementary (math 82% / reading 72%, grade A, #103 of 616 statewide, top 20%, 419 students, 50% FRL); Southeast Polk Junior High (math 74% / reading 71%, grade A, #90 of 246 statewide, top 38%, 1,088 students, 37% FRL); Southeast Polk High School (math 65% / reading 74%, grade B, #152 of 336 statewide, top 52%, 2,353 students, 32% FRL) — zoned schools average 39% FRL vs 23% district-wide (17 pts higher); higher-poverty schools than district average — tighter screening recommended.
- Market conditions: Rents rising fast (+4.6%/yr); 310 active listings in the ZIP; 15 comparable units currently listed for rent nearby; rentals at typical pace (median 17d on market — plan ~3-4 weeks tenant-placement turnaround); solid renter incomes; 2,953 units permitted in Polk County in 2024 (540 in 5+ unit buildings).
Forward outlook
- Local home prices are declining (-3.0%/yr); year-one equity from $1k of loan paydown is wiped out by about $6k of value loss. Plan a longer hold.
- Polk County population projected at +37% by 2050 — long-run rental-demand tailwind backs the buy-and-hold thesis.
Negotiation context
- It's been on market 29 days — a 2% lower offer ($212k) is reasonable based on typical stale-listing flexibility.
- 3 sale attempts since 21y ago with the ask held roughly flat each time — persistent listings suggest the price (not the market) is what's stuck; bring a comps-based counter.
- Current owner paid $183k; 17% above their basis — modest negotiation headroom, anchor on the comps not their cost.
Questions for the listing agent
- What do current leases actually rent for vs. the listed asking? Can we see a recent rent roll and the last 12 months of T-12 income?
- Built in 1972 — when were the roof, HVAC, electrical panel, plumbing, and water heater last replaced?
- Is there a deadline driving the sale (1031 exchange, divorce, estate, relocation)? That informs how much negotiation room exists.
- Schools are A-rated — typically a magnet for longer-tenancy family renters. What's the average tenant stay here, and is there a school-zone premium baked into asking?
- The area grade is low — what's the realistic commute time and amenity access for the typical tenant pool here? Any planned neighborhood developments (good or bad) we should know about?
- What's the average days-on-market for RENTAL listings here right now (not sales)? A rising rental-DOM trend means longer vacancies and softer asking-rent achievability than the comps imply.
- What's the recent tenant-quality profile in this submarket — average credit score on applications, eviction rate, late-payment / NSF rate, and stable-employment percentage? A property-management company in the area should have these aggregated.
- How much new for-sale + rental construction is in the pipeline within 1–3 miles? Heavy new supply typically softens prices + rents 12–24 months out; constrained supply supports both.
Investment metrics
- 1% rule
- 0.66% ✗
- Cap rate
- 4.37%
- Cash-on-cash
- -6.88%
- DSCR
- 0.69
- GRM
- 12.6
CMA / ARV
- ARV (median comp)
- $258,926
- List price
- $215,000
- Delta
- -16.96%
- Verdict
- UNDERPRICED
- Comps
- 20 within 1.0 mi
Show comp detail 12 sales within ~0.75 mi
| Address | Dist | Beds/Ba | Sqft | Sold | Price | $/sf | Match |
|---|---|---|---|---|---|---|---|
| 107 10th Ave SW | 0.17mi | 3/2.0 | 853 (-1%) | 3mo | $273,000 | $320 | 85 |
| 1005 6th St NW | 0.51mi | 3/1.5 | 880 (+3%) | 0mo | $245,000 | $278 | 70 |
| 1106 7th St NW | 0.55mi | 3/1.5 | 880 (+3%) | 1mo | $265,990 | $302 | 67 |
| 1028 7th St NW | 0.55mi | 3/1.5 | 880 (+3%) | 6mo | $252,000 | $286 | 63 |
| 605 12th Ave NW | 0.52mi | 3/2.0 | 888 (+4%) | 3mo | $245,000 | $276 | 63 |
| 704 3rd Ave SE | 0.70mi | 2/1.0 (-1) | 864 (+1%) | 1mo | $220,000 | $255 | 61 |
| 601 12th Ave NW | 0.51mi | 4/2.0 (+1) | 901 (+5%) | 2mo | $270,000 | $300 | 57 |
| 311 10th Ave NW | 0.34mi | 4/2.0 (+1) | 944 (+10%) | 2mo | $264,900 | $281 | 57 |
| 315 10th Ave NW | 0.35mi | 3/2.0 | 982 (+14%) | 2mo | $308,000 | $314 | 54 |
| 603 1st Ave S | 0.59mi | 3/2.0 | 936 (+9%) | 1mo | $220,000 | $235 | 53 |
| 705 17th Ave SW | 0.48mi | 3/2.0 | 952 (+11%) | 4mo | $275,000 | $289 | 53 |
| 206 6th St SW | 0.46mi | 2/1.0 (-1) | 984 (+15%) | 4mo | $107,000 | $109 | 46 |
Match score weights: distance 35% · size 25% · config 20% · recency 20%. Top-matched comps best support the ARV.
Projected returns pro-forma
-3.0% appreciation · 4.61% rent growth · sell at horizon
- IRR
- -26.5%
- Equity multiple
- 0.09×
- Total profit
- $-54,491
- Equity at exit
- $32,057
- IRR
- -19.2%
- Equity multiple
- -0.09×
- Total profit
- $-65,828
- Equity at exit
- $18,589
Cash invested: $60,200 (down + closing). Projections, not guarantees.
Landlord ↔ Tenant lean methodology
- Overall (STATE)
- 83 Strongly Landlord-Friendly
- State Iowa
- 83 Strongly Landlord-Friendly · R+6
- County
- — inherits STATE
- City
- — inherits STATE
ZIP-level market 50009
- Rents YoY
- 4.6%
- Active inventory
- 310
- Price-to-rent
- 12.6×
Monthly cashflow live
- Estimated rent
- $1,420 high interval (Pro) →
- Mortgage (P&I)
- −$1,127
- Tax from tax record
- −$250 /mo · $2,998/yr
- Insurance
- −$90
- HOA
- −$0
- Vacancy / Maint / Mgmt
- −$298
- Net cashflow
- $-345
Break-even live
Sensitivity live
| Price | -10% $-224 | -5% $-285 | +0% $-345 | +5% $-406 | +10% $-467 |
|---|---|---|---|---|---|
| Rent | -10% $-458 | -5% $-401 | +0% $-345 | +5% $-289 | +10% $-233 |
| Rate | -1.0pp $-237 | -0.5pp $-291 | base $-345 | +0.5pp $-401 | +1.0pp $-458 |
UW: 25.0% down · 7.5% · 30yr · 1.5% tax · 5.0% vac · 8.0% maint · 8.0% mgmt
Financing live
Cash to close
- Down payment
- $53,750
- Closing costs
- $6,450
- Reserves months
- —
- Total cash needed
- —
Loan-product check · same deal, 3 products live
Conventional
25% down · 7.5% · 30yr
- Down + closing
- —
- Monthly P&I
- —
- Monthly cashflow
- —
- DSCR
- —
- Eligible?
- —
Personal DTI + credit; lowest rate.
DSCR
20% down · 8.5% · 30yr
- Down + closing
- —
- Monthly P&I
- —
- Monthly cashflow
- —
- DSCR
- —
- Eligible?
- —
No personal income docs; deal must DSCR.
Hard money
10% down · 12.0% · 12mo
- Down + closing
- —
- Monthly P&I
- —
- Monthly cashflow
- —
- DSCR
- —
- Eligible?
- —
Short-term bridge; refi at stabilization.
Rent comps 15 comps
| Address | Beds | Baths | Sqft | Rent | $/sqft | DOM | Units | Dist |
|---|---|---|---|---|---|---|---|---|
| 108 5th Ave NW Unit 3 Altoona, IA | 3.0 | 1.0 | 1040 | $1,229 | $1.18 | 25d | 1 | 0.36mi |
| 108 5th Ave NW Unit 3 Altoona, IA | 1.0–3.0 | 1.0 | 870 | $1,229 | $1.41 | 16d | 10 | 0.36mi |
| 908 8th St SW Altoona, IA | 1.0–2.0 | 1.0–2.0 | 756 | $955 | $1.26 | 16d | 5 | 0.42mi |
| 300 5th Ave NW Altoona, IA | 3.0 | 1.0 | 1008 | $1,595 | $1.58 | 25d | 1 | 0.44mi |
| 401 2nd St NW Altoona, IA | 2.0 | 2.0 | 1000 | $1,025 | $1.02 | 16d | 2 | 0.45mi |
| 351 2nd St NW Altoona, IA | 2.0 | 2.0 | 1000 | $1,025 | $1.02 | 46d | 1 | 0.50mi |
| 1000 Adventureland Dr Altoona, IA | 1.0–2.0 | 1.0–1.5 | 745 | $1,028 | $1.38 | 16d | 11 | 0.61mi |
| 203 3rd St SE Unit 2B Altoona, IA | 2.0 | 1.0 | 780 | $1,849 | $2.37 | 16d | 1 | 0.63mi |
| 203 3rd St SE Unit 1A Altoona, IA | 2.0 | 1.0 | 780 | $1,050 | $1.35 | 21d | 1 | 0.63mi |
| 615 17th Ave NW Altoona, IA | 1.0–3.0 | 1.0–2.0 | 795 | $1,502 | $1.89 | 16d | 12 | 0.66mi |
| 1414 Adventureland Dr Altoona, IA | 4.0 | 2.0 | 916 | $2,686 | $2.93 | 16d | 10 | 0.72mi |
| 1040 Blue Ridge Pl NW Altoona, IA | 1.0–3.0 | 1.0–2.0 | 874 | $1,542 | $1.76 | 16d | 13 | 0.82mi |
| 901 7th Ave SE Altoona, IA | 1.0–3.0 | 1.0–2.0 | 825 | $1,250 | $1.52 | 16d | 4 | 1.07mi |
| 1550 28th Ave SW Altoona, IA | 3.0 | 1.0 | 1051 | $1,400 | $1.33 | 16d | 1 | 1.38mi |
| 1554 28th Ave SW Altoona, IA | 3.0 | 1.0 | 1051 | $1,400 | $1.33 | 46d | 1 | 1.38mi |
Listing history 8 events
-
2026-05-06price $215,000 757-char remark
-
2026-04-28$220,000 Active 757-char remark
-
2022-06-13soldstatus $183,000
-
2022-01-26soldstatus $204,000
-
2008-06-25soldstatus $97,750 317-char remark
Show marketing remark (317 chars)
Property is HUD owned and is to be sold As-Is, without repairs or warranties. For more information concerning Lead Based Paint notification, Radon Gas and Mold Disclosure, electronic bidding deadlines and procedures, earnest money procedures, any defects known to Best Assets or listing broker, contact Listing Agent.
-
2008-05-02$105,000 317-char remark
Show marketing remark (317 chars)
Property is HUD owned and is to be sold As-Is, without repairs or warranties. For more information concerning Lead Based Paint notification, Radon Gas and Mold Disclosure, electronic bidding deadlines and procedures, earnest money procedures, any defects known to Best Assets or listing broker, contact Listing Agent.
-
2005-12-06soldstatus $129,500
-
2005-10-05$124,900
ⓘ Source: listings_history table (triggers on properties + properties_extension) + one-shot
backfill from property_details.listing_events for pre-trigger history.
Tax reassessment forecast IA · Partial reset (capped growth)
- Current annual tax
- $2,998 · $250/mo
- Projected year-2 tax
- $3,187 · $266/mo
- Expected delta
- +$189/yr (+$16/mo · 6.3%)
ⓘ Screening estimate from a state-policy table — verify with the county assessor before closing.
Climate risk First Street
- Flood 1/10 Low FEMA zone X (unshaded) · 0% chance over 30 yrs
- Wildfire 1/10 Low
- Heat 3/10 Moderate 7 d/yr ≥103°F today · 15 d/yr by 30 yrs out
- Wind 2/10 Low
- Air quality 1/10 Low 0 unhealthy d/yr today · 0 by 30 yrs out
Nearby sold comps map
Loading sold comps map…
Walkable amenities ~0.75 mi
Loading nearby amenities…
Taxation est. · year 1
- Rental income
- $17,036
- − Mortgage interest
- −$12,043
- − Property taxes
- −$2,998
- − Insurance
- −$1,075
- − Repairs & maintenance
- −$1,363
- − Management
- −$1,363
- − Depreciation
- −$6,255
- Taxable loss
- −$8,061
- Est. tax savings @ 24.0%
- +$1,935
- After-tax cash flow
- $-2,210/yr
For passive investors: Depreciation is non-cash, so a rental often shows a tax loss while cash-flowing — sheltering income. Rental losses are passive: they offset passive income freely, and up to $25,000/yr can offset ordinary (W-2) income if you actively participate and your MAGI is under $100k (phasing out to $0 by $150k); unused losses carry forward. On sale, claimed depreciation is recaptured at up to 25%, and gains may owe capital-gains tax (a 1031 exchange can defer both). Figures are a year-1 estimate at your 24.0% rate — not tax advice; consult a CPA.
Schools (NCES district)
- District
- Southeast Polk Community School District
- NCES district ID
- 1926820
- Math proficiency
- 73% ▼ -8.00%
- Reading proficiency
- 73% ▼ -3.00%
- Median HH income
- $73,440
- Composite
- 64.1/100
- National rank
- #575
- State rank
- #70 of 289 in IA
Livability — Altoona
- Score
- 80/100
- State rank
- #85
- US rank
- #1757
Category grades
Schools grade is shown separately in the Schools card above.
Census & demographics
- Census place
- Altoona, IA
- County
- Polk County · 453,298 people
- City population
- 22,886
- Metro
- Des Moines-West Des Moines, IA
- Population (ZIP)
- 22,886
- Household income
- $88,447
- Rent vs Own
- Severe rent burden
- 566.0
Population outlook (Polk County) Hauer SSP2
- Today (2025)
- 548,042 people
- By 2030
- 588,557 · +7.4%
- By 2040
- 670,629 · +22.4%
- By 2050
- 752,830 · +37.4%
- By 2075
- 955,069 · +74.3%
- By 2100
- 1,115,436 · +103.5%
Race, ethnicity, and origin ACS 2023
- Neighborhood character
- Predominantly White (84%)
- Race & ethnicity
- White 84% Hispanic / Latino 7% Two or more races 5% Black 3% Asian 2%
- Hispanic origin (detail)
- Mexican 6%
- Common ancestry
- Iranian 5% Portuguese 3% Italian 3%
- Foreign-born
- 5% · Canada, South Korea
- Languages at home
- 95% English-only · Spanish 3% Arabic 1%
Political lean MEDSL · Polk
- 2024 margin
- D (+10.9) · D 54.8% · R 43.9% · Other 1.3%
- 2008→2024 swing
- -3.7pp toward R · 2008: 14.6pp · 2024: 10.9pp
- All cycles
- 2024: D+10.9 2020: D+15.2 2016: D+11.5 2012: D+14.2 2008: D+14.6
Not yet ingested
- Civics
- —
Market trends
- HPI YoY
- ▼ -154.79%
- Current HPI
- 215.9041
- Rent YoY
- ▲ 4.61%
- Metro
- Des Moines-West Des Moines, IA
- State GDP YoY
- ▲ 2.48%
- F500 in state
- 4
Industry mix (Fortune 500 HQ in IA)
| Industry | F500 HQs | Revenue |
|---|---|---|
| Financial Services | 1 | $16B |
|
||
| Retail / Convenience | 1 | $15B |
|
||
Price history
+72.1% since first listed9 events — show timeline
- 2026-05-28 Listing Removed — DMMLS
- 2026-05-06 Price Changed $215,000 DMMLS
- 2026-04-28 Listed $220,000 DMMLS
- 2022-06-13 Sold (Public Records) $183,000 Public Records
- 2022-01-26 Sold (Public Records) $204,000 Public Records
- 2008-06-25 Sold (MLS) $97,750 DMMLS
- 2008-05-02 Listed $105,000 DMMLS
- 2005-12-06 Sold (Public Records) $129,500 Public Records
- 2005-10-05 Listed $124,900 DMMLS
Property tax history
+1.4%/yrLatest (2025): $2,998 · +2.3% YoY. Source: county tax records.
Cash-flow waterfall
monthlySold comps — $/sqft
last 12 mo · ≤1 miLoading sold comps…