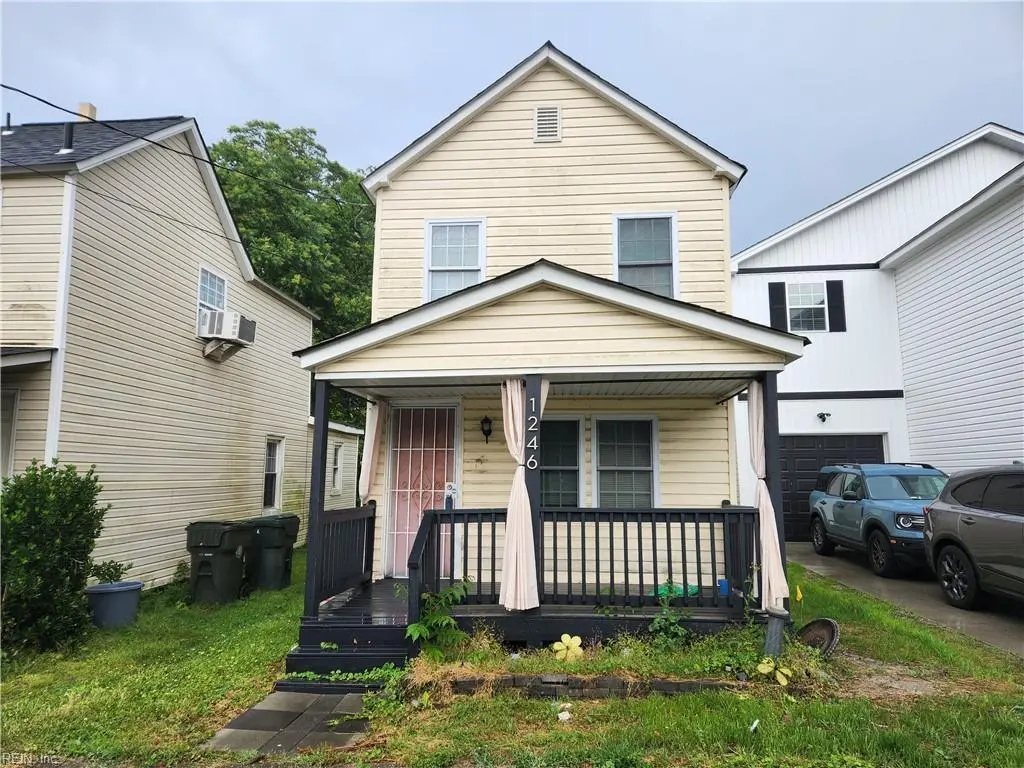
1246 24th St · Newport News, VA
Flood risk 5/10 · Moderate
- FEMA flood zone
- X (unshaded)
- Chance of flooding over 30 yrs
- 0.51%
- Est. flood insurance / yr
- $507 – $1,088
Fire risk 1/10 · Minimal
- Est. fire insurance / yr
- $666 – $1,236
Heat risk 9/10 · Severe
- Hot days now (above 106°F)
- 7 days/yr
- Hot days in 30 yrs
- 16 days/yr
Wind risk 8/10 · Major
- Chance of severe wind over 30 yrs
- 80.0%
Air-quality risk 2/10 · Minimal
- Unhealthy air days now
- 1 days/yr
- Unhealthy air days in 30 yrs
- 1 days/yr
Risk factors via First Street. Map © Google.
Why this score? — see what drove the B- grade
The composite is a weighted blend of 9 inputs, each scored 0–100. Each bar is that input's sub-score; the figure is the points it added to the 100-point composite (weight × sub-score).
- Cash flow +22.4/30.0
- ARV discount +15.0/15.0
- DSCR +7.2/10.0
- 1% rule +5.4/10.0
- Appreciation +4.6/10.0
- Schools +3.8/10.0
- Livability +3.8/5.0
- Rent growth +3.2/5.0
- Condition / age +2.5/5.0
$150,000
🖨 Deal sheet 📄 Offer letter ✓ Due diligence
Listing remarks
Calling all INVESTORS!! Property being sold "as is", "where is". Seller to make no repairs. Appliances convey "as is". Great property for flip or to hold for rental.
Key facts
- 2,613 sq ft lot
- Built 1925
- Listed 41 days
Property features AI
Finance
- HOA & community: No homeowners association; No HOA fees
Exterior
- Parking: Street parking
- Utilities: City/county water; City/county sewer; Gas water heater; Natural gas for heating; Window/wall air conditioning
- Home design: Detached traditional-style home; 2 stories; Slab foundation; Simple ownership
- Construction: Vinyl exterior; Asphalt shingle roof; Slab foundation
- Exterior features: Vinyl siding; Lot approximately 0.06 acres (100 x 25)
Interior
- Kitchen: Range; Refrigerator
- Bedrooms: Master bedroom on 2nd floor; Two additional bedrooms on 2nd floor; No bedroom with ensuite; No bedroom and full bathroom on 1st floor
- Flooring: Carpet; Vinyl
- Bathrooms: 1 full bathroom; 1 half bathroom
- Heating & cooling: Natural gas heating; Window/wall cooling
- Interior features: Carpet and vinyl flooring; 6 total rooms; City view
Neighborhood map
What this means for you Summary
Snapshot
- This is a 3-bed/1.5-bath single-family listed at $150k.
Deal economics
- At list price, monthly cash flow is $251 ($3k/yr) — positive.
- The deal already cash-flows at list — no discount required.
- Meets the 1% rule at list price ($2k rent vs $150k).
- Recommended offer: $146k (3.0% below list) — sets the bar for market timing.
- Cap rate 8.3% vs local median 4.2% in Newport News — top-decile yield for the area; either an underpriced asset or a hidden risk that comps aren't pricing in. Stress-test before assuming the spread holds.
Location & tenants
- Location reads 75/100 on livability (#123 in VA, #4,018 nationally) — a middle-class / working-renter tenant base. Strengths: health & safety A+, cost of living A, housing A; Watch: crime F, commute F.
- Newport News City Public School District (urban): math 34% / reading 54% proficiency, ranked #112 of 131 in VA (top 86%) — families likely to look elsewhere, expect single-tenant / working-renter base with shorter leases.
- Zoned schools: Carver Elementary (math 14% / reading 32%, grade F, #1,066 of 1,108 statewide, top 96%, 600 students, 90% FRL); Heritage High (math 49% / reading 67%, grade C, #262 of 319 statewide, top 82%, 1,111 students, 85% FRL) — zoned schools average 88% FRL vs 55% district-wide (33 pts higher); higher-poverty schools than district average — tighter screening recommended.
- Market conditions: Rents rising (+2.9%/yr); 128 active listings in the ZIP; 40 comparable units currently listed for rent nearby; rentals at typical pace (median 24d on market — plan ~3-4 weeks tenant-placement turnaround); lower-income renter base — watch delinquency; 522 units permitted in Newport News city in 2024 (458 in 5+ unit buildings).
Forward outlook
- Local home prices are declining (-0.8%/yr); year-one equity from $1k of loan paydown is wiped out by about $1k of value loss. Plan a longer hold.
- Newport News County population projected to shrink 8% by 2050 — rents likely to lag national; underwrite the cash flow, not the appreciation.
- At projected returns (-0.8% appreciation + 2.9% rent growth), your $42k cash investment doubles in ~9 years — after that, you're playing with house money.
Negotiation context
- It's been on market 41 days — a 3% lower offer ($146k) is reasonable based on typical stale-listing flexibility.
- 3 sale attempts since 4y ago with the ask held roughly flat each time — persistent listings suggest the price (not the market) is what's stuck; bring a comps-based counter.
- Current owner paid $120k; 25% above their basis — modest negotiation headroom, anchor on the comps not their cost.
Risks & watch-outs
- Watch-outs: built in 1925 — expect roof / HVAC / electrical / plumbing capex.
- Climate carrying-cost: moderate flood risk; severe wind risk, 80% chance of damaging wind over 30y; extreme-heat days projected 7→16/yr by 2055 (HVAC capex compounding) — expect insurance premiums to compound above CPI over the hold.
Questions for the listing agent
- It's been on market 41 days. Have you received any prior offers? Is the seller open to a 3% concession, seller financing, or rate buy-down credit?
- Built in 1925 — when were the roof, HVAC, electrical panel, plumbing, and water heater last replaced?
- Is there a deadline driving the sale (1031 exchange, divorce, estate, relocation)? That informs how much negotiation room exists.
- Schools are B-rated — typically a magnet for longer-tenancy family renters. What's the average tenant stay here, and is there a school-zone premium baked into asking?
- Crime grade is F in this area — have there been break-ins, vandalism, or insurance claims at this property in the last 3 years? What carrier currently insures it and at what premium?
- What's the average days-on-market for RENTAL listings here right now (not sales)? A rising rental-DOM trend means longer vacancies and softer asking-rent achievability than the comps imply.
- What's the recent tenant-quality profile in this submarket — average credit score on applications, eviction rate, late-payment / NSF rate, and stable-employment percentage? A property-management company in the area should have these aggregated.
- How much new for-sale + rental construction is in the pipeline within 1–3 miles? Heavy new supply typically softens prices + rents 12–24 months out; constrained supply supports both.
Investment metrics
- 1% rule
- 1.04% ✓
- Cap rate
- 8.30%
- Cash-on-cash
- 7.16%
- DSCR
- 1.32
- GRM
- 8.0
CMA / ARV
- ARV (median comp)
- $183,750
- List price
- $150,000
- Delta
- -18.37%
- Verdict
- UNDERPRICED
- Comps
- 20 within 1.0 mi
Show comp detail 12 sales within ~0.75 mi
| Address | Dist | Beds/Ba | Sqft | Sold | Price | $/sf | Match |
|---|---|---|---|---|---|---|---|
| 1234 22nd St | 0.10mi | 3/1.0 | 1,100 (-3%) | 1mo | $259,000 | $235 | 88 |
| 1141 27th St | 0.25mi | 3/1.0 | 1,000 (-12%) | 2mo | $85,000 | $85 | 65 |
| 407 Pine Ave | 0.63mi | 3/2.0 | 1,160 (+2%) | 1mo | $255,000 | $220 | 64 |
| 2106 Chestnut Ave | 0.20mi | 4/3.0 (+1) | 1,244 (+10%) | 2mo | $295,000 | $237 | 62 |
| 960 15th St | 0.63mi | 3/1.5 | 1,195 (+6%) | 0mo | $137,000 | $115 | 61 |
| 56 Poplar Ave | 0.65mi | 3/1.5 | 1,192 (+5%) | 2mo | $210,000 | $176 | 60 |
| 942 20th St | 0.49mi | 3/1.5 | 1,250 (+10%) | 1mo | $180,000 | $144 | 59 |
| 2010 Roanoke Ave | 0.34mi | 3/1.0 | 1,300 (+15%) | 2mo | $180,000 | $138 | 56 |
| 937 17th St | 0.57mi | 3/2.0 | 1,245 (+10%) | 0mo | $252,500 | $203 | 55 |
| 988 15th St | 0.60mi | 2/1.0 (-1) | 1,061 (-6%) | 1mo | $126,050 | $119 | 53 |
| 848 31st St | 0.67mi | 3/1.0 | 1,045 (-8%) | 1mo | $175,000 | $167 | 53 |
| 3015 Wickham Ave | 0.64mi | 3/2.0 | 1,300 (+15%) | 1mo | $252,000 | $194 | 43 |
Match score weights: distance 35% · size 25% · config 20% · recency 20%. Top-matched comps best support the ARV.
Projected returns pro-forma
-0.84% appreciation · 2.91% rent growth · sell at horizon
- IRR
- 3.0%
- Equity multiple
- 1.13×
- Total profit
- $5,596
- Equity at exit
- $37,360
- IRR
- 9.2%
- Equity multiple
- 1.91×
- Total profit
- $38,152
- Equity at exit
- $40,221
Cash invested: $42,000 (down + closing). Projections, not guarantees.
Landlord ↔ Tenant lean methodology
- Overall (STATE)
- 55 Moderately Landlord-Leaning
- State Virginia
- 55 Moderately Landlord-Leaning · D+2
- County
- — inherits STATE
- City
- — inherits STATE
ZIP-level market 23607
- Home prices YoY
- -0.3%
- Rents YoY
- 2.9%
- Active inventory
- 128
- Price-to-rent
- 8.0×
Monthly cashflow live
- Estimated rent
- $1,566 high interval (Pro) →
- Mortgage (P&I)
- −$787
- Tax from tax record
- −$137 /mo · $1,648/yr
- Insurance
- −$62
- HOA
- −$0
- Vacancy / Maint / Mgmt
- −$329
- Net cashflow
- $251
Break-even live
UW: 25.0% down · 7.5% · 30yr · 1.5% tax · 5.0% vac · 8.0% maint · 8.0% mgmt
Financing live
Cash to close
- Down payment
- $37,500
- Closing costs
- $4,500
- Reserves months
- —
- Total cash needed
- —
Loan-product check · same deal, 3 products live
Conventional
25% down · 7.5% · 30yr
- Down + closing
- —
- Monthly P&I
- —
- Monthly cashflow
- —
- DSCR
- —
- Eligible?
- —
Personal DTI + credit; lowest rate.
DSCR
20% down · 8.5% · 30yr
- Down + closing
- —
- Monthly P&I
- —
- Monthly cashflow
- —
- DSCR
- —
- Eligible?
- —
No personal income docs; deal must DSCR.
Hard money
10% down · 12.0% · 12mo
- Down + closing
- —
- Monthly P&I
- —
- Monthly cashflow
- —
- DSCR
- —
- Eligible?
- —
Short-term bridge; refi at stabilization.
Rent comps 40 comps
| Address | Beds | Baths | Sqft | Rent | $/sqft | DOM | Units | Dist |
|---|---|---|---|---|---|---|---|---|
| 1240 24th St Newport News, VA | 2.0 | 1.0 | 752 | $995 | $1.32 | 23d | 1 | 0.02mi |
| 1239 24th St Newport News, VA | 3.0 | 1.0 | 880 | $1,495 | $1.70 | 43d | 1 | 0.04mi |
| 2314 Chestnut Ave Newport News, VA | 2.0 | 1.0 | 900 | $12,900 | $14.33 | 1d | 1 | 0.10mi |
| 1216 21st St Newport News, VA | 3.0 | 3.5 | 1446 | $1,700 | $1.18 | 23d | 1 | 0.20mi |
| 1348 28th St Newport News, VA | 2.0 | 1.0 | 997 | $1,350 | $1.35 | 4d | 1 | 0.27mi |
| 1348 28th St Unit NA Newport News, VA | 2.0 | 1.0 | 997 | $1,350 | $1.35 | 23d | 1 | 0.27mi |
| 1035 23rd St Newport News, VA | 3.0 | 2.0 | 1378 | $1,600 | $1.16 | 43d | 1 | 0.33mi |
| 1227 31st St Newport News, VA | 3.0 | 2.0 | 1500 | $2,495 | $1.66 | 1d | 1 | 0.39mi |
| 41 Ash Ave Unit B Newport News, VA | 2.0 | 1.0 | 930 | $1,500 | $1.61 | 23d | 1 | 0.49mi |
| 1124 33rd St Newport News, VA | 3.0 | 1.5 | 1386 | $1,600 | $1.15 | 23d | 1 | 0.51mi |
| 35 Cedar Ave Newport News, VA | 3.0 | 1.5 | 1138 | $1,595 | $1.40 | 43d | 1 | 0.54mi |
| 932 16th St Newport News, VA | 2.0 | 1.0 | 754 | $1,500 | $1.99 | 43d | 1 | 0.61mi |
| 321 Pine Ave Newport News, VA | 3.0 | 2.5 | 1349 | $1,990 | $1.48 | 23d | 1 | 0.61mi |
| 829 22nd St Newport News, VA | 3.0 | 1.5 | 1020 | $1,650 | $1.62 | 43d | 1 | 0.62mi |
| 1152 Orcutt Ave Newport News, VA | 3.0 | 1.0 | 947 | $1,375 | $1.45 | 4d | 1 | 0.62mi |
| 233 Pine Ave Newport News, VA | 3.0 | 2.0 | 1213 | $2,100 | $1.73 | 23d | 1 | 0.62mi |
| 1010 36th St Newport News, VA | 2.0 | 1.0 | 775 | $1,095 | $1.41 | 23d | 1 | 0.72mi |
| 1032 37th St Newport News, VA | 3.0 | 2.0 | 1191 | $1,450 | $1.22 | 43d | 1 | 0.74mi |
| 740 21st St Newport News, VA | 3.0 | 2.0 | 1120 | $2,000 | $1.79 | 43d | 1 | 0.77mi |
| 749 31st St Newport News, VA | 3.0 | 2.0 | 1000 | $1,900 | $1.90 | 43d | 1 | 0.83mi |
| 935 37th St Unit 15 Newport News, VA | 2.0 | 1.0 | 700 | $995 | $1.42 | 7d | 1 | 0.86mi |
| 935 37th St Unit 4 Newport News, VA | 2.0 | 1.0 | 700 | $900 | $1.29 | 23d | 1 | 0.86mi |
| 935 37th St Unit 16 Newport News, VA | 2.0 | 1.0 | 700 | $995 | $1.42 | 43d | 1 | 0.86mi |
| 327 Locust Ave Hampton, VA | 4.0 | 2.0 | 1500 | $2,000 | $1.33 | 43d | 1 | 0.94mi |
| 3206 Madison Ave Newport News, VA | 3.0 | 1.0 | 900 | $1,550 | $1.72 | 10d | 1 | 0.95mi |
| 709 33rd St Unit 1 Newport News, VA | 2.0 | 1.0 | 878 | $1,400 | $1.59 | 17d | 1 | 0.95mi |
| 913 41st St Newport News, VA | 2.0 | 1.5 | 740 | $1,045 | $1.41 | 23d | 1 | 1.00mi |
| 4111 Orcutt Ave Newport News, VA | 2.0 | 1.0 | 740 | $795 | $1.07 | 3d | 1 | 1.00mi |
| 915 41st St Newport News, VA | 2.0 | 1.0 | 740 | $1,045 | $1.41 | 23d | 1 | 1.00mi |
| 4104 Newsome Dr Newport News, VA | 2.0 | 1.0 | 740 | $1,045 | $1.41 | 43d | 1 | 1.02mi |
| 4104 Newsome Dr Newport News, VA | 2.0 | 1.0 | 740 | $1,045 | $1.41 | 23d | 1 | 1.02mi |
| 417 Greenbriar Ave Hampton, VA | 3.0 | 2.0 | 1007 | $1,695 | $1.68 | 7d | 1 | 1.02mi |
| 4101 Newsome Dr Newport News, VA | 2.0 | 1.0 | 740 | $1,045 | $1.41 | 23d | 1 | 1.03mi |
| 4107 Newsome Dr Newport News, VA | 2.0 | 1.0 | 740 | $1,045 | $1.41 | 43d | 1 | 1.04mi |
| 4218 Newsome Dr Newport News, VA | 2.0 | 1.0 | 740 | $795 | $1.07 | 3d | 1 | 1.04mi |
| 4200 Newsome Dr Newport News, VA | 2.0 | 1.0 | 895 | $795 | $0.89 | 23d | 1 | 1.05mi |
| 4224 Newsome Dr Newport News, VA | 2.0 | 1.0 | 740 | $1,045 | $1.41 | 23d | 1 | 1.05mi |
| 4226 Newsome Dr Newport News, VA | 2.0 | 1.0 | 740 | $1,045 | $1.41 | 23d | 1 | 1.05mi |
| 4119 Newsome Dr Newport News, VA | 2.0 | 1.0 | 740 | $1,045 | $1.41 | 23d | 1 | 1.06mi |
| 4241 Orcutt Ave Newport News, VA | 2.0 | 1.0 | 740 | $795 | $1.07 | 3d | 1 | 1.06mi |
Listing history 22 events
-
2026-06-18days on market $150,000 Active 41 DOM
-
2026-06-17days on market $150,000 Active 40 DOM
-
2026-06-16remarks 166-char remark
-
2026-06-16pricedays on market $150,000 Active 39 DOM
-
2026-06-15days on market $155,000 Active 38 DOM
-
2026-06-09days on market $155,000 Active 32 DOM
-
2026-06-08days on market $155,000 Active 31 DOM
-
2026-06-07days on market $155,000 Active 30 DOM
-
2026-06-03days on market $155,000 Active 26 DOM
-
2026-06-02days on market $155,000 Active 25 DOM
-
2026-06-01days on market $155,000 Active 24 DOM
-
2026-05-31days on market $155,000 Active 23 DOM
-
2026-05-08$155,000 Active 198-char remark
-
2022-10-17soldstatus $120,000
-
2022-09-26status Under Contract
-
2022-09-12historical Active Under Contract
-
2022-09-07status Active
-
2022-08-25historical Active Under Contract
-
2022-08-11$115,000 Active
-
1992-11-20soldstatus $7,000
-
1983-04-25soldstatus $28,000
-
1975-07-01soldstatus $23,000
ⓘ Source: listings_history table (triggers on properties + properties_extension) + one-shot
backfill from property_details.listing_events for pre-trigger history.
Tax reassessment forecast VA · Resets to sale price
- Current annual tax
- $1,648 · $137/mo
- Projected year-2 tax
- $1,648 · $137/mo
- Expected delta
- $0/yr ($0/mo · 0.0%)
ⓘ Screening estimate from a state-policy table — verify with the county assessor before closing.
Climate risk First Street
- Flood 5/10 Major FEMA zone X (unshaded) · 51% chance over 30 yrs
- Wildfire 1/10 Low
- Heat 9/10 Extreme 7 d/yr ≥106°F today · 16 d/yr by 30 yrs out
- Wind 8/10 Severe 80% chance of damaging wind over 30 yrs
- Air quality 2/10 Low 1 unhealthy d/yr today · 1 by 30 yrs out
Nearby sold comps map
Loading sold comps map…
Walkable amenities ~0.75 mi
Loading nearby amenities…
Taxation est. · year 1
- Rental income
- $18,789
- − Mortgage interest
- −$8,402
- − Property taxes
- −$1,648
- − Insurance
- −$750
- − Repairs & maintenance
- −$1,503
- − Management
- −$1,503
- − Depreciation
- −$4,364
- Taxable income
- $619
- Est. tax owed @ 24.0%
- −$149
- After-tax cash flow
- $2,858/yr
For passive investors: Depreciation is non-cash, so a rental often shows a tax loss while cash-flowing — sheltering income. Rental losses are passive: they offset passive income freely, and up to $25,000/yr can offset ordinary (W-2) income if you actively participate and your MAGI is under $100k (phasing out to $0 by $150k); unused losses carry forward. On sale, claimed depreciation is recaptured at up to 25%, and gains may owe capital-gains tax (a 1031 exchange can defer both). Figures are a year-1 estimate at your 24.0% rate — not tax advice; consult a CPA.
Schools (NCES district)
- District
- Newport News City Public School District
- NCES district ID
- 5102640
- Math proficiency
- 34% ▼ -37.00%
- Reading proficiency
- 54% ▼ -10.00%
- Median HH income
- $49,644
- Composite
- 37.7/100
- National rank
- #4360
- State rank
- #112 of 131 in VA
Livability — Newport News
- Score
- 75/100
- State rank
- #123
- US rank
- #4018
Category grades
Schools grade is shown separately in the Schools card above.
Census & demographics
- Census place
- Newport News, VA
- County
- Newport News City · 178,950 people
- City population
- 178,950
- Metro
- Virginia Beach-Norfolk-Newport News, VA-NC
- Population (ZIP)
- 23,096
- Household income
- $42,334
- Rent vs Own
- Severe rent burden
- 2008.0
Population outlook (Newport News County) Hauer SSP2
- Today (2025)
- 181,076 people
- By 2030
- 179,683 · -0.8%
- By 2040
- 174,649 · -3.5%
- By 2050
- 167,407 · -7.5%
- By 2075
- 147,597 · -18.5%
- By 2100
- 122,144 · -32.5%
Race, ethnicity, and origin ACS 2023
- Neighborhood character
- Predominantly Black (75%)
- Race & ethnicity
- Black 75% White 13% Two or more races 7% Hispanic / Latino 6% Asian 1%
- Hispanic origin (detail)
- Mexican 1% Puerto Rican 2%
- Foreign-born
- 3% · Canada
- Languages at home
- 96% English-only · Spanish 3%
Political lean MEDSL · Newport News
- 2024 margin
- Strong D (+28.8) · D 63.7% · R 34.9% · Other 1.4%
- 2008→2024 swing
- +0.1pp no change · 2008: 28.7pp · 2024: 28.8pp
- All cycles
- 2024: D+28.8 2020: D+32.9 2016: D+25.4 2012: D+30.0 2008: D+28.7
Not yet ingested
- Civics
- —
Market trends
- HPI YoY
- ▼ -0.84%
- Current HPI
- 312.4039
- Rent YoY
- ▲ 2.91%
- Metro
- Virginia Beach-Norfolk-Newport News, VA-NC
- State GDP YoY
- ▲ 2.40%
- F500 in state
- 50
Industry mix (Fortune 500 HQ in VA)
| Industry | F500 HQs | Revenue |
|---|---|---|
| Aerospace / Defense | 4 | $236B |
|
||
| Technology / Defense | 3 | $32B |
|
||
| Financial Services | 2 | $176B |
|
||
| Utilities | 2 | $27B |
|
||
| Insurance | 2 | $25B |
|
||
| Technology | 2 | $15B |
|
||
Price history
+552.2% since first listed11 events — show timeline
- 2026-06-16 Price Changed $150,000 REINMLS
- 2026-05-08 Listed $155,000 REINMLS
- 2022-10-17 Sold (Public Records) $120,000 Public Records
- 2022-09-26 Pending — REINMLS
- 2022-09-12 Contingent — REINMLS
- 2022-09-07 Relisted — REINMLS
- 2022-08-25 Contingent — REINMLS
- 2022-08-11 Listed $115,000 REINMLS
- 1992-11-20 Sold (Public Records) $7,000 Public Records
- 1983-04-25 Sold (Public Records) $28,000 Public Records
- 1975-07-01 Sold (Public Records) $23,000 Public Records
Property tax history
+5.7%/yrLatest (2026): $1,648 · +15.7% YoY. Source: county tax records.
Cash-flow waterfall
monthlySold comps — $/sqft
last 12 mo · ≤1 miLoading sold comps…