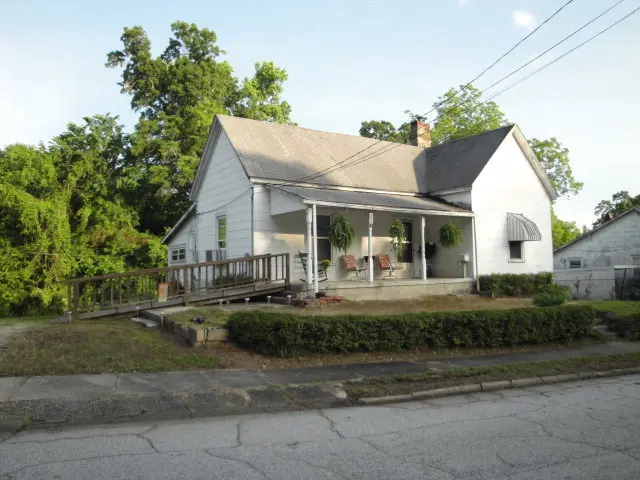
207 Ellis Ave · Abbeville, SC
Flood risk 4/10 · Minor
- FEMA flood zone
- X (unshaded)
- Chance of flooding over 30 yrs
- 0.22%
- Est. flood insurance / yr
- $473 – $860
Fire risk 4/10 · Minor
- Est. fire insurance / yr
- $783 – $1,453
Heat risk 6/10 · Moderate
- Hot days now (above 106°F)
- 7 days/yr
- Hot days in 30 yrs
- 17 days/yr
Wind risk 6/10 · Moderate
- Chance of severe wind over 30 yrs
- 27.0%
Air-quality risk 2/10 · Minimal
- Unhealthy air days now
- 2 days/yr
- Unhealthy air days in 30 yrs
- 2 days/yr
Risk factors via First Street. Map © Google.
Why this score? — see what drove the C- grade
The composite is a weighted blend of 9 inputs, each scored 0–100. Each bar is that input's sub-score; the figure is the points it added to the 100-point composite (weight × sub-score).
- ARV discount +15.0/15.0
- Appreciation +10.0/10.0
- Cash flow +8.2/30.0
- Schools +4.1/10.0
- Livability +3.3/5.0
- 1% rule +2.5/10.0
- Rent growth +2.5/5.0
- Condition / age +2.5/5.0
- DSCR +2.2/10.0
$165,000
🖨 Deal sheet (PDF) 📄 Offer letter ✓ Due diligence
Listing remarks
Charming farmhouse offering 2 bedrooms and 2 bathrooms, plus an additional flex room ideal for a home office or third bedroom. This inviting home features wood floors, natural gas, and three mini-split systems providing efficient heating and cooling. Situated on a beautifully fenced . 57-acre double lot, the property includes multiple outbuildings, chicken coop, and a walk-out unfinished basement with approximately 900 sq. ft. of storage, with the remainder being crawl space. The oversized lot is a gardener’s dream, boasting mature pecan, fig, peach, and cherry trees, cold-hardy pomegranate trees, perennial herbs, St. Augustine Tuf grass, mulberries, lemongrass borders, hibiscus, azal
Key facts
- 0.57 acre lot
- Garage
- Pool
Property features AI
Finance
- HOA & community: No HOA fees
Exterior
- Parking: Detached carport (1 car); Gravel driveway
- Utilities: Public water; Electric water heater; Public sewer; Private garbage pickup
- Home design: Single-story with basement (1 + basement); Residential property (lead-based paint discovery required); Approximate age: 50+ years
- Construction: Hardboard siding exterior finish; Composition shingle roof; Basement foundation; Basement storage space
- Exterior features: Above-ground pool; Front porch; Sloped gently lot with some trees; Outbuilding storage
Interior
- Kitchen: Electric oven; Kitchen approx. 11 x 19
- Bedrooms: Three bedrooms on the main level; Primary bedroom on main level (approx. 16 x 14); Second bedroom approx. 16 x 18
- Flooring: Hardwood floors; Laminate flooring
- Bathrooms: Two full bathrooms (both on the main level)
- Heating & cooling: Electric heating; Natural gas heating; Multi-unit heating system; Electric cooling; Multi-unit cooling system
- Interior features: Other/see remarks interior features; Two fireplaces; Office/study
- Laundry & utility: First-floor laundry with walk-in area
Neighborhood map
What this means for you Summary
Snapshot
- This is a 2-bed/2.0-bath single-family listed at $165k.
Deal economics
- At list price, monthly cash flow is $-157 ($-2k/yr) — negative.
- To cash-flow at today's rent, offer at most $142k (13.7% below list).
- To meet the 1% rule (rent ≥ 1% of price), the offer needs to be $124k (24.5% below list).
- Recommended offer: $124k (24.5% below list) — sets the bar for 1% rule.
Location & tenants
- Location reads 66/100 on livability (#111 in SC) — a middle-class / working-renter tenant base. Strengths: cost of living A+, housing A+; Watch: health & safety C-, amenities F, commute F.
- Abbeville 60 (rural): math 50% / reading 49% proficiency, ranked #15 of 80 in SC (top 19%) — families likely to look elsewhere, expect single-tenant / working-renter base with shorter leases.
- Zoned schools: Long Cane Primary (335 students, 100% FRL); Wright Middle (math 37% / reading 39%, grade F, #86 of 229 statewide, top 39%, 346 students, 100% FRL); Abbeville High (math 77% / reading 77%, grade A-, #28 of 196 statewide, top 16%, 473 students, 74% FRL) — zoned schools average 91% FRL vs 57% district-wide (35 pts higher); higher-poverty schools than district average — tighter screening recommended.
- Market conditions: 110 active listings in the ZIP; 1 comparable units currently listed for rent nearby; 145 units permitted in Abbeville County in 2024 (0 in 5+ unit buildings).
Forward outlook
- In year one you build about $18k of equity ($1k loan paydown + $16k appreciation (10.0% local appreciation)).
- Abbeville County population projected at -17% by 2050 — secular population decline; favor cash flow + early exit over multi-decade hold.
- By year 3, paydown + projected appreciation supports a ~$45k cash-out refi (75% LTV) — recoverable capital for the next deal without selling this one.
Negotiation context
- It's been on market 136 days — a 12% lower offer ($145k) is reasonable based on typical stale-listing flexibility.
- 4 sale attempts since 11y ago with the ask held roughly flat each time — persistent listings suggest the price (not the market) is what's stuck; bring a comps-based counter.
- Current owner paid $40k; list at $165k implies a 312% gain — meaningful room to come down on a strong offer.
Risks & watch-outs
- Watch-outs: built in 1950 — expect roof / HVAC / electrical / plumbing capex.
- Climate carrying-cost: major wind risk, 27% chance of damaging wind over 30y; extreme-heat days projected 7→17/yr by 2055 (HVAC capex compounding) — expect insurance premiums to compound above CPI over the hold.
Questions for the listing agent
- What do current leases actually rent for vs. the listed asking? Can we see a recent rent roll and the last 12 months of T-12 income?
- It's been on market 136 days. Have you received any prior offers? Is the seller open to a 25% concession, seller financing, or rate buy-down credit?
- Built in 1950 — when were the roof, HVAC, electrical panel, plumbing, and water heater last replaced?
- Why hasn't it sold? Are there any deal-killer items the seller is aware of (foundation, flood, title, zoning, code violations)?
- Is there a deadline driving the sale (1031 exchange, divorce, estate, relocation)? That informs how much negotiation room exists.
- What's the average days-on-market for RENTAL listings here right now (not sales)? A rising rental-DOM trend means longer vacancies and softer asking-rent achievability than the comps imply.
- What's the recent tenant-quality profile in this submarket — average credit score on applications, eviction rate, late-payment / NSF rate, and stable-employment percentage? A property-management company in the area should have these aggregated.
- How much new for-sale + rental construction is in the pipeline within 1–3 miles? Heavy new supply typically softens prices + rents 12–24 months out; constrained supply supports both.
Investment metrics
- 1% rule
- 0.75% ✗
- Cap rate
- 5.15%
- Cash-on-cash
- -4.07%
- DSCR
- 0.82
- GRM
- 11.0
CMA / ARV
- ARV (on-the-fly)
- $201,938
- Comps found
- 6
Show comp detail 6 sales within ~0.75 mi
| Address | Dist | Beds/Ba | Sqft | Sold | Price | $/sf | Match |
|---|---|---|---|---|---|---|---|
| 100 Church St | 0.16mi | 3/2.5 (+1) | 1,655 (+12%) | 7mo | $190,500 | $115 | 60 |
| 1005 N Main St | 0.49mi | 3/1.0 (+1) | 1,500 (+2%) | 9mo | $205,000 | $137 | 57 |
| 107 Lee St | 0.51mi | 3/2.0 (+1) | 1,500 (+2%) | 13mo | $242,900 | $162 | 57 |
| 1003 N Main St | 0.48mi | 2/1.0 | 1,504 (+2%) | 20mo | $215,000 | $143 | 54 |
| 1200 N Main St | 0.67mi | 2/1.5 | 1,497 (+2%) | 20mo | $193,000 | $129 | 48 |
| 101 Pineview St | 0.68mi | 2/1.0 | 1,333 (-10%) | 13mo | $175,000 | $131 | 38 |
Match score weights: distance 35% · size 25% · config 20% · recency 20%. Top-matched comps best support the ARV.
Projected returns pro-forma
10.0% appreciation · 3.0% rent growth · sell at horizon
- IRR
- 21.4%
- Equity multiple
- 2.73×
- Total profit
- $79,900
- Equity at exit
- $148,645
- IRR
- 19.3%
- Equity multiple
- 6.26×
- Total profit
- $243,180
- Equity at exit
- $320,559
Cash invested: $46,200 (down + closing). Projections, not guarantees.
Landlord ↔ Tenant lean methodology
- Overall (STATE)
- 90 Strongly Landlord-Friendly
- State South Carolina
- 90 Strongly Landlord-Friendly · R+6
- County
- — inherits STATE
- City
- — inherits STATE
ZIP-level market 29620
- Home prices YoY
- 15.0%
- Active inventory
- 110
- Price-to-rent
- 11.0×
Monthly cashflow live
- Estimated rent
- $1,245 medium interval (Pro) →
- Mortgage (P&I)
- −$865
- Tax est. 1.5%
- −$206 /mo · $2,475/yr
- Insurance
- −$69
- HOA
- −$0
- Vacancy / Maint / Mgmt
- −$261
- Net cashflow
- $-157
Break-even live
Sensitivity live
| Price | -10% $-43 | -5% $-100 | +0% $-157 | +5% $-214 | +10% $-271 |
|---|---|---|---|---|---|
| Rent | -10% $-255 | -5% $-206 | +0% $-157 | +5% $-108 | +10% $-58 |
| Rate | -1.0pp $-74 | -0.5pp $-115 | base $-157 | +0.5pp $-199 | +1.0pp $-243 |
UW: 25.0% down · 7.5% · 30yr · 1.5% tax · 5.0% vac · 8.0% maint · 8.0% mgmt
Financing live
Cash to close
- Down payment
- $41,250
- Closing costs
- $4,950
- Reserves months
- —
- Total cash needed
- —
Loan-product check · same deal, 3 products live
Conventional
25% down · 7.5% · 30yr
- Down + closing
- —
- Monthly P&I
- —
- Monthly cashflow
- —
- DSCR
- —
- Eligible?
- —
Personal DTI + credit; lowest rate.
DSCR
20% down · 8.5% · 30yr
- Down + closing
- —
- Monthly P&I
- —
- Monthly cashflow
- —
- DSCR
- —
- Eligible?
- —
No personal income docs; deal must DSCR.
Hard money
10% down · 12.0% · 12mo
- Down + closing
- —
- Monthly P&I
- —
- Monthly cashflow
- —
- DSCR
- —
- Eligible?
- —
Short-term bridge; refi at stabilization.
Rent comps 1 comps
| Address | Beds | Baths | Sqft | Rent | $/sqft | DOM | Units | Dist |
|---|---|---|---|---|---|---|---|---|
| 605 Cherokee St Abbeville, SC | 2.0 | 1.0 | 1100 | $1,245 | $1.13 | 13d | 1 | 0.41mi |
Listing history 19 events
-
2026-06-09days on market $165,000 Active 136 DOM
-
2026-06-08days on market $165,000 Active 135 DOM
-
2026-06-07days on market $165,000 Active 134 DOM
-
2026-06-03days on market $165,000 Active 130 DOM
-
2026-06-03days on market $165,000 Active 129 DOM
-
2026-06-01days on market $165,000 Active 128 DOM
-
2026-05-31days on market $165,000 Active 127 DOM
-
2026-04-24price $165,000
-
2026-03-31price $167,000
-
2026-01-24$169,000 Active
-
2024-11-05historical
-
2024-09-13$165,000 Active
-
2022-07-24historical
-
2022-07-17price $125,000
-
2022-06-22$135,000 Active
-
2020-02-25soldstatus $40,000
-
2016-08-10soldstatus $20,000
-
2016-08-09soldstatus $20,000
-
2015-12-11$29,900
ⓘ Source: listings_history table (triggers on properties + properties_extension) + one-shot
backfill from property_details.listing_events for pre-trigger history.
Climate risk First Street
- Flood 4/10 Moderate FEMA zone X (unshaded) · 22% chance over 30 yrs
- Wildfire 4/10 Moderate
- Heat 6/10 Major 7 d/yr ≥106°F today · 17 d/yr by 30 yrs out
- Wind 6/10 Major 27% chance of damaging wind over 30 yrs
- Air quality 2/10 Low 2 unhealthy d/yr today · 2 by 30 yrs out
Nearby sold comps map
Loading sold comps map…
Walkable amenities ~0.75 mi
Loading nearby amenities…
Taxation est. · year 1
- Rental income
- $14,940
- − Mortgage interest
- −$9,243
- − Property taxes
- −$2,475
- − Insurance
- −$825
- − Repairs & maintenance
- −$1,195
- − Management
- −$1,195
- − Depreciation
- −$4,800
- Taxable loss
- −$4,793
- Est. tax savings @ 24.0%
- +$1,150
- After-tax cash flow
- $-730/yr
For passive investors: Depreciation is non-cash, so a rental often shows a tax loss while cash-flowing — sheltering income. Rental losses are passive: they offset passive income freely, and up to $25,000/yr can offset ordinary (W-2) income if you actively participate and your MAGI is under $100k (phasing out to $0 by $150k); unused losses carry forward. On sale, claimed depreciation is recaptured at up to 25%, and gains may owe capital-gains tax (a 1031 exchange can defer both). Figures are a year-1 estimate at your 24.0% rate — not tax advice; consult a CPA.
Schools (NCES district)
- District
- Abbeville 60
- NCES district ID
- 4500690
- Math proficiency
- 50% ▼ -12.00%
- Reading proficiency
- 49% ▼ -7.00%
- Median HH income
- $34,522
- Composite
- 40.9/100
- National rank
- #3618
- State rank
- #15 of 80 in SC
Livability — Abbeville
- Score
- 66/100
- State rank
- #111
- US rank
- #11534
Category grades
Schools grade is shown separately in the Schools card above.
Census & demographics
- Census place
- Abbeville, SC
- Population (ZIP)
- 12,116
Population outlook (Abbeville County) Hauer SSP2
- Today (2025)
- 24,141 people
- By 2030
- 23,446 · -2.9%
- By 2040
- 21,768 · -9.8%
- By 2050
- 20,098 · -16.7%
- By 2075
- 16,518 · -31.6%
- By 2100
- 13,125 · -45.6%
Race, ethnicity, and origin ACS 2023
- Neighborhood character
- Predominantly White (65%)
- Race & ethnicity
- White 65% Black 30% Two or more races 4% Hispanic / Latino 2%
- Common ancestry
- Italian 2% Serbian 2% Slovak 2%
- Foreign-born
- 2% · Canada, Jamaica
- Languages at home
- 98% English-only · Spanish 2%
Political lean MEDSL · Abbeville
- 2024 margin
- Solid R (+42.4) · D 28.2% · R 70.6% · Other 1.2%
- 2008→2024 swing
- -27.2pp toward R · 2008: -15.2pp · 2024: -42.4pp
- All cycles
- 2024: R+42.4 2020: R+33.1 2016: R+28.3 2012: R+13.4 2008: R+15.2
Not yet ingested
- Civics
- —
Market trends
- HPI YoY
- ▲ 49.52%
- Current HPI
- 379.552
- Rent YoY
- —
- Metro
- —
- State GDP YoY
- ▲ 4.51%
- F500 in state
- 2
Industry mix (Fortune 500 HQ in SC)
| Industry | F500 HQs | Revenue |
|---|---|---|
| Packaging | 1 | $7B |
|
||
Price history
+451.8% since first listed12 events — show timeline
- 2026-04-24 Price Changed $165,000 Greater Greenville MLS
- 2026-03-31 Price Changed $167,000 Greater Greenville MLS
- 2026-01-24 Listed $169,000 Greater Greenville MLS
- 2024-11-05 Listing Removed — Greater Greenville MLS
- 2024-09-13 Listed $165,000 Greater Greenville MLS
- 2022-07-24 Listing Removed — WUMLS
- 2022-07-17 Price Changed $125,000 WUMLS
- 2022-06-22 Listed $135,000 WUMLS
- 2020-02-25 Sold (Public Records) $40,000 Public Records
- 2016-08-10 Sold (Public Records) $20,000 Public Records
- 2016-08-09 Sold (MLS) $20,000 GAOR
- 2015-12-11 Listed $29,900 GAOR
Property tax history
+3.1%/yrLatest (2025): $144 · +1.4% YoY. Source: county tax records.
Cash-flow waterfall
monthlySold comps — $/sqft
last 12 mo · ≤1 miLoading sold comps…