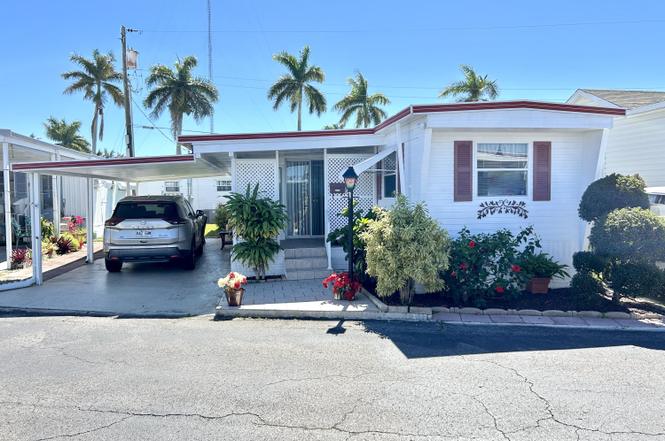
3332 Broadway St · Hollywood, FL
Flood risk 3/10 · Minor
- FEMA flood zone
- X (unshaded)
- Chance of flooding over 30 yrs
- 0.12%
- Est. flood insurance / yr
- $507 – $1,088
Fire risk 1/10 · Minimal
- Est. fire insurance / yr
- $947 – $1,759
Heat risk 10/10 · Severe
- Hot days now (above 105°F)
- 5 days/yr
- Hot days in 30 yrs
- 19 days/yr
Wind risk 10/10 · Severe
- Chance of severe wind over 30 yrs
- 99.0%
Air-quality risk 2/10 · Minimal
- Unhealthy air days now
- 2 days/yr
- Unhealthy air days in 30 yrs
- 2 days/yr
Risk factors via First Street. Map © Google.
Why this score? — see what drove the B grade
The composite is a weighted blend of 9 inputs, each scored 0–100. Each bar is that input's sub-score; the figure is the points it added to the 100-point composite (weight × sub-score).
- Cash flow +30.0/30.0
- 1% rule +10.0/10.0
- DSCR +10.0/10.0
- ARV discount +7.5/15.0
- Schools +4.1/10.0
- Livability +3.8/5.0
- Rent growth +3.1/5.0
- Condition / age +2.5/5.0
- Appreciation +0.0/10.0
$57,000
🖨 Deal sheet 📄 Offer letter ✓ Due diligence
Listing remarks
Charming two-bedroom, 1.5-bathroom home located in the desirable Orangebrook Harbor community. This property offers a spacious and peaceful living environment, with access to a community pool and a beautifully maintained setting. The home features one covered parking space, an enclosed Florida room seamlessly integrated into the main living area, and an in-unit washer and dryer for added convenience. Situated on a very quiet street, it provides privacy and tranquility. The kitchen is well-appointed and fully equipped with everything you need, making it both functional and inviting. A wonderful opportunity to enjoy comfortable living in a serene community setting.
Key facts
- Quiet street
- Community pool
- 2 parking spots
Tags
Property features AI
Finance
- Financial info: Property is resale
- HOA & community: Located in a senior community; Land lease of $1,350 monthly (lease expires 2027-03-01)
Exterior
- Parking: Attached carport; Carport with 1 covered space and 1 open space
- Utilities: Public water; Public sewer; Sewer and water available
- Home design: Mobile home; Single-story
- Construction: Modular construction
- Exterior features: Porch
Interior
- Kitchen: Electric range; Microwave; Refrigerator
- Bedrooms: 2 bedrooms on the main level
- Bathrooms: 1 full bathroom; 1 half bathroom
- Heating & cooling: Central heating; Central air conditioning
- Interior features: No notable interior features listed; Furnished
- Laundry & utility: Laundry area inside
Neighborhood map
What this means for you Summary
Snapshot
- This is a 2-bed/1.5-bath manufactured listed at $57k.
Deal economics
- At list price, monthly cash flow is $1k ($12k/yr) — positive.
- The deal already cash-flows at list — no discount required.
- Meets the 1% rule at list price ($2k rent vs $57k).
- Recommended offer: $52k (9.0% below list) — sets the bar for market timing.
- Cap rate 28.2% vs local median 3.2% in Hollywood — top-decile yield for the area; either an underpriced asset or a hidden risk that comps aren't pricing in. Stress-test before assuming the spread holds.
Location & tenants
- Location reads 76/100 on livability (#232 in FL, #3,548 nationally) — a middle-class / working-renter tenant base. Strengths: commute A+, housing A+, crime B+; Watch: amenities D.
- Broward (suburban): math 42% / reading 53% proficiency, ranked #46 of 73 in FL (top 63%) — families likely to look elsewhere, expect single-tenant / working-renter base with shorter leases.
- Zoned schools: Colbert Elementary School (math 35% / reading 29%, grade F, #1,797 of 2,144 statewide, top 86%, 611 students, 82% FRL); Hallandale High School (math 10% / reading 24%, grade F, #597 of 667 statewide, top 90%, 1,104 students, 70% FRL) — zoned schools average 76% FRL vs 51% district-wide (25 pts higher); higher-poverty schools than district average — tighter screening recommended.
- Zoned-school proficiency averages 24% at this address vs 48% district-wide (-23 pts) — the specific schools serving this property underperform the Broward average; the district grade overstates school quality for this exact location.
- Market conditions: Rents rising (+2.4%/yr); 529 active listings in the ZIP; 39 comparable units currently listed for rent nearby; rentals at typical pace (median 21d on market — plan ~3-4 weeks tenant-placement turnaround); 2,111 units permitted in Broward County in 2024 (1,265 in 5+ unit buildings).
- This rent runs 31% of the median local income ($71k/yr) — at the standard rent-burdened threshold; future hikes will face affordability resistance.
Forward outlook
- Local home prices are declining (-3.0%/yr); year-one equity from $394 of loan paydown is wiped out by about $2k of value loss. Plan a longer hold.
- Broward County population projected at +34% by 2050 — long-run rental-demand tailwind backs the buy-and-hold thesis.
- At projected returns (-3.0% appreciation + 2.4% rent growth), your $16k cash investment doubles in ~2 years — after that, you're playing with house money.
Negotiation context
- It's been on market 115 days — a 9% lower offer ($52k) is reasonable based on typical stale-listing flexibility.
Risks & watch-outs
- Climate carrying-cost: severe wind risk, 99% chance of damaging wind over 30y; extreme-heat days projected 5→19/yr by 2055 (HVAC capex compounding) — expect insurance premiums to compound above CPI over the hold.
Questions for the listing agent
- It's been on market 115 days. Have you received any prior offers? Is the seller open to a 9% concession, seller financing, or rate buy-down credit?
- Built in 1962 — when were the roof, HVAC, electrical panel, plumbing, and water heater last replaced?
- Why hasn't it sold? Are there any deal-killer items the seller is aware of (foundation, flood, title, zoning, code violations)?
- Is there a deadline driving the sale (1031 exchange, divorce, estate, relocation)? That informs how much negotiation room exists.
- What's the average days-on-market for RENTAL listings here right now (not sales)? A rising rental-DOM trend means longer vacancies and softer asking-rent achievability than the comps imply.
- What's the recent tenant-quality profile in this submarket — average credit score on applications, eviction rate, late-payment / NSF rate, and stable-employment percentage? A property-management company in the area should have these aggregated.
- How much new for-sale + rental construction is in the pipeline within 1–3 miles? Heavy new supply typically softens prices + rents 12–24 months out; constrained supply supports both.
Investment metrics
- 1% rule
- 3.19% ✓
- Cap rate
- 28.21%
- Cash-on-cash
- 78.28%
- DSCR
- 4.48
- GRM
- 2.6
CMA / ARV
No comps found within radius.
Projected returns pro-forma
-3.0% appreciation · 2.41% rent growth · sell at horizon
- IRR
- 77.7%
- Equity multiple
- 4.51×
- Total profit
- $56,029
- Equity at exit
- $8,499
- IRR
- 81.1%
- Equity multiple
- 9.14×
- Total profit
- $129,939
- Equity at exit
- $4,928
Cash invested: $15,960 (down + closing). Projections, not guarantees.
Landlord ↔ Tenant lean methodology
- Overall (STATE)
- 87 Strongly Landlord-Friendly
- State Florida
- 87 Strongly Landlord-Friendly · R+3
- County
- — inherits STATE
- City
- — inherits STATE
ZIP-level market 33021
- Rents YoY
- 2.4%
- Active inventory
- 529
- Price-to-rent
- 2.6×
Monthly cashflow live
- Estimated rent
- $1,817 high interval (Pro) →
- Mortgage (P&I)
- −$299
- Tax est. 1.5%
- −$71 /mo · $855/yr
- Insurance
- −$24
- HOA
- −$0
- Vacancy / Maint / Mgmt
- −$381
- Net cashflow
- $1,041
Break-even live
UW: 25.0% down · 7.5% · 30yr · 1.5% tax · 5.0% vac · 8.0% maint · 8.0% mgmt
Financing live
Cash to close
- Down payment
- $14,250
- Closing costs
- $1,710
- Reserves months
- —
- Total cash needed
- —
Loan-product check · same deal, 3 products live
Conventional
25% down · 7.5% · 30yr
- Down + closing
- —
- Monthly P&I
- —
- Monthly cashflow
- —
- DSCR
- —
- Eligible?
- —
Personal DTI + credit; lowest rate.
DSCR
20% down · 8.5% · 30yr
- Down + closing
- —
- Monthly P&I
- —
- Monthly cashflow
- —
- DSCR
- —
- Eligible?
- —
No personal income docs; deal must DSCR.
Hard money
10% down · 12.0% · 12mo
- Down + closing
- —
- Monthly P&I
- —
- Monthly cashflow
- —
- DSCR
- —
- Eligible?
- —
Short-term bridge; refi at stabilization.
Rent comps 39 comps
| Address | Beds | Baths | Sqft | Rent | $/sqft | DOM | Units | Dist |
|---|---|---|---|---|---|---|---|---|
| 812 S Park Rd Hollywood, FL | 1.0–3.0 | 1.0–2.0 | 999 | $2,424 | $2.43 | 1d | 24 | 0.52mi |
| 4130 SW 19th St Unit 3 West Park, FL | 1.0 | 1.0 | 450 | $1,400 | $3.11 | 20d | 1 | 0.61mi |
| 550 S Park Rd Unit 14-8 Hollywood, FL | 1.0 | 1.0 | 650 | $1,750 | $2.69 | 7d | 1 | 0.65mi |
| 2915 Plunkett St Unit 10D Hollywood, FL | 1.0 | 1.0 | 640 | $1,700 | $2.66 | 16d | 1 | 0.66mi |
| 1046 Foster Rd Hallandale Beach, FL | 2.0 | 1.0 | 750 | $1,795 | $2.39 | 7d | 1 | 0.72mi |
| 470 S Park Rd Unit 7-110 Hollywood, FL | 1.0 | 1.0 | 659 | $1,800 | $2.73 | 24d | 1 | 0.73mi |
| 1041 NW 7th Ct Unit 2 Hallandale Beach, FL | 1.0 | 1.0 | 600 | $1,550 | $2.58 | 24d | 1 | 0.77mi |
| 900 Tallwood Ave #207 Hollywood, FL | 1.0 | 1.0 | 640 | $1,575 | $2.46 | 20d | 1 | 0.81mi |
| 3601 Van Buren St Hollywood, FL | 1.0–2.0 | 1.0–2.0 | 941 | $2,195 | $2.33 | 3d | 3 | 0.87mi |
| 3711 Van Buren St #2 Hollywood, FL | 1.0 | 1.0 | 660 | $1,550 | $2.35 | 24d | 1 | 0.89mi |
| 840 NW 10th St Unit 8 Hallandale Beach, FL | 1.0 | 1.0 | 441 | $1,400 | $3.17 | 24d | 1 | 0.96mi |
| 2918 Jackson St Unit 1 Hollywood, FL | 2.0 | 1.0 | 750 | $1,700 | $2.27 | 7d | 1 | 0.99mi |
| 2918 Jackson St Hollywood, FL | 2.0 | 1.0 | 750 | $1,700 | $2.27 | 3d | 1 | 0.99mi |
| 2915 Jackson St Unit 12 Hollywood, FL | 1.0 | 1.0 | 500 | $1,425 | $2.85 | 15d | 1 | 1.02mi |
| 2915 Jackson St Hollywood, FL | 1.0 | 1.0 | 500 | $1,425 | $2.85 | 13d | 1 | 1.02mi |
| 3525 Polk St #7 Hollywood, FL | 1.0 | 1.0 | 700 | $1,600 | $2.29 | 24d | 1 | 1.11mi |
| 4917 Washington St Hollywood, FL | 1.0 | 1.0 | 600 | $1,300 | $2.17 | 7d | 1 | 1.12mi |
| 2630 Madison St Hollywood, FL | 1.0 | 1.0 | 400 | $1,500 | $3.75 | 24d | 1 | 1.16mi |
| 2630 Madison St Unit b Hollywood, FL | 1.0 | 1.0 | 400 | $1,500 | $3.75 | 24d | 1 | 1.16mi |
| 230 SW 11th Ave #17 Hallandale Beach, FL | 1.0 | 1.0 | 580 | $1,390 | $2.40 | 3d | 1 | 1.23mi |
| 280 SW 11th Ave #5 Hallandale Beach, FL | 1.0 | 1.0 | 580 | $1,475 | $2.54 | 24d | 1 | 1.26mi |
| 2840 Taylor St #28 Hollywood, FL | 1.0 | 1.0 | 560 | $1,800 | $3.21 | 24d | 1 | 1.31mi |
| 340 SW 11th Ave Unit 2A Hallandale Beach, FL | 1.0 | 1.0 | 466 | $1,575 | $3.38 | 10d | 1 | 1.33mi |
| 220 SW 9th Ave Hallandale Beach, FL | 1.0–2.0 | 1.0–2.0 | 771 | $2,200 | $2.85 | 20d | 2 | 1.33mi |
| 220 SW 9th Ave #219 Hallandale Beach, FL | 1.0 | 1.0 | 625 | $1,550 | $2.48 | 4d | 1 | 1.34mi |
| 5401 SW 20th St Unit B West Park, FL | 1.0 | 1.0 | 600 | $1,500 | $2.50 | 24d | 1 | 1.34mi |
| 2806 Taylor St Apt C Hollywood, FL | 2.0 | 2.0 | 650 | $2,295 | $3.53 | 24d | 1 | 1.36mi |
| 2806 Taylor St Apt C Hollywood, FL | 2.0 | 2.0 | 650 | $2,295 | $3.53 | 7d | 1 | 1.36mi |
| 820 SW 1st Pl Hallandale Beach, FL | 2.0 | 1.0 | 430 | $1,675 | $3.90 | 24d | 1 | 1.37mi |
| 2847 Fillmore St Hollywood, FL | 1.0 | 1.0 | 700 | $1,600 | $2.29 | 2d | 1 | 1.39mi |
| 2830 Fillmore St Unit 5 Hollywood, FL | 1.0 | 1.0 | 700 | $1,450 | $2.07 | 24d | 1 | 1.39mi |
| 2830 Fillmore St Unit 2 Hollywood, FL | 1.0 | 1.0 | 750 | $1,450 | $1.93 | 7d | 1 | 1.39mi |
| 2843 Fillmore St Hollywood, FL | 1.0–2.0 | 1.0 | 800 | $2,095 | $2.62 | 24d | 1 | 1.40mi |
| 2910 Pierce St Unit P102 Hollywood, FL | 1.0 | 1.0 | 700 | $1,595 | $2.28 | 24d | 1 | 1.41mi |
| 5500 Washington St Hollywood, FL | 1.0–3.0 | 1.0–2.0 | 1000 | $2,095 | $2.10 | 3d | 18 | 1.43mi |
| 4933 Hollywood Blvd Unit 5141-206 Hollywood, FL | 1.0 | 1.0 | 650 | $1,750 | $2.69 | 24d | 1 | 1.43mi |
| 4933 Hollywood Blvd Unit 5420-202 Hollywood, FL | 1.0 | 1.0 | 650 | $1,750 | $2.69 | 21d | 1 | 1.43mi |
| 5112 Hollywood Blvd Hollywood, FL | 1.0–2.0 | 1.0 | 727 | $2,000 | $2.75 | 18d | 2 | 1.49mi |
| 5112 Hollywood Blvd #3 Hollywood, FL | 1.0 | 1.0 | 650 | $1,550 | $2.38 | 16d | 1 | 1.49mi |
Listing history 13 events
-
2026-06-18days on market $57,000 Active 115 DOM
-
2026-06-17days on market $57,000 Active 114 DOM
-
2026-06-16days on market $57,000 Active 113 DOM
-
2026-06-15days on market $57,000 Active 112 DOM
-
2026-06-13days on market $57,000 Active 110 DOM
-
2026-06-09days on market $57,000 Active 106 DOM
-
2026-06-07days on market $57,000 Active 104 DOM
-
2026-06-04days on market $57,000 Active 101 DOM
-
2026-06-03days on market $57,000 Active 100 DOM
-
2026-06-02days on market $57,000 Active 99 DOM
-
2026-06-01days on market $57,000 Active 98 DOM
-
2026-05-31days on market $57,000 Active 97 DOM
-
2026-02-23$57,000 Active
ⓘ Source: listings_history table (triggers on properties + properties_extension) + one-shot
backfill from property_details.listing_events for pre-trigger history.
Climate risk First Street
- Flood 3/10 Moderate FEMA zone X (unshaded) · 12% chance over 30 yrs
- Wildfire 1/10 Low
- Heat 10/10 Extreme 5 d/yr ≥105°F today · 19 d/yr by 30 yrs out
- Wind 10/10 Extreme 99% chance of damaging wind over 30 yrs
- Air quality 2/10 Low 2 unhealthy d/yr today · 2 by 30 yrs out
Nearby sold comps map
Loading sold comps map…
Walkable amenities ~0.75 mi
Loading nearby amenities…
Taxation est. · year 1
- Rental income
- $21,798
- − Mortgage interest
- −$3,193
- − Property taxes
- −$855
- − Insurance
- −$285
- − Repairs & maintenance
- −$1,744
- − Management
- −$1,744
- − Depreciation
- −$1,658
- Taxable income
- $12,319
- Est. tax owed @ 24.0%
- −$2,957
- After-tax cash flow
- $9,537/yr
For passive investors: Depreciation is non-cash, so a rental often shows a tax loss while cash-flowing — sheltering income. Rental losses are passive: they offset passive income freely, and up to $25,000/yr can offset ordinary (W-2) income if you actively participate and your MAGI is under $100k (phasing out to $0 by $150k); unused losses carry forward. On sale, claimed depreciation is recaptured at up to 25%, and gains may owe capital-gains tax (a 1031 exchange can defer both). Figures are a year-1 estimate at your 24.0% rate — not tax advice; consult a CPA.
Schools (NCES district)
- District
- Broward
- NCES district ID
- 1200180
- Math proficiency
- 42% ▼ -18.00%
- Reading proficiency
- 53% ▼ -5.00%
- Median HH income
- $52,139
- Composite
- 40.88/100
- National rank
- #3621
- State rank
- #46 of 73 in FL
Livability — Hollywood
- Score
- 76/100
- State rank
- #232
- US rank
- #3548
Category grades
Schools grade is shown separately in the Schools card above.
Census & demographics
- Census place
- Hollywood, FL
- County
- Broward County · 1,963,430 people
- City population
- 109,079
- Metro
- Miami-Fort Lauderdale-Pompano Beach, FL
- Population (ZIP)
- 48,464
- Household income
- $71,318
- Rent vs Own
- Severe rent burden
- 2151.0
Population outlook (Broward County) Hauer SSP2
- Today (2025)
- 2,207,033 people
- By 2030
- 2,360,704 · +7.0%
- By 2040
- 2,661,208 · +20.6%
- By 2050
- 2,946,698 · +33.5%
- By 2075
- 3,602,273 · +63.2%
- By 2100
- 3,970,984 · +79.9%
Race, ethnicity, and origin ACS 2023
- Neighborhood character
- Diverse neighborhood (Simpson 0.65)
- Race & ethnicity
- White 45% Hispanic / Latino 37% Two or more races 17% Black 13% Asian 3%
- Hispanic origin (detail)
- Puerto Rican 5% Cuban 10% Dominican 2%
- Common ancestry
- Romanian 3% Scotch-Irish 2% Hispanic 2%
- Foreign-born
- 35% · Canada, Jamaica, Dominican Republic
- Languages at home
- 53% English-only · Spanish 33% French/Haitian/Cajun 4% Russian/Polish/Slavic 2%
Political lean MEDSL · Broward
- 2024 margin
- D (+17.0) · D 58.0% · R 41.0%
- 2008→2024 swing
- -17.8pp toward R · 2008: 34.7pp · 2024: 17.0pp
- All cycles
- 2024: D+17.0 2020: D+29.8 2016: D+35.0 2012: D+34.9 2008: D+34.7
Not yet ingested
- Civics
- —
Market trends
- HPI YoY
- ▼ -404.28%
- Current HPI
- 429.7129
- Rent YoY
- ▲ 2.41%
- Metro
- Miami-Fort Lauderdale-Pompano Beach, FL
- State GDP YoY
- ▲ 3.28%
- F500 in state
- 36
Industry mix (Fortune 500 HQ in FL)
| Industry | F500 HQs | Revenue |
|---|---|---|
| Industrial Technology | 2 | $29B |
|
||
| Insurance | 2 | $17B |
|
||
| Retail | 1 | $60B |
|
||
| Technology Distribution | 1 | $58B |
|
||
| Homebuilding | 1 | $35B |
|
||
| Technology Manufacturing | 1 | $35B |
|
||
Price history
1 event — show timeline
- 2026-02-23 Listed $57,000 Beaches MLS
Cash-flow waterfall
monthlySold comps — $/sqft
last 12 mo · ≤1 miLoading sold comps…