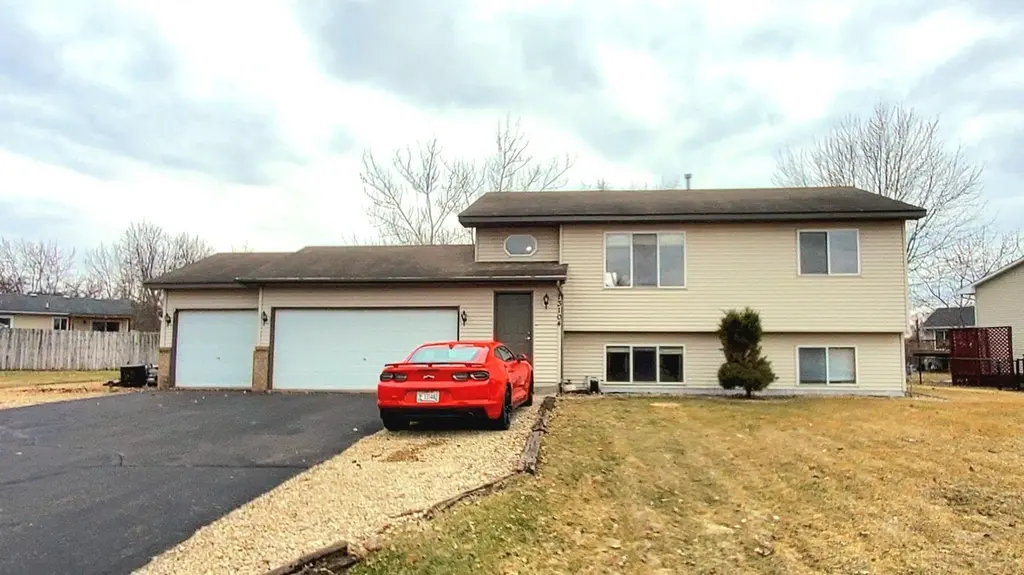
13104 192 1/2 Ct NW · Elk River, MN
Flood risk 1/10 · Minimal
- FEMA flood zone
- X (unshaded)
- Chance of flooding over 30 yrs
- 0.0%
- Est. flood insurance / yr
- $473 – $860
Fire risk 3/10 · Minor
- Est. fire insurance / yr
- $888 – $1,650
Heat risk 2/10 · Minimal
- Hot days now (above 98°F)
- 7 days/yr
- Hot days in 30 yrs
- 14 days/yr
Wind risk 2/10 · Minimal
- Chance of severe wind over 30 yrs
- —
Air-quality risk 2/10 · Minimal
- Unhealthy air days now
- 2 days/yr
- Unhealthy air days in 30 yrs
- 2 days/yr
Risk factors via First Street. Map © Google.
Why this score? — see what drove the F grade
The composite is a weighted blend of 9 inputs, each scored 0–100. Each bar is that input's sub-score; the figure is the points it added to the 100-point composite (weight × sub-score).
- ARV discount +7.5/15.0
- Cash flow +6.1/30.0
- Schools +5.2/10.0
- Livability +3.6/5.0
- Rent growth +2.5/5.0
- Condition / age +2.5/5.0
- 1% rule +1.1/10.0
- DSCR +0.4/10.0
- Appreciation +0.0/10.0
$295,000
🖨 Deal sheet (PDF) 📄 Offer letter ✓ Due diligence
Listing remarks
Great opportunity to build some quick equity here! This split level home is situated on a great cul-de-sac. It has a nicely sized yard that is partially fenced. Large two tiered deck. 12x14 storage shed is on concrete slab. Extra parking spaces along the side of the garage. The heated garage is perfect for working on vehicles, and having a workshop space. Lower level has great versatility. Restore the closet for a 4th bedroom, or could easily convert that space to a kitchen area for the perfect mother-in-law setup. Very close to 4 parks and Orono Lake and less than 10 min from downtown Elk River. If your handy, this one is definitely worth checking out.
Key facts
- 0.37 acre lot
- 3 garage spots
- Built 1995
Property features AI
Exterior
- Parking: Attached heated and insulated garage with garage door opener; 3-car garage (approx. 28x20)
- Utilities: City water connected; City sewer connected; Natural gas; Circuit breaker electric
- Home design: Residential split-entry (bi-level) home; Pitched asphalt roof (over 8 years old); Main entry at upper level; No fractional ownership
- Construction: Block foundation; Block basement (full, with egress windows)
- Exterior features: Vinyl exterior; Deck; Partial fencing; Storage shed; Light tree coverage; Irregular lot
Interior
- Kitchen: Range; Dishwasher; Refrigerator
- Bedrooms: 4 bedrooms (upper and lower levels; includes a lower-level bedroom and multiple upper-level bedrooms)
- Bathrooms: 2 full bathrooms (one on main floor and one in full basement)
- Heating & cooling: Forced air heating; Central air conditioning
- Interior features: Egress windows in basement; Informal dining area / kitchen-dining combination
- Laundry & utility: Washer and Dryer (laundry on lower level)
Neighborhood map
What this means for you Summary
Snapshot
- This is a 2-bed/1.0-bath single-family listed at $295k.
Deal economics
- At list price, monthly cash flow is $-549 ($-7k/yr) — negative.
- To cash-flow at today's rent, offer at most $198k (32.9% below list).
- To meet the 1% rule (rent ≥ 1% of price), the offer needs to be $181k (38.5% below list).
- Recommended offer: $181k (38.5% below list) — sets the bar for 1% rule.
- Cap rate 4.1% vs local median 3.3% in Elk River — meaningfully above typical; check what's discounted (condition, days-on-market, listing class) to confirm the premium yield is real.
Location & tenants
- Location reads 72/100 on livability (#265 in MN) — a middle-class / working-renter tenant base. Strengths: crime A+, employment A+, housing A+; Watch: amenities F, commute F, health & safety F.
- Independent School District 728 (suburban): math 56% / reading 60% proficiency, ranked #37 of 301 in MN (top 12%) — acceptable for families but not a draw, mixed tenant base, ~2y average lease; only 14% free/reduced lunch — higher-income household profile.
- Zoned schools: Meadowvale Elementary (math 62% / reading 70%, grade B+, #118 of 857 statewide, top 14%, 542 students, 17% FRL); Vandenberge Middle School (math 36% / reading 47%, grade F, #138 of 258 statewide, top 55%, 512 students, 27% FRL); Elk River Senior High (math 60% / reading 57%, grade C, #56 of 471 statewide, top 12%, 1,637 students, 22% FRL).
- Market conditions: 457 active listings in the ZIP; 2 comparable units currently listed for rent nearby; high-income renter base; 334 units permitted in Sherburne County in 2024 (58 in 5+ unit buildings).
Forward outlook
- Local home prices are declining (-3.0%/yr); year-one equity from $2k of loan paydown is wiped out by about $9k of value loss. Plan a longer hold.
Negotiation context
- It's been on market 37 days — a 3% lower offer ($286k) is reasonable based on typical stale-listing flexibility.
- 2 sale attempts since 31y ago; this cycle's ask has dropped $55k (16%) from the opening price — seller is motivated, your offer sets the floor, not the list.
- Current owner paid $93k; list at $295k implies a 216% gain — meaningful room to come down on a strong offer.
Questions for the listing agent
- What do current leases actually rent for vs. the listed asking? Can we see a recent rent roll and the last 12 months of T-12 income?
- It's been on market 37 days. Have you received any prior offers? Is the seller open to a 39% concession, seller financing, or rate buy-down credit?
- Is there a deadline driving the sale (1031 exchange, divorce, estate, relocation)? That informs how much negotiation room exists.
- Schools are A-rated — typically a magnet for longer-tenancy family renters. What's the average tenant stay here, and is there a school-zone premium baked into asking?
- The area grade is low — what's the realistic commute time and amenity access for the typical tenant pool here? Any planned neighborhood developments (good or bad) we should know about?
- What's the average days-on-market for RENTAL listings here right now (not sales)? A rising rental-DOM trend means longer vacancies and softer asking-rent achievability than the comps imply.
- What's the recent tenant-quality profile in this submarket — average credit score on applications, eviction rate, late-payment / NSF rate, and stable-employment percentage? A property-management company in the area should have these aggregated.
- How much new for-sale + rental construction is in the pipeline within 1–3 miles? Heavy new supply typically softens prices + rents 12–24 months out; constrained supply supports both.
Investment metrics
- 1% rule
- 0.61% ✗
- Cap rate
- 4.06%
- Cash-on-cash
- -7.98%
- DSCR
- 0.64
- GRM
- 13.6
CMA / ARV
No comps found within radius.
Projected returns pro-forma
-3.0% appreciation · 3.0% rent growth · sell at horizon
- IRR
- -30.3%
- Equity multiple
- -0.00×
- Total profit
- $-82,805
- Equity at exit
- $43,985
- IRR
- -32.2%
- Equity multiple
- -0.42×
- Total profit
- $-117,198
- Equity at exit
- $25,506
Cash invested: $82,600 (down + closing). Projections, not guarantees.
Landlord ↔ Tenant lean methodology
- Overall (STATE)
- 46 Balanced
- State Minnesota
- 46 Balanced · D+2
- County
- — inherits STATE
- City
- — inherits STATE
ZIP-level market 55330
- Active inventory
- 457
- Price-to-rent
- 13.6×
Monthly cashflow live
- Estimated rent
- $1,813 medium interval (Pro) →
- Mortgage (P&I)
- −$1,547
- Tax from tax record
- −$312 /mo · $3,740/yr
- Insurance
- −$123
- HOA
- −$0
- Vacancy / Maint / Mgmt
- −$381
- Net cashflow
- $-549
Break-even live
Sensitivity live
| Price | -10% $-382 | -5% $-466 | +0% $-549 | +5% $-633 | +10% $-716 |
|---|---|---|---|---|---|
| Rent | -10% $-693 | -5% $-621 | +0% $-549 | +5% $-478 | +10% $-406 |
| Rate | -1.0pp $-401 | -0.5pp $-474 | base $-549 | +0.5pp $-626 | +1.0pp $-704 |
UW: 25.0% down · 7.5% · 30yr · 1.5% tax · 5.0% vac · 8.0% maint · 8.0% mgmt
Financing live
Cash to close
- Down payment
- $73,750
- Closing costs
- $8,850
- Reserves months
- —
- Total cash needed
- —
Loan-product check · same deal, 3 products live
Conventional
25% down · 7.5% · 30yr
- Down + closing
- —
- Monthly P&I
- —
- Monthly cashflow
- —
- DSCR
- —
- Eligible?
- —
Personal DTI + credit; lowest rate.
DSCR
20% down · 8.5% · 30yr
- Down + closing
- —
- Monthly P&I
- —
- Monthly cashflow
- —
- DSCR
- —
- Eligible?
- —
No personal income docs; deal must DSCR.
Hard money
10% down · 12.0% · 12mo
- Down + closing
- —
- Monthly P&I
- —
- Monthly cashflow
- —
- DSCR
- —
- Eligible?
- —
Short-term bridge; refi at stabilization.
Rent comps 2 comps
| Address | Beds | Baths | Sqft | Rent | $/sqft | DOM | Units | Dist |
|---|---|---|---|---|---|---|---|---|
| 1227 School St NW Elk River, MN | 2.0–3.0 | 1.0–2.0 | 1001 | $1,425 | $1.42 | 4d | 1 | 1.24mi |
| 1105 Lions Park Dr NW Elk River, MN | 3.0 | 2.0 | 1160 | $1,750 | $1.51 | 0d | 1 | 1.42mi |
Listing history 9 events
-
2026-05-21status Pending
-
2026-05-01historical Contingent - Subject to Financing
-
2026-04-29price $295,000
-
2026-04-14price $335,000
-
2026-04-14$350,000 Active
-
1995-12-29soldstatus $93,350
-
1995-12-15soldstatus $93,350
-
1995-10-31$93,350
-
1995-10-31historical
ⓘ Source: listings_history table (triggers on properties + properties_extension) + one-shot
backfill from property_details.listing_events for pre-trigger history.
Tax reassessment forecast MN · Partial reset (capped growth)
- Current annual tax
- $3,740 · $312/mo
- Projected year-2 tax
- $3,740 · $312/mo
- Expected delta
- $0/yr ($0/mo · 0.0%)
ⓘ Screening estimate from a state-policy table — verify with the county assessor before closing.
Climate risk First Street
- Flood 1/10 Low FEMA zone X (unshaded) · 0% chance over 30 yrs
- Wildfire 3/10 Moderate
- Heat 2/10 Low 7 d/yr ≥98°F today · 14 d/yr by 30 yrs out
- Wind 2/10 Low
- Air quality 2/10 Low 2 unhealthy d/yr today · 2 by 30 yrs out
Nearby sold comps map
Loading sold comps map…
Walkable amenities ~0.75 mi
Loading nearby amenities…
Taxation est. · year 1
- Rental income
- $21,754
- − Mortgage interest
- −$16,525
- − Property taxes
- −$3,740
- − Insurance
- −$1,475
- − Repairs & maintenance
- −$1,740
- − Management
- −$1,740
- − Depreciation
- −$8,582
- Taxable loss
- −$12,048
- Est. tax savings @ 24.0%
- +$2,892
- After-tax cash flow
- $-3,702/yr
For passive investors: Depreciation is non-cash, so a rental often shows a tax loss while cash-flowing — sheltering income. Rental losses are passive: they offset passive income freely, and up to $25,000/yr can offset ordinary (W-2) income if you actively participate and your MAGI is under $100k (phasing out to $0 by $150k); unused losses carry forward. On sale, claimed depreciation is recaptured at up to 25%, and gains may owe capital-gains tax (a 1031 exchange can defer both). Figures are a year-1 estimate at your 24.0% rate — not tax advice; consult a CPA.
Schools (NCES district)
- District
- Independent School District 728
- NCES district ID
- 2711370
- Math proficiency
- 56% ▼ -15.00%
- Reading proficiency
- 60% ▼ -10.00%
- Median HH income
- $82,336
- Composite
- 52.5/100
- National rank
- #1567
- State rank
- #37 of 301 in MN
Livability — Elk River
- Score
- 72/100
- State rank
- #265
- US rank
- #5795
Category grades
Schools grade is shown separately in the Schools card above.
Census & demographics
- Census place
- Elk River, MN
- County
- Sherburne County · 120,363 people
- City population
- 45,721
- Metro
- Minneapolis-St. Paul-Bloomington, MN-WI
- Population (ZIP)
- 45,721
- Household income
- $115,761
- Rent vs Own
- Severe rent burden
- 285.0
Population outlook (Sherburne County) Hauer SSP2
- Today (2025)
- 97,402 people
- By 2030
- 99,341 · +2.0%
- By 2040
- 101,188 · +3.9%
- By 2050
- 99,214 · +1.9%
- By 2075
- 88,700 · -8.9%
- By 2100
- 72,241 · -25.8%
Race, ethnicity, and origin ACS 2023
- Neighborhood character
- Predominantly White (85%)
- Race & ethnicity
- White 85% Two or more races 6% Black 4% Hispanic / Latino 3% Asian 1%
- Common ancestry
- Portuguese 13% Romanian 6% Lithuanian 3%
- Foreign-born
- 5% · Canada, South Korea
- Languages at home
- 94% English-only · Spanish 2% Russian/Polish/Slavic 1% Other Asian/Pacific 1%
Political lean MEDSL · Sherburne
- 2024 margin
- Solid R (+34.9) · D 31.7% · R 66.6% · Other 1.7%
- 2008→2024 swing
- -16.7pp toward R · 2008: -18.2pp · 2024: -34.9pp
- All cycles
- 2024: R+34.9 2020: R+32.6 2016: R+37.0 2012: R+22.1 2008: R+18.2
Not yet ingested
- Civics
- —
Market trends
- HPI YoY
- ▼ -173.46%
- Current HPI
- 241.3028
- Rent YoY
- —
- Metro
- Minneapolis-St. Paul-Bloomington, MN-WI
- State GDP YoY
- ▲ 2.41%
- F500 in state
- 34
Industry mix (Fortune 500 HQ in MN)
| Industry | F500 HQs | Revenue |
|---|---|---|
| Healthcare | 2 | $407B |
|
||
| Retail | 2 | $150B |
|
||
| Consumer Goods | 2 | $32B |
|
||
| Industrial Machinery | 2 | $6B |
|
||
| Agriculture | 1 | $40B |
|
||
| Healthcare / Medical Devices | 1 | $32B |
|
||
Price history
+216.0% since first listed9 events — show timeline
- 2026-05-21 Pending — NORTHSTARMLS as Distributed by MLS Grid
- 2026-05-01 Contingent — NORTHSTARMLS as Distributed by MLS Grid
- 2026-04-29 Price Changed $295,000 NORTHSTARMLS as Distributed by MLS Grid
- 2026-04-14 Price Changed $335,000 NORTHSTARMLS as Distributed by MLS Grid
- 2026-04-14 Listed $350,000 NORTHSTARMLS as Distributed by MLS Grid
- 1995-12-29 Sold (Public Records) $93,350 Public Records
- 1995-12-15 Sold (MLS) $93,350 NORTHSTARMLS as Distributed by MLS Grid
- 1995-10-31 Listing Removed — NORTHSTARMLS as Distributed by MLS Grid
- 1995-10-31 Listed $93,350 NORTHSTARMLS as Distributed by MLS Grid
Property tax history
+5.0%/yrLatest (2025): $3,740 · +0.7% YoY. Source: county tax records.
Cash-flow waterfall
monthlySold comps — $/sqft
last 12 mo · ≤1 miLoading sold comps…