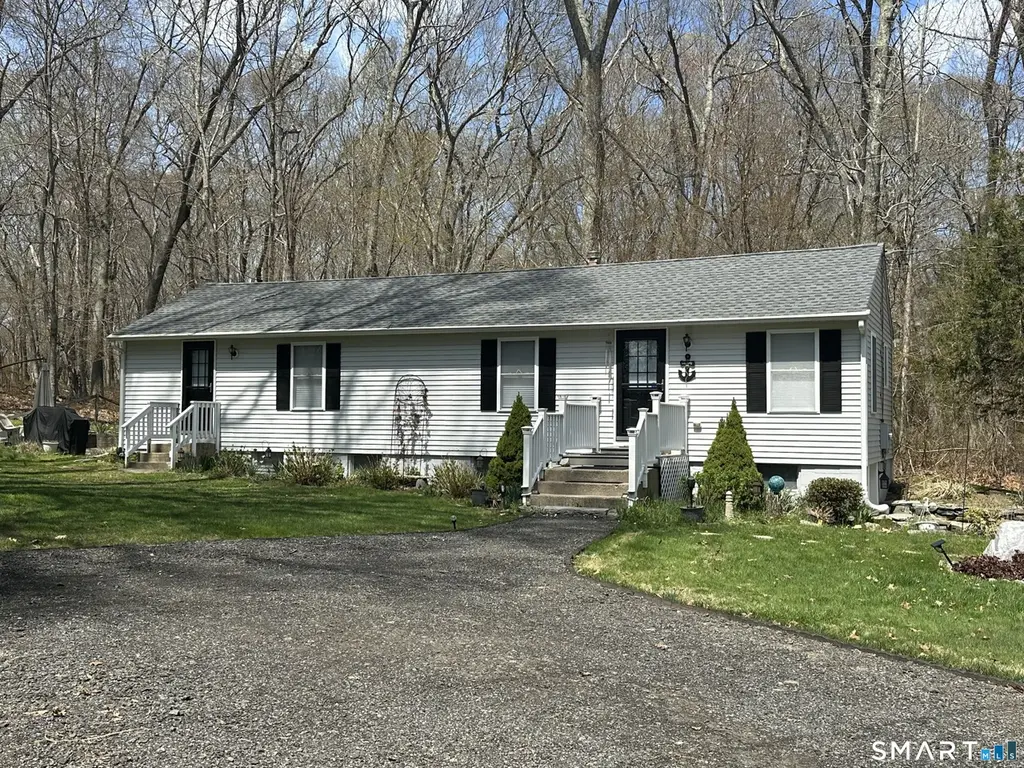
366 Shore Rd · Niantic, CT
Flood risk 1/10 · Minimal
- FEMA flood zone
- X (unshaded)
- Chance of flooding over 30 yrs
- 0.0%
- Est. flood insurance / yr
- $507 – $1,088
Fire risk 4/10 · Minor
- Est. fire insurance / yr
- $829 – $1,539
Heat risk 5/10 · Moderate
- Hot days now (above 95°F)
- 7 days/yr
- Hot days in 30 yrs
- 16 days/yr
Wind risk 8/10 · Major
- Chance of severe wind over 30 yrs
- 80.0%
Air-quality risk 4/10 · Minor
- Unhealthy air days now
- 5 days/yr
- Unhealthy air days in 30 yrs
- 7 days/yr
Risk factors via First Street. Map © Google.
Why this score? — see what drove the C+ grade
The composite is a weighted blend of 9 inputs, each scored 0–100. Each bar is that input's sub-score; the figure is the points it added to the 100-point composite (weight × sub-score).
- Cash flow +21.7/30.0
- ARV discount +15.0/15.0
- DSCR +6.9/10.0
- Schools +6.4/10.0
- 1% rule +4.9/10.0
- Livability +3.9/5.0
- Rent growth +2.5/5.0
- Condition / age +2.5/5.0
- Appreciation +0.0/10.0
$379,000
🖨 Deal sheet 📄 Offer letter ✓ Due diligence
Listing remarks MLS
Bright and sunny ranch home all new from the basement up. Charming, private, landscaped yard surrounded by conservation land. Close to beaches, highways and shopping. Home is in perfect, move in condition.
Key facts
- Cedar closet
- Protected land trust
- 0.23 acre lot
Tags
Property features AI
Exterior
- Utilities: Private well water; Septic sewage
- Home design: Single-family home
- Construction: Frame construction; Vinyl siding; White exterior; Asphalt shingle roof; Concrete foundation; Built with full walk-out basement
- Exterior features: Deck; Patio; Sidewalk; Garden area; Outdoor lighting; Stone wall; Grill; Gutters
Interior
- Kitchen: Electric range; Microwave; Refrigerator; Dishwasher
- Bedrooms: 2 bedrooms
- Bathrooms: 1 full bathroom
- Heating & cooling: Central air conditioning; Hot air heating (oil fuel); 40-gallon electric hot water tank; Above-ground oil tank; Extra insulation; Programmable thermostat; Storm doors
- Interior features: Cable pre-wired; Thermostat(s); One fireplace; Has attic with hatch access; Full unfinished basement with storage, concrete floor and walk-out
- Laundry & utility: Washer and electric dryer; Laundry room on main level, separate from main bath
Neighborhood map
What this means for you Summary
Snapshot
- This is a 2-bed/1.0-bath single-family listed at $379k.
Deal economics
- At list price, monthly cash flow is $581 ($7k/yr) — positive.
- The deal already cash-flows at list — no discount required.
- To meet the 1% rule (rent ≥ 1% of price), the offer needs to be $375k (1.1% below list).
- Recommended offer: $375k (1.1% below list) — sets the bar for 1% rule.
- Cap rate 8.1% vs local median 3.0% in Niantic — top-decile yield for the area; either an underpriced asset or a hidden risk that comps aren't pricing in. Stress-test before assuming the spread holds.
Location & tenants
- Location reads 78/100 on livability (#35 in CT, #2,462 nationally) — a middle-class / working-renter tenant base. Strengths: schools A+, crime A+, employment A+; Watch: cost of living D+, amenities F, commute F.
- Regional School District 18 (rural): math 67% / reading 76% proficiency, ranked #16 of 153 in CT (top 10%) — strong family-tenant draw, lease renewals of 3-5y typical; only 7% free/reduced lunch — higher-income household profile.
- Market conditions: 68 active listings in the ZIP; 1 comparable units currently listed for rent nearby; 278 units permitted in Lower Connecticut River Valley Planning Region in 2024 (89 in 5+ unit buildings).
Forward outlook
- Local home prices are declining (-3.0%/yr); year-one equity from $3k of loan paydown is wiped out by about $11k of value loss. Plan a longer hold.
Negotiation context
- Only 5 days on market — expect competitive offers; lowballing is unlikely to land.
- 6 sale attempts since 25y ago with the ask held roughly flat each time — persistent listings suggest the price (not the market) is what's stuck; bring a comps-based counter.
- Current owner paid $225k; list at $379k implies a 68% gain — meaningful room to come down on a strong offer.
Risks & watch-outs
- Watch-outs: built in 1955 — expect roof / HVAC / electrical / plumbing capex.
- Climate carrying-cost: severe wind risk, 80% chance of damaging wind over 30y; extreme-heat days projected 7→16/yr by 2055 (HVAC capex compounding) — expect insurance premiums to compound above CPI over the hold.
Questions for the listing agent
- Built in 1955 — when were the roof, HVAC, electrical panel, plumbing, and water heater last replaced?
- Is there a deadline driving the sale (1031 exchange, divorce, estate, relocation)? That informs how much negotiation room exists.
- Schools are A-rated — typically a magnet for longer-tenancy family renters. What's the average tenant stay here, and is there a school-zone premium baked into asking?
- What's the average days-on-market for RENTAL listings here right now (not sales)? A rising rental-DOM trend means longer vacancies and softer asking-rent achievability than the comps imply.
- What's the recent tenant-quality profile in this submarket — average credit score on applications, eviction rate, late-payment / NSF rate, and stable-employment percentage? A property-management company in the area should have these aggregated.
- How much new for-sale + rental construction is in the pipeline within 1–3 miles? Heavy new supply typically softens prices + rents 12–24 months out; constrained supply supports both.
Investment metrics
- 1% rule
- 0.99% ✗
- Cap rate
- 8.13%
- Cash-on-cash
- 6.57%
- DSCR
- 1.29
- GRM
- 8.4
CMA / ARV
- ARV (on-the-fly)
- $674,568
- Comps found
- 5
Show comp detail 5 sales within ~0.75 mi
| Address | Dist | Beds/Ba | Sqft | Sold | Price | $/sf | Match |
|---|---|---|---|---|---|---|---|
| 366 Shore Rd | 0.00mi | 2/1.0 | 972 (0%) | 1mo | $379,000 | $390 | 99 |
| 314 Shore Rd | 0.56mi | 2/1.0 | 964 (-1%) | 0mo | $500,000 | $519 | 72 |
| 49 Ridgewood Rd | 0.60mi | 3/1.5 (+1) | 1,002 (+3%) | 8mo | $800,000 | $798 | 53 |
| 8 Billow Rd | 0.55mi | 3/1.0 (+1) | 1,052 (+8%) | 19mo | $750,000 | $713 | 40 |
| 45 Ridgewood Rd | 0.58mi | 3/2.0 (+1) | 1,080 (+11%) | 21mo | $750,000 | $694 | 28 |
Match score weights: distance 35% · size 25% · config 20% · recency 20%. Top-matched comps best support the ARV.
Projected returns pro-forma
-3.0% appreciation · 3.0% rent growth · sell at horizon
- IRR
- -6.2%
- Equity multiple
- 0.77×
- Total profit
- $-24,495
- Equity at exit
- $56,510
- IRR
- 3.4%
- Equity multiple
- 1.24×
- Total profit
- $25,960
- Equity at exit
- $32,769
Cash invested: $106,120 (down + closing). Projections, not guarantees.
Landlord ↔ Tenant lean methodology
- Overall (STATE)
- 27 Tenant-Leaning
- State Connecticut
- 27 Tenant-Leaning · D+7
- County
- — inherits STATE
- City
- — inherits STATE
ZIP-level market 06371
- Home prices YoY
- -25.3%
- Active inventory
- 68
- Price-to-rent
- 8.4×
Monthly cashflow live
- Estimated rent
- $3,750 medium interval (Pro) →
- Mortgage (P&I)
- −$1,988
- Tax from tax record
- −$236 /mo · $2,832/yr
- Insurance
- −$158
- HOA
- −$0
- Vacancy / Maint / Mgmt
- −$788
- Net cashflow
- $581
Break-even live
UW: 25.0% down · 7.5% · 30yr · 1.5% tax · 5.0% vac · 8.0% maint · 8.0% mgmt
Financing live
Cash to close
- Down payment
- $94,750
- Closing costs
- $11,370
- Reserves months
- —
- Total cash needed
- —
Loan-product check · same deal, 3 products live
Conventional
25% down · 7.5% · 30yr
- Down + closing
- —
- Monthly P&I
- —
- Monthly cashflow
- —
- DSCR
- —
- Eligible?
- —
Personal DTI + credit; lowest rate.
DSCR
20% down · 8.5% · 30yr
- Down + closing
- —
- Monthly P&I
- —
- Monthly cashflow
- —
- DSCR
- —
- Eligible?
- —
No personal income docs; deal must DSCR.
Hard money
10% down · 12.0% · 12mo
- Down + closing
- —
- Monthly P&I
- —
- Monthly cashflow
- —
- DSCR
- —
- Eligible?
- —
Short-term bridge; refi at stabilization.
Rent comps 1 comps
| Address | Beds | Baths | Sqft | Rent | $/sqft | DOM | Units | Dist |
|---|---|---|---|---|---|---|---|---|
| 25 Biscayne Blvd Old Lyme, CT | 3.0 | 1.0 | 900 | $3,750 | $4.17 | 13d | 1 | 0.98mi |
Listing history 15 events
-
2026-04-30status Under Contract
-
2026-04-24$379,000 Active
-
2024-09-29historical $1,900
-
2024-08-31price $1,900
-
2024-07-19$2,200
-
2015-10-30historical
-
2015-05-11$275,000
-
2007-09-21soldstatus $225,000 205-char remark
Show marketing remark (205 chars)
Bright and sunny ranch home all new from the basement up. Charming, private, landscaped yard surrounded by conservation land. Close to beaches, highways and shopping. Home is in perfect, move in condition.
-
2007-09-21soldstatus $225,000
Show marketing remark (205 chars)
Bright and sunny ranch home all new from the basement up. Charming, private, landscaped yard surrounded by conservation land. Close to beaches, highways and shopping. Home is in perfect, move in condition.
-
2007-04-03$249,000 205-char remark
Show marketing remark (205 chars)
Bright and sunny ranch home all new from the basement up. Charming, private, landscaped yard surrounded by conservation land. Close to beaches, highways and shopping. Home is in perfect, move in condition.
-
2001-11-28soldstatus $127,000
-
2001-08-10$124,900
-
2001-05-25soldstatus $76,000
-
2001-05-25soldstatus $76,000
-
2001-03-21$85,900
ⓘ Source: listings_history table (triggers on properties + properties_extension) + one-shot
backfill from property_details.listing_events for pre-trigger history.
Tax reassessment forecast CT · Partial reset (capped growth)
- Current annual tax
- $2,832 · $236/mo
- Projected year-2 tax
- $5,471 · $456/mo
- Expected delta
- +$2,639/yr (+$220/mo · 93.2%)
ⓘ Screening estimate from a state-policy table — verify with the county assessor before closing.
Climate risk First Street
- Flood 1/10 Low FEMA zone X (unshaded) · 0% chance over 30 yrs
- Wildfire 4/10 Moderate
- Heat 5/10 Major 7 d/yr ≥95°F today · 16 d/yr by 30 yrs out
- Wind 8/10 Severe 80% chance of damaging wind over 30 yrs
- Air quality 4/10 Moderate 5 unhealthy d/yr today · 7 by 30 yrs out
Nearby sold comps map
Loading sold comps map…
Walkable amenities ~0.75 mi
Loading nearby amenities…
Taxation est. · year 1
- Rental income
- $45,000
- − Mortgage interest
- −$21,230
- − Property taxes
- −$2,832
- − Insurance
- −$1,895
- − Repairs & maintenance
- −$3,600
- − Management
- −$3,600
- − Depreciation
- −$11,025
- Taxable income
- $818
- Est. tax owed @ 24.0%
- −$196
- After-tax cash flow
- $6,777/yr
For passive investors: Depreciation is non-cash, so a rental often shows a tax loss while cash-flowing — sheltering income. Rental losses are passive: they offset passive income freely, and up to $25,000/yr can offset ordinary (W-2) income if you actively participate and your MAGI is under $100k (phasing out to $0 by $150k); unused losses carry forward. On sale, claimed depreciation is recaptured at up to 25%, and gains may owe capital-gains tax (a 1031 exchange can defer both). Figures are a year-1 estimate at your 24.0% rate — not tax advice; consult a CPA.
Schools (NCES district)
- District
- Regional School District 18
- NCES district ID
- 0903540
- Math proficiency
- 67% ▼ -11.00%
- Reading proficiency
- 76% ▼ -4.00%
- Median HH income
- $87,776
- Composite
- 64.19/100
- National rank
- #566
- State rank
- #16 of 153 in CT
Livability — Niantic
- Score
- 78/100
- State rank
- #35
- US rank
- #2462
Category grades
Schools grade is shown separately in the Schools card above.
Census & demographics
- City population
- 11,332
- Population (ZIP)
- 9,855
Population outlook (Lower Connecticut River Valley County) Hauer SSP2
- By 2040
- 188,651
Race, ethnicity, and origin ACS 2023
- Neighborhood character
- Predominantly White (89%)
- Race & ethnicity
- White 89% Two or more races 6% Hispanic / Latino 4% Asian 3%
- Common ancestry
- Romanian 10% Lithuanian 6% Slovak 4%
- Foreign-born
- 7% · Canada, China, South Korea
- Languages at home
- 92% English-only · Other Indo-European 4% Spanish 2% Russian/Polish/Slavic 1%
Political lean MEDSL · Lower Connecticut River Valley
- 2024 margin
- D (+13.4) · D 55.9% · R 42.4% · Other 1.7%
- All cycles
- 2024: D+13.4
Not yet ingested
- Civics
- —
Market trends
- HPI YoY
- ▼ -80.61%
- Current HPI
- 238.5046
- Rent YoY
- —
- Metro
- —
- State GDP YoY
- ▲ 1.06%
- F500 in state
- 38
Industry mix (Fortune 500 HQ in CT)
| Industry | F500 HQs | Revenue |
|---|---|---|
| Industrial Machinery | 4 | $38B |
|
||
| Insurance | 3 | $71B |
|
||
| Financial Services | 2 | $25B |
|
||
| Transportation / Logistics | 2 | $18B |
|
||
| Healthcare | 1 | $247B |
|
||
| Telecommunications | 1 | $55B |
|
||
Price history
+341.2% since first listed15 events — show timeline
- 2026-04-30 Pending — Smart MLS
- 2026-04-24 Listed $379,000 Smart MLS
- 2024-09-29 Rental Removed $1,900 SMARTMLS
- 2024-08-31 Price Changed $1,900 SMARTMLS
- 2024-07-19 Listed for Rent $2,200 SMARTMLS
- 2015-10-30 Listing Removed — Smart MLS
- 2015-05-11 Listed $275,000 Smart MLS
- 2007-09-21 Sold (Public Records) $225,000 Public Records
- 2007-09-21 Sold (MLS) $225,000 Smart MLS
- 2007-04-03 Listed $249,000 Smart MLS
- 2001-11-28 Sold (MLS) $127,000 Smart MLS
- 2001-08-10 Listed $124,900 Smart MLS
- 2001-05-25 Sold (Public Records) $76,000 Public Records
- 2001-05-25 Sold (MLS) $76,000 Smart MLS
- 2001-03-21 Listed $85,900 Smart MLS
Property tax history
+1.6%/yrLatest (2023): $2,832 · +0.0% YoY. Source: county tax records.
Cash-flow waterfall
monthlySold comps — $/sqft
last 12 mo · ≤1 miLoading sold comps…