3120 Live Oak Blvd #136 · Yuba City, CA
Flood risk 1/10 · Minimal
- FEMA flood zone
- —
- Chance of flooding over 30 yrs
- 0.0%
- Est. flood insurance / yr
- —
Fire risk 8/10 · Major
- Est. fire insurance / yr
- $659 – $1,223
Heat risk 7/10 · Major
- Hot days now (above 105°F)
- 7 days/yr
- Hot days in 30 yrs
- 18 days/yr
Wind risk 1/10 · Minimal
- Chance of severe wind over 30 yrs
- —
Air-quality risk 10/10 · Severe
- Unhealthy air days now
- 28 days/yr
- Unhealthy air days in 30 yrs
- 32 days/yr
Risk factors via First Street. Map © Google.
Why this score? — see what drove the C grade
The composite is a weighted blend of 9 inputs, each scored 0–100. Each bar is that input's sub-score; the figure is the points it added to the 100-point composite (weight × sub-score).
- Cash flow +27.1/30.0
- DSCR +9.4/10.0
- 1% rule +7.3/10.0
- Livability +3.8/5.0
- Schools +3.2/10.0
- Rent growth +2.9/5.0
- Condition / age +2.5/5.0
- ARV discount +0.0/15.0
- Appreciation +0.0/10.0
$120,000
🖨 Deal sheet 📄 Offer letter ✓ Due diligence
Listing remarks
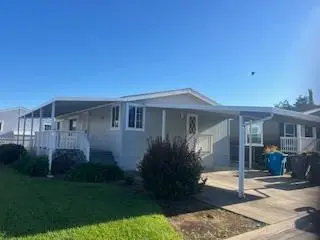
Don't miss this move in ready gem! This charming 3-bedroom 2-bath home offers the perfect blend of comfort, modern updates, and unbeatable value. Located in a highly desirable park the home has beautifully renovated inside and out. Exterior Highlights: Fresh new paint and siding. Inviting front porch the ideal spot for morning coffee. Spacious side yard with room for your own vegetable garden. Fully renovated shed for extra storage. Interior Upgrades: New flooring in the primary bedroom. Convenient indoor laundry area just off the kitchen. New dryer vent with updated duct work. New electrical lines throughout. . Owner responsible for all utilities. This is a rare opportunity to own a turnke
Key facts
- Indoor laundry area
- Fresh new paint
- Spacious side yard
Tags
Property features AI
Finance
- Other: Located at 3120 Live Oak Blvd #136, Yuba City, CA 95991; Parcel within ZIP code 95991, Sutter County; follow GPS for directions
- HOA & community: No homeowners association; Not a senior community; Land lease: No (listed land lease amount present)
Exterior
- Parking: Covered parking
- Utilities: Public water; Public sewer; Natural gas connected; Cable connected; Internet available
- Home design: Manufactured home in a park; Double-wide; Built in 1992
- Construction: Composition roof; Fleetwood make (manufactured unit); Skirted exterior
- Exterior features: Fenced yard; Front and back landscaping
Interior
- Kitchen: Free-standing gas range; Microwave; Laminate countertops
- Bedrooms: 3 bedrooms
- Flooring: Carpet; Laminate; Vinyl
- Bathrooms: 2 full bathrooms
- Heating & cooling: Central heating; Central cooling
- Interior features: Shower stall(s); Laminate counters; Dining space in kitchen; Living room with unspecified additional feature
- Laundry & utility: Laundry inside home (laundry room); 220V outlet in laundry
Neighborhood map
What this means for you Summary
Snapshot
- This is a 2-bed/2.0-bath manufactured listed at $120k.
Deal economics
- At list price, monthly cash flow is $341 ($4k/yr) — positive.
- The deal already cash-flows at list — no discount required.
- Meets the 1% rule at list price ($1k rent vs $120k).
- Recommended offer: $116k (3.0% below list) — sets the bar for market timing.
- Cap rate 9.7% vs local median 3.6% in Yuba City — top-decile yield for the area; either an underpriced asset or a hidden risk that comps aren't pricing in. Stress-test before assuming the spread holds.
Location & tenants
- Location reads 75/100 on livability (#111 in CA, #3,863 nationally) — a middle-class / working-renter tenant base. Strengths: commute A+, housing A+, health & safety A+; Watch: crime D+, schools D, cost of living F.
- Yuba City Unified (urban): math 20% / reading 53% proficiency, ranked #263 of 517 in CA (top 51%) — families likely to look elsewhere, expect single-tenant / working-renter base with shorter leases.
- Market conditions: Rents rising (+1.8%/yr); 149 active listings in the ZIP; 17 comparable units currently listed for rent nearby; rentals at typical pace (median 21d on market — plan ~3-4 weeks tenant-placement turnaround); 47% of comp listings sitting > 30 days — soft ceiling on asking rent; 73 units permitted in Sutter County in 2024 (0 in 5+ unit buildings).
Forward outlook
- Local home prices are declining (-3.0%/yr); year-one equity from $830 of loan paydown is wiped out by about $4k of value loss. Plan a longer hold.
- Sutter County population projected to shrink 4% by 2050 — rents likely to lag national; underwrite the cash flow, not the appreciation.
Negotiation context
- It's been on market 32 days — a 3% lower offer ($116k) is reasonable based on typical stale-listing flexibility.
Risks & watch-outs
- Climate carrying-cost: severe wildfire risk; extreme-heat days projected 7→18/yr by 2055 (HVAC capex compounding) — expect insurance premiums to compound above CPI over the hold.
Questions for the listing agent
- It's been on market 32 days. Have you received any prior offers? Is the seller open to a 3% concession, seller financing, or rate buy-down credit?
- Is there a deadline driving the sale (1031 exchange, divorce, estate, relocation)? That informs how much negotiation room exists.
- Schools are D-rated, which usually means shorter tenancies and higher turnover. Who's the typical renter profile here, and what's been the actual vacancy rate?
- Crime grade is D in this area — have there been break-ins, vandalism, or insurance claims at this property in the last 3 years? What carrier currently insures it and at what premium?
- What's the average days-on-market for RENTAL listings here right now (not sales)? A rising rental-DOM trend means longer vacancies and softer asking-rent achievability than the comps imply.
- What's the recent tenant-quality profile in this submarket — average credit score on applications, eviction rate, late-payment / NSF rate, and stable-employment percentage? A property-management company in the area should have these aggregated.
- How much new for-sale + rental construction is in the pipeline within 1–3 miles? Heavy new supply typically softens prices + rents 12–24 months out; constrained supply supports both.
Investment metrics
- 1% rule
- 1.23% ✓
- Cap rate
- 9.70%
- Cash-on-cash
- 12.17%
- DSCR
- 1.54
- GRM
- 6.8
CMA / ARV
- ARV (on-the-fly)
- $101,760
- Comps found
- 6
Show comp detail 6 sales within ~0.75 mi
| Address | Dist | Beds/Ba | Sqft | Sold | Price | $/sf | Match |
|---|---|---|---|---|---|---|---|
| 1155 Pease #43 | 0.33mi | 2/2.0 | 1,000 (+4%) | 13mo | $92,000 | $92 | 66 |
| 3120 Live Oak Blvd #76 | 0.18mi | 2/1.5 | 864 (-10%) | 8mo | $134,000 | $155 | 66 |
| 1155 Pease Rd #526 | 0.20mi | 2/1.0 | 864 (-10%) | 8mo | $65,000 | $75 | 63 |
| 1155 Pease Rd #428 | 0.23mi | 2/2.0 | 1,080 (+12%) | 12mo | $115,000 | $106 | 58 |
| 3120 Live Oak #51 | 0.21mi | 2/1.0 | 850 (-12%) | 13mo | $91,500 | $108 | 56 |
| 1155 Pease Rd #430 | 0.23mi | 2/1.0 | 837 (-13%) | 12mo | $86,000 | $103 | 54 |
Match score weights: distance 35% · size 25% · config 20% · recency 20%. Top-matched comps best support the ARV.
Projected returns pro-forma
-3.0% appreciation · 1.79% rent growth · sell at horizon
- IRR
- 0.4%
- Equity multiple
- 1.01×
- Total profit
- $500
- Equity at exit
- $17,892
- IRR
- 8.8%
- Equity multiple
- 1.64×
- Total profit
- $21,338
- Equity at exit
- $10,375
Cash invested: $33,600 (down + closing). Projections, not guarantees.
Landlord ↔ Tenant lean methodology
- Overall (STATE)
- 18 Strongly Tenant-Friendly
- State California
- 18 Strongly Tenant-Friendly · D+13
- County
- — inherits STATE
- City
- — inherits STATE
ZIP-level market 95991
- Rents YoY
- 1.8%
- Active inventory
- 149
- Price-to-rent
- 6.8×
Monthly cashflow live
- Estimated rent
- $1,481 high interval (Pro) →
- Mortgage (P&I)
- −$629
- Tax est. 1.5%
- −$150 /mo · $1,800/yr
- Insurance
- −$50
- HOA
- −$0
- Vacancy / Maint / Mgmt
- −$311
- Net cashflow
- $341
Break-even live
UW: 25.0% down · 7.5% · 30yr · 1.5% tax · 5.0% vac · 8.0% maint · 8.0% mgmt
Financing live
Cash to close
- Down payment
- $30,000
- Closing costs
- $3,600
- Reserves months
- —
- Total cash needed
- —
Loan-product check · same deal, 3 products live
Conventional
25% down · 7.5% · 30yr
- Down + closing
- —
- Monthly P&I
- —
- Monthly cashflow
- —
- DSCR
- —
- Eligible?
- —
Personal DTI + credit; lowest rate.
DSCR
20% down · 8.5% · 30yr
- Down + closing
- —
- Monthly P&I
- —
- Monthly cashflow
- —
- DSCR
- —
- Eligible?
- —
No personal income docs; deal must DSCR.
Hard money
10% down · 12.0% · 12mo
- Down + closing
- —
- Monthly P&I
- —
- Monthly cashflow
- —
- DSCR
- —
- Eligible?
- —
Short-term bridge; refi at stabilization.
Rent comps 17 comps
| Address | Beds | Baths | Sqft | Rent | $/sqft | DOM | Units | Dist |
|---|---|---|---|---|---|---|---|---|
| 1290 Northgate Dr Unit 28 Yuba City, CA | 2.0 | 1.0 | 872 | $1,450 | $1.66 | 21d | 1 | 1.14mi |
| 1290 Northgate Dr Unit 80 Yuba City, CA | 1.0 | 1.0 | 678 | $1,250 | $1.84 | 21d | 1 | 1.17mi |
| 1290 Northgate Dr Unit 81 Yuba City, CA | 2.0 | 2.0 | 941 | $1,500 | $1.59 | 43d | 1 | 1.17mi |
| 1290 Northgate Dr Unit 14 Yuba City, CA | 1.0 | 1.0 | 680 | $1,200 | $1.76 | 43d | 1 | 1.17mi |
| 1138 Forestwood Dr Yuba City, CA | 2.0 | 2.0 | 964 | $2,025 | $2.10 | 21d | 1 | 1.25mi |
| 1290 Forestwood Dr Unit 13 Yuba City, CA | 1.0 | 1.0 | 655 | $1,240 | $1.89 | 21d | 1 | 1.29mi |
| 1290 Forestwood Dr Yuba City, CA | 1.0 | 1.0 | 655 | $1,240 | $1.89 | 13d | 1 | 1.29mi |
| 1250 Melton Dr Yuba City, CA | 1.0–2.0 | 1.0 | 646 | $1,300 | $2.01 | 13d | 2 | 1.33mi |
| 1199 Casita Dr #1 Yuba City, CA | 2.0 | 1.0 | 896 | $1,500 | $1.67 | 21d | 1 | 1.35mi |
| 1188 Casita Dr Yuba City, CA | 2.0 | 1.0 | 840 | $1,399 | $1.67 | 43d | 1 | 1.37mi |
| 1171 Kenny Dr Yuba City, CA | 2.0 | 1.0 | 900 | $1,500 | $1.67 | 43d | 1 | 1.40mi |
| 1171 Kenny Dr Unit 10 Yuba City, CA | 2.0 | 1.0 | 900 | $1,375 | $1.53 | 43d | 1 | 1.40mi |
| 1211 Kenny Dr Unit 19 Yuba City, CA | 1.0 | 1.0 | 750 | $1,195 | $1.59 | 43d | 1 | 1.41mi |
| 1570 Gray Ave Unit 16 Yuba City, CA | 1.0 | 1.0 | 700 | $1,275 | $1.82 | 21d | 1 | 1.44mi |
| 1210 Kenny Dr Unit 95991 Yuba City, CA | 1.0 | 1.0 | 650 | $1,225 | $1.88 | 43d | 1 | 1.44mi |
| 1170 Kenny Dr Yuba City, CA | 1.0 | 1.0 | 544 | $1,100 | $2.02 | 13d | 2 | 1.45mi |
| 1518 Upland Dr Unit 1518 Yuba City, CA | 2.0 | 1.0 | 1084 | $1,900 | $1.75 | 43d | 1 | 1.48mi |
Listing history 18 events
-
2026-06-19days on market $120,000 Active 32 DOM
-
2026-06-18days on market $120,000 Active 31 DOM
-
2026-06-17days on market $120,000 Active 30 DOM
-
2026-06-16days on market $120,000 Active 29 DOM
-
2026-06-15days on market $120,000 Active 28 DOM
-
2026-06-14days on market $120,000 Active 26 DOM
-
2026-06-13days on market $120,000 Active 25 DOM
-
2026-06-10days on market $120,000 Active 23 DOM
-
2026-06-09days on market $120,000 Active 22 DOM
-
2026-06-08days on market $120,000 Active 21 DOM
-
2026-06-07days on market $120,000 Active 20 DOM
-
2026-06-05days on market $120,000 Active 17 DOM
-
2026-06-03days on market $120,000 Active 16 DOM
-
2026-06-03price $120,000 Active 15 DOM
-
2026-06-02days on market $130,000 Active 15 DOM
-
2026-06-01days on market $130,000 Active 14 DOM
-
2026-05-31days on market $130,000 Active 13 DOM
-
2026-05-30days on market $130,000 Active 12 DOM
ⓘ Source: listings_history table (triggers on properties + properties_extension) + one-shot
backfill from property_details.listing_events for pre-trigger history.
Climate risk First Street
- Flood 1/10 Low 0% chance over 30 yrs
- Wildfire 8/10 Severe
- Heat 7/10 Severe 7 d/yr ≥105°F today · 18 d/yr by 30 yrs out
- Wind 1/10 Low
- Air quality 10/10 Extreme 28 unhealthy d/yr today · 32 by 30 yrs out
Nearby sold comps map
Loading sold comps map…
Walkable amenities ~0.75 mi
Loading nearby amenities…
Taxation est. · year 1
- Rental income
- $17,773
- − Mortgage interest
- −$6,722
- − Property taxes
- −$1,800
- − Insurance
- −$600
- − Repairs & maintenance
- −$1,422
- − Management
- −$1,422
- − Depreciation
- −$3,491
- Taxable income
- $2,317
- Est. tax owed @ 24.0%
- −$556
- After-tax cash flow
- $3,533/yr
For passive investors: Depreciation is non-cash, so a rental often shows a tax loss while cash-flowing — sheltering income. Rental losses are passive: they offset passive income freely, and up to $25,000/yr can offset ordinary (W-2) income if you actively participate and your MAGI is under $100k (phasing out to $0 by $150k); unused losses carry forward. On sale, claimed depreciation is recaptured at up to 25%, and gains may owe capital-gains tax (a 1031 exchange can defer both). Figures are a year-1 estimate at your 24.0% rate — not tax advice; consult a CPA.
Schools (NCES district)
- District
- Yuba City Unified
- NCES district ID
- 0643470
- Math proficiency
- 20% ▼ -10.00%
- Reading proficiency
- 53% ▲ 5.00%
- Median HH income
- $50,923
- Composite
- 31.55/100
- National rank
- #5956
- State rank
- #263 of 517 in CA
Livability — Yuba City
- Score
- 75/100
- State rank
- #111
- US rank
- #3863
Category grades
Schools grade is shown separately in the Schools card above.
Census & demographics
- Census place
- Yuba City, CA
- County
- Sutter County · 81,625 people
- City population
- 81,625
- Metro
- Yuba City, CA
- Population (ZIP)
- 42,579
- Household income
- $70,590
- Rent vs Own
- Severe rent burden
- 1674.0
Population outlook (Sutter County) Hauer SSP2
- Today (2025)
- 97,244 people
- By 2030
- 97,170 · -0.1%
- By 2040
- 96,137 · -1.1%
- By 2050
- 93,604 · -3.7%
- By 2075
- 85,008 · -12.6%
- By 2100
- 71,584 · -26.4%
Race, ethnicity, and origin ACS 2023
- Neighborhood character
- Diverse neighborhood (Simpson 0.68)
- Race & ethnicity
- Hispanic / Latino 41% White 37% Two or more races 19% Asian 12% Black 2% Native American 2%
- Hispanic origin (detail)
- Mexican 36% Puerto Rican 2%
- Common ancestry
- Slovak 2% Russian 1% Portuguese 1%
- Foreign-born
- 24% · Canada, Jamaica
- Languages at home
- 60% English-only · Spanish 28% Other Indo-European 10% Other Asian/Pacific 1%
Political lean MEDSL · Sutter
- 2024 margin
- Solid R (+31.4) · D 33.1% · R 64.5% · Other 2.4%
- 2008→2024 swing
- -14.7pp toward R · 2008: -16.7pp · 2024: -31.4pp
- All cycles
- 2024: R+31.4 2020: R+16.4 2016: R+16.3 2012: R+21.8 2008: R+16.7
Not yet ingested
- Civics
- —
Market trends
- HPI YoY
- ▼ -343.11%
- Current HPI
- 240.3835
- Rent YoY
- ▲ 1.79%
- Metro
- Yuba City, CA
- State GDP YoY
- ▲ 3.21%
- F500 in state
- 116
Industry mix (Fortune 500 HQ in CA)
| Industry | F500 HQs | Revenue |
|---|---|---|
| Technology | 27 | $1,492B |
|
||
| Financial Services | 3 | $174B |
|
||
| Retail | 3 | $44B |
|
||
| Insurance | 3 | $26B |
|
||
| Media / Entertainment | 2 | $115B |
|
||
| Pharmaceuticals / Biotech | 2 | $62B |
|
||
Property tax history
-8.1%/yrLatest (2025): $155 · -57.3% YoY. Source: county tax records.
Cash-flow waterfall
monthlySold comps — $/sqft
last 12 mo · ≤1 miLoading sold comps…