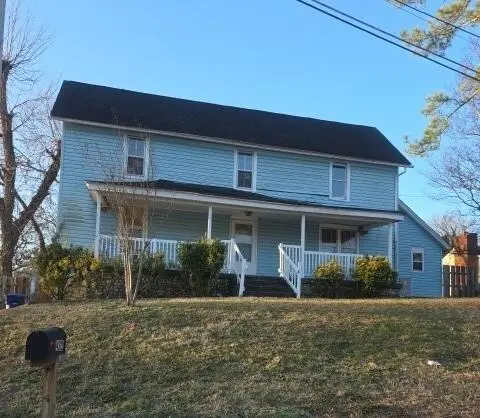
4212 Howell Rd · Chattanooga, TN
Flood risk 1/10 · Minimal
- FEMA flood zone
- X (unshaded)
- Chance of flooding over 30 yrs
- 0.0%
- Est. flood insurance / yr
- $507 – $1,088
Fire risk 1/10 · Minimal
- Est. fire insurance / yr
- $949 – $1,763
Heat risk 6/10 · Moderate
- Hot days now (above 105°F)
- 7 days/yr
- Hot days in 30 yrs
- 19 days/yr
Wind risk 4/10 · Minor
- Chance of severe wind over 30 yrs
- 13.0%
Air-quality risk 3/10 · Minor
- Unhealthy air days now
- 2 days/yr
- Unhealthy air days in 30 yrs
- 2 days/yr
Risk factors via First Street. Map © Google.
Why this score? — see what drove the B- grade
The composite is a weighted blend of 9 inputs, each scored 0–100. Each bar is that input's sub-score; the figure is the points it added to the 100-point composite (weight × sub-score).
- Cash flow +26.0/30.0
- ARV discount +15.0/15.0
- DSCR +8.7/10.0
- 1% rule +5.6/10.0
- Livability +3.9/5.0
- Rent growth +2.7/5.0
- Schools +2.7/10.0
- Condition / age +2.5/5.0
- Appreciation +0.0/10.0
$179,900
🖨 Deal sheet (PDF) 📄 Offer letter ✓ Due diligence
Listing remarks
Large home in the very desired Brainerd Area with extra large bedrooms and 3 full baths, double sided fireplace in the den, central air and heat, hardwood floors and extra large front and backyard. EXCELLENT VALUE. Please be advised hat any offers on this property require a minimum Earnest Money Deposit of 1% of the Purchase Price or $1,000, whichever is greater. All initial offers must be submitted via PropOffers.com by the BUYER AGENT ONLY Information provided in the MLS is taken from tax records & is deemed reliable but not guaranteed. Buyer to perform inspection and verify all information.
Key facts
- Hardwood floors
- 0.39 acre lot
- Built 1910
Tags
Property features AI
Exterior
- Parking: Concrete driveway
- Utilities: Public water; Public sewer; No listed utilities otherwise
- Home design: Single-family residence; Two stories
- Construction: Built with other construction materials; Block foundation; Shingle roof
- Exterior features: Covered porch; Deck; Patio; Gentle sloping lot
Interior
- Kitchen: Eat-in kitchen
- Bedrooms: Total rooms: 9
- Flooring: Hardwood floors
- Bathrooms: 3 full bathrooms
- Heating & cooling: Central heating (natural gas); Central electric air conditioning
- Interior features: Ceiling fans; Eat-in kitchen; Open floorplan; Walk-in closets; Basement; Gas log fireplace in living room
Neighborhood map
What this means for you Summary
Snapshot
- This is a 4-bed/3.0-bath single-family listed at $180k.
Deal economics
- At list price, monthly cash flow is $445 ($5k/yr) — positive.
- The deal already cash-flows at list — no discount required.
- Meets the 1% rule at list price ($2k rent vs $180k).
- Recommended offer: $164k (9.0% below list) — sets the bar for market timing.
- Cap rate 9.3% vs local median 3.4% in Chattanooga — top-decile yield for the area; either an underpriced asset or a hidden risk that comps aren't pricing in. Stress-test before assuming the spread holds.
Location & tenants
- Location reads 78/100 on livability (#3 in TN, #2,582 nationally) — a middle-class / working-renter tenant base. Strengths: amenities A+, commute A+, cost of living A+; Watch: employment D+, crime F.
- Hamilton County (urban): math 31% / reading 31% proficiency, ranked #42 of 139 in TN (top 30%) — families likely to look elsewhere, expect single-tenant / working-renter base with shorter leases.
- Zoned schools: Woodmore Elementary (math 22% / reading 17%, grade F, #654 of 952 statewide, top 72%, 301 students, 0% FRL); Dalewood Middle School (math 7% / reading 7%, grade F, #278 of 333 statewide, top 85%, 258 students, 0% FRL); Brainerd High School (math 2% / reading 12%, grade F, #294 of 332 statewide, top 91%, 635 students, 0% FRL) — zoned schools average 0% FRL vs 52% district-wide (52 pts lower); this property's tenant base skews higher-income than the district average.
- Zoned-school proficiency averages 11% at this address vs 31% district-wide (-20 pts) — the specific schools serving this property underperform the Hamilton County average; the district grade overstates school quality for this exact location.
- Market conditions: Rents flat; 129 active listings in the ZIP; 8 comparable units currently listed for rent nearby; rentals at typical pace (median 25d on market — plan ~3-4 weeks tenant-placement turnaround); 2,133 units permitted in Hamilton County in 2024 (405 in 5+ unit buildings).
Forward outlook
- Local home prices are declining (-3.0%/yr); year-one equity from $1k of loan paydown is wiped out by about $5k of value loss. Plan a longer hold.
- Hamilton County population projected at +23% by 2050 — long-run rental-demand tailwind backs the buy-and-hold thesis.
Negotiation context
- It's been on market 96 days — a 9% lower offer ($164k) is reasonable based on typical stale-listing flexibility.
- 3 sale attempts since 25y ago; this cycle's ask has dropped $20k (10%) from the opening price — seller is motivated, your offer sets the floor, not the list.
- Current owner paid $125k; 44% above their basis — modest negotiation headroom, anchor on the comps not their cost.
Risks & watch-outs
- Watch-outs: built in 1910 — expect roof / HVAC / electrical / plumbing capex.
- Climate carrying-cost: extreme-heat days projected 7→19/yr by 2055 (HVAC capex compounding) — expect insurance premiums to compound above CPI over the hold.
Questions for the listing agent
- It's been on market 96 days. Have you received any prior offers? Is the seller open to a 9% concession, seller financing, or rate buy-down credit?
- Built in 1910 — when were the roof, HVAC, electrical panel, plumbing, and water heater last replaced?
- Why hasn't it sold? Are there any deal-killer items the seller is aware of (foundation, flood, title, zoning, code violations)?
- Is there a deadline driving the sale (1031 exchange, divorce, estate, relocation)? That informs how much negotiation room exists.
- Schools are F-rated, which usually means shorter tenancies and higher turnover. Who's the typical renter profile here, and what's been the actual vacancy rate?
- Crime grade is F in this area — have there been break-ins, vandalism, or insurance claims at this property in the last 3 years? What carrier currently insures it and at what premium?
- What's the average days-on-market for RENTAL listings here right now (not sales)? A rising rental-DOM trend means longer vacancies and softer asking-rent achievability than the comps imply.
- What's the recent tenant-quality profile in this submarket — average credit score on applications, eviction rate, late-payment / NSF rate, and stable-employment percentage? A property-management company in the area should have these aggregated.
- How much new for-sale + rental construction is in the pipeline within 1–3 miles? Heavy new supply typically softens prices + rents 12–24 months out; constrained supply supports both.
Investment metrics
- 1% rule
- 1.06% ✓
- Cap rate
- 9.26%
- Cash-on-cash
- 10.61%
- DSCR
- 1.47
- GRM
- 7.8
CMA / ARV
- ARV (on-the-fly)
- $348,864
- Comps found
- 4
Show comp detail 4 sales within ~0.75 mi
| Address | Dist | Beds/Ba | Sqft | Sold | Price | $/sf | Match |
|---|---|---|---|---|---|---|---|
| 4303 Kemp Dr | 0.37mi | 4/3.0 | 1,896 (-14%) | 3mo | $300,000 | $158 | 57 |
| 827 Woodmore Cir | 0.23mi | 3/2.0 (-1) | 1,906 (-14%) | 12mo | $265,000 | $139 | 48 |
| 303 Peachbloom Dr | 0.70mi | 5/3.5 (+1) | 2,268 (+3%) | 21mo | $439,000 | $194 | 38 |
| 4800 Tomahawk Trl | 0.67mi | 3/2.0 (-1) | 1,926 (-13%) | 21mo | $299,000 | $155 | 21 |
Match score weights: distance 35% · size 25% · config 20% · recency 20%. Top-matched comps best support the ARV.
Projected returns pro-forma
-3.0% appreciation · 0.73% rent growth · sell at horizon
- IRR
- -2.8%
- Equity multiple
- 0.90×
- Total profit
- $-5,155
- Equity at exit
- $26,824
- IRR
- 4.5%
- Equity multiple
- 1.30×
- Total profit
- $14,926
- Equity at exit
- $15,554
Cash invested: $50,372 (down + closing). Projections, not guarantees.
Landlord ↔ Tenant lean methodology
- Overall (STATE)
- 87 Strongly Landlord-Friendly
- State Tennessee
- 87 Strongly Landlord-Friendly · R+13
- County
- — inherits STATE
- City
- — inherits STATE
ZIP-level market 37411
- Rents YoY
- 0.7%
- Active inventory
- 129
- Price-to-rent
- 7.8×
Monthly cashflow live
- Estimated rent
- $1,916 high interval (Pro) →
- Mortgage (P&I)
- −$943
- Tax from tax record
- −$50 /mo · $599/yr
- Insurance
- −$75
- HOA
- −$0
- Vacancy / Maint / Mgmt
- −$402
- Net cashflow
- $445
Break-even live
Sensitivity live
| Price | -10% $547 | -5% $496 | +0% $445 | +5% $394 | +10% $343 |
|---|---|---|---|---|---|
| Rent | -10% $294 | -5% $370 | +0% $445 | +5% $521 | +10% $597 |
| Rate | -1.0pp $536 | -0.5pp $491 | base $445 | +0.5pp $399 | +1.0pp $351 |
UW: 25.0% down · 7.5% · 30yr · 1.5% tax · 5.0% vac · 8.0% maint · 8.0% mgmt
Financing live
Cash to close
- Down payment
- $44,975
- Closing costs
- $5,397
- Reserves months
- —
- Total cash needed
- —
Loan-product check · same deal, 3 products live
Conventional
25% down · 7.5% · 30yr
- Down + closing
- —
- Monthly P&I
- —
- Monthly cashflow
- —
- DSCR
- —
- Eligible?
- —
Personal DTI + credit; lowest rate.
DSCR
20% down · 8.5% · 30yr
- Down + closing
- —
- Monthly P&I
- —
- Monthly cashflow
- —
- DSCR
- —
- Eligible?
- —
No personal income docs; deal must DSCR.
Hard money
10% down · 12.0% · 12mo
- Down + closing
- —
- Monthly P&I
- —
- Monthly cashflow
- —
- DSCR
- —
- Eligible?
- —
Short-term bridge; refi at stabilization.
Rent comps 8 comps
| Address | Beds | Baths | Sqft | Rent | $/sqft | DOM | Units | Dist |
|---|---|---|---|---|---|---|---|---|
| 4224 Victory St Chattanooga, TN | 3.0 | 2.0 | 1736 | $1,995 | $1.15 | 25d | 1 | 0.32mi |
| 3518 Ridgeside Rd Chattanooga, TN | 4.0 | 2.0 | 1409 | $1,375 | $0.98 | 25d | 1 | 0.74mi |
| 409 Booth Rd Chattanooga, TN | 3.0 | 2.0 | 1530 | $1,695 | $1.11 | 25d | 1 | 0.86mi |
| 5008 Golfview Dr Chattanooga, TN | 3.0 | 2.0 | 1830 | $1,853 | $1.01 | 25d | 1 | 1.05mi |
| 3868 Mark Twain Cir Chattanooga, TN | 4.0 | 2.0 | 1841 | $1,775 | $0.96 | 25d | 1 | 1.19mi |
| 211 N Saint Marks Ave Chattanooga, TN | 3.0 | 2.0 | 1485 | $1,600 | $1.08 | 15d | 1 | 1.27mi |
| 3617 Monte Vista Dr Chattanooga, TN | 3.0 | 2.0 | 1628 | $1,823 | $1.12 | 15d | 1 | 1.27mi |
| 111 N Seminole Dr Chattanooga, TN | 4.0 | 2.0 | 1500 | $2,200 | $1.47 | 25d | 1 | 1.40mi |
Listing history 24 events
-
2026-06-22days on market $179,900 Active 96 DOM
-
2026-06-18days on market $179,900 Active 93 DOM
-
2026-06-17days on market $179,900 Active 92 DOM
-
2026-06-16days on market $179,900 Active 91 DOM
-
2026-06-15days on market $179,900 Active 90 DOM
-
2026-06-14days on market $179,900 Active 88 DOM
-
2026-06-10days on market $179,900 Active 85 DOM
-
2026-06-09days on market $179,900 Active 84 DOM
-
2026-06-08days on market $179,900 Active 83 DOM
-
2026-06-07days on market $179,900 Active 82 DOM
-
2026-06-05days on market $179,900 Active 79 DOM
-
2026-06-03days on market $179,900 Active 78 DOM
-
2026-06-02days on market $179,900 Active 77 DOM
-
2026-06-01days on market $179,900 Active 76 DOM
-
2026-05-31days on market $179,900 Active 75 DOM
-
2026-05-30days on market $179,900 Active 74 DOM
-
2026-05-18price $179,900
-
2026-04-14price $189,900
-
2026-03-18$199,900 Active
-
2020-11-18soldstatus $125,000
-
2006-12-19soldstatus $131,000
-
2005-11-14$103,000
-
2001-03-06$99,900
-
1988-10-14soldstatus $54,000
ⓘ Source: listings_history table (triggers on properties + properties_extension) + one-shot
backfill from property_details.listing_events for pre-trigger history.
Tax reassessment forecast TN · Resets to sale price
- Current annual tax
- $599 · $50/mo
- Projected year-2 tax
- $1,277 · $106/mo
- Expected delta
- +$678/yr (+$57/mo · 113.2%)
ⓘ Screening estimate from a state-policy table — verify with the county assessor before closing.
Climate risk First Street
- Flood 1/10 Low FEMA zone X (unshaded) · 0% chance over 30 yrs
- Wildfire 1/10 Low
- Heat 6/10 Major 7 d/yr ≥105°F today · 19 d/yr by 30 yrs out
- Wind 4/10 Moderate 13% chance of damaging wind over 30 yrs
- Air quality 3/10 Moderate 2 unhealthy d/yr today · 2 by 30 yrs out
Nearby sold comps map
Loading sold comps map…
Walkable amenities ~0.75 mi
Loading nearby amenities…
Taxation est. · year 1
- Rental income
- $22,990
- − Mortgage interest
- −$10,077
- − Property taxes
- −$599
- − Insurance
- −$900
- − Repairs & maintenance
- −$1,839
- − Management
- −$1,839
- − Depreciation
- −$5,233
- Taxable income
- $2,502
- Est. tax owed @ 24.0%
- −$601
- After-tax cash flow
- $4,742/yr
For passive investors: Depreciation is non-cash, so a rental often shows a tax loss while cash-flowing — sheltering income. Rental losses are passive: they offset passive income freely, and up to $25,000/yr can offset ordinary (W-2) income if you actively participate and your MAGI is under $100k (phasing out to $0 by $150k); unused losses carry forward. On sale, claimed depreciation is recaptured at up to 25%, and gains may owe capital-gains tax (a 1031 exchange can defer both). Figures are a year-1 estimate at your 24.0% rate — not tax advice; consult a CPA.
Schools (NCES district)
- District
- Hamilton County
- NCES district ID
- 4701590
- Math proficiency
- 31% ▼ -10.00%
- Reading proficiency
- 31% ▼ -3.00%
- Median HH income
- $47,456
- Composite
- 26.8/100
- National rank
- #7122
- State rank
- #42 of 139 in TN
Livability — Chattanooga
- Score
- 78/100
- State rank
- #3
- US rank
- #2582
Category grades
Schools grade is shown separately in the Schools card above.
Census & demographics
- Census place
- Chattanooga, TN
- County
- Hamilton County · 312,777 people
- City population
- 131,999
- Metro
- Chattanooga, TN-GA
- Population (ZIP)
- 18,997
- Household income
- $56,579
- Rent vs Own
- Severe rent burden
- 685.0
Population outlook (Hamilton County) Hauer SSP2
- Today (2025)
- 393,784 people
- By 2030
- 412,983 · +4.9%
- By 2040
- 449,502 · +14.1%
- By 2050
- 484,341 · +23.0%
- By 2075
- 565,746 · +43.7%
- By 2100
- 618,394 · +57.0%
Race, ethnicity, and origin ACS 2023
- Neighborhood character
- Diverse neighborhood (Simpson 0.63)
- Race & ethnicity
- Black 48% White 37% Hispanic / Latino 8% Two or more races 7%
- Hispanic origin (detail)
- Mexican 3% Puerto Rican 2%
- Common ancestry
- Italian 2% Slovak 2% Romanian 1%
- Foreign-born
- 4% · Canada, Vietnam
- Languages at home
- 92% English-only · Spanish 6% Arabic 0%
Political lean MEDSL · Hamilton
- 2024 margin
- R (+13.1) · D 42.7% · R 55.7% · Other 1.6%
- 2008→2024 swing
- -1.2pp toward R · 2008: -11.8pp · 2024: -13.1pp
- All cycles
- 2024: R+13.1 2020: R+9.7 2016: R+16.6 2012: R+14.8 2008: R+11.8
Not yet ingested
- Civics
- —
Market trends
- HPI YoY
- ▼ -190.85%
- Current HPI
- 240.2557
- Rent YoY
- ▲ 0.73%
- Metro
- Chattanooga, TN-GA
- State GDP YoY
- ▲ 2.78%
- F500 in state
- 22
Industry mix (Fortune 500 HQ in TN)
| Industry | F500 HQs | Revenue |
|---|---|---|
| Healthcare | 3 | $91B |
|
||
| Retail | 3 | $72B |
|
||
| Transportation / Logistics | 1 | $88B |
|
||
| Paper / Packaging | 1 | $19B |
|
||
| Insurance | 1 | $13B |
|
||
| Energy | 1 | $12B |
|
||
Price history
+233.1% since first listed8 events — show timeline
- 2026-05-18 Price Changed $179,900 GCAR
- 2026-04-14 Price Changed $189,900 GCAR
- 2026-03-18 Listed $199,900 GCAR
- 2020-11-18 Sold (Public Records) $125,000 Public Records
- 2006-12-19 Sold (Public Records) $131,000 Public Records
- 2005-11-14 Listed $103,000 RCAOR
- 2001-03-06 Listed $99,900 RCAOR
- 1988-10-14 Sold (Public Records) $54,000 Public Records
Property tax history
+0.5%/yrLatest (2025): $599 · -1.0% YoY. Source: county tax records.
Cash-flow waterfall
monthlySold comps — $/sqft
last 12 mo · ≤1 miLoading sold comps…