2313 Pinegrove Cir · Cleveland, FL
Flood risk 7/10 · Major
- FEMA flood zone
- X (shaded)
- Chance of flooding over 30 yrs
- 0.75%
- Est. flood insurance / yr
- $507 – $1,088
Fire risk 5/10 · Moderate
- Est. fire insurance / yr
- $947 – $1,759
Heat risk 10/10 · Severe
- Hot days now (above 108°F)
- 7 days/yr
- Hot days in 30 yrs
- 27 days/yr
Wind risk 10/10 · Severe
- Chance of severe wind over 30 yrs
- 99.0%
Air-quality risk 2/10 · Minimal
- Unhealthy air days now
- 2 days/yr
- Unhealthy air days in 30 yrs
- 2 days/yr
Risk factors via First Street. Map © Google.
Why this score? — see what drove the C+ grade
The composite is a weighted blend of 9 inputs, each scored 0–100. Each bar is that input's sub-score; the figure is the points it added to the 100-point composite (weight × sub-score).
- Cash flow +20.5/30.0
- ARV discount +15.0/15.0
- DSCR +6.5/10.0
- 1% rule +5.2/10.0
- Schools +4.6/10.0
- Rent growth +3.5/5.0
- Livability +3.4/5.0
- Condition / age +2.5/5.0
- Appreciation +2.4/10.0
$205,000
🖨 Deal sheet 📄 Offer letter ✓ Due diligence
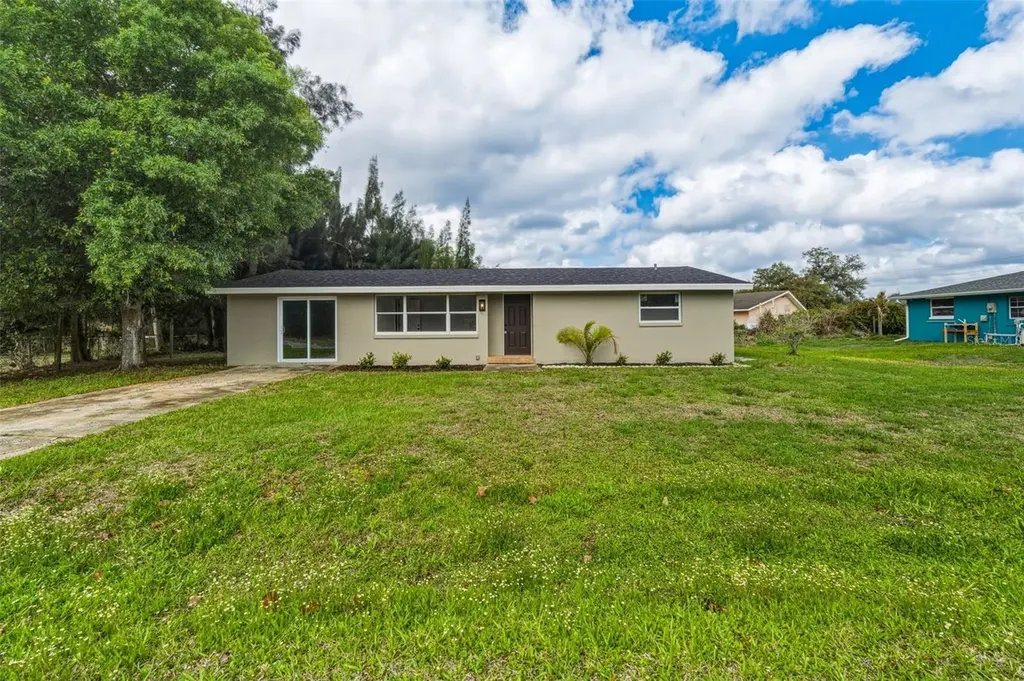
Listing remarks
Under contract-accepting backup offers. PRICED TO SELL! GREAT STARTER HOME OR INCOME OPPORTUNITY! REMODELED 3 bedroom, 2 bath home just 10 minutes from downtown Punta Gorda. Updates include new luxury vinyl flooring throughout, new drywall and paint, new plumbing, new fixtures plus light cabinetry in kitchen, stone counters and stainless appliances. Primary bedroom features walk-in closet with barn door and updated private bath with walk-in shower. Split floor plan features separate hall to two guest bedrooms, one with walk-in closet and a separate updated guest bath with dual sinks and shower/tub combination. Flexible bonus room adds additional living space to the home and features laundry
Key facts
- 9,878 sq ft lot
- Built 1968
- Listed 5 days
Property features AI
Finance
- Other: Property zoned RSF3.5; Furnished: Unfurnished; Pets allowed
- HOA & community: No association
Exterior
- Utilities: Well water; Septic tank; High-speed internet available; Electricity connected
- Home design: Single-family residence; One story; Faces east
- Construction: Block and stucco construction; Shingle roof; Slab foundation; Built on less than 1/4 acre lot
- Exterior features: Private mailbox; Sliding doors; Landscaped lot; Paved surfaces/driveway
Interior
- Kitchen: Dishwasher; Microwave; Range; Refrigerator; Electric water heater
- Bedrooms: 3 bedrooms
- Bathrooms: 2 full bathrooms
- Heating & cooling: Central heating (electric); Central air conditioning
- Interior features: Open floorplan; Living room/dining room combo; Walk-in closets; Family room
- Laundry & utility: Laundry: Other
Neighborhood map
What this means for you Summary
Snapshot
- This is a 2-bed/2.0-bath single-family listed at $205k.
Deal economics
- At list price, monthly cash flow is $202 ($2k/yr) — positive.
- The deal already cash-flows at list — no discount required.
- Meets the 1% rule at list price ($2k rent vs $205k).
- Cap rate 7.9% vs local median 4.8% in Cleveland — top-decile yield for the area; either an underpriced asset or a hidden risk that comps aren't pricing in. Stress-test before assuming the spread holds.
Location & tenants
- Location reads 67/100 on livability (#574 in FL) — a middle-class / working-renter tenant base. Strengths: crime A+, cost of living A+, housing A+; Watch: employment D, amenities F, commute F.
- Charlotte (suburban): math 54% / reading 54% proficiency, ranked #22 of 73 in FL (top 30%) — acceptable for families but not a draw, mixed tenant base, ~2y average lease.
- Zoned schools: East Elementary School (math 67% / reading 68%, grade B+, #435 of 2,144 statewide, top 21%, 761 students, 52% FRL); Charlotte High School (math 44% / reading 46%, grade D-, #228 of 667 statewide, top 35%, 1,994 students, 41% FRL).
- Market conditions: Rents rising fast (+4.1%/yr); 1037 active listings in the ZIP; 1 comparable units currently listed for rent nearby; 4,585 units permitted in Charlotte County in 2024 (703 in 5+ unit buildings).
- This rent runs 35% of the median local income ($72k/yr) — at the standard rent-burdened threshold; future hikes will face affordability resistance.
Forward outlook
- Local home prices are declining (-3.0%/yr); year-one equity from $1k of loan paydown is wiped out by about $6k of value loss. Plan a longer hold.
- Charlotte County population projected at +24% by 2050 — long-run rental-demand tailwind backs the buy-and-hold thesis.
Negotiation context
- Only 5 days on market — expect competitive offers; lowballing is unlikely to land.
- 3 sale attempts since 8y ago with the ask held roughly flat each time — persistent listings suggest the price (not the market) is what's stuck; bring a comps-based counter.
Risks & watch-outs
- Watch-outs: flood insurance adds $66/mo.
- Climate carrying-cost: major flood risk; severe wind risk, 99% chance of damaging wind over 30y; moderate wildfire risk; extreme-heat days projected 7→27/yr by 2055 (HVAC capex compounding) — expect insurance premiums to compound above CPI over the hold.
Questions for the listing agent
- Built in 1968 — when were the roof, HVAC, electrical panel, plumbing, and water heater last replaced?
- What's the actual annual flood-insurance premium (NFIP or private), and is the property in a SFHA with mandatory coverage?
- Is there a deadline driving the sale (1031 exchange, divorce, estate, relocation)? That informs how much negotiation room exists.
- Schools are F-rated, which usually means shorter tenancies and higher turnover. Who's the typical renter profile here, and what's been the actual vacancy rate?
- What's the average days-on-market for RENTAL listings here right now (not sales)? A rising rental-DOM trend means longer vacancies and softer asking-rent achievability than the comps imply.
- What's the recent tenant-quality profile in this submarket — average credit score on applications, eviction rate, late-payment / NSF rate, and stable-employment percentage? A property-management company in the area should have these aggregated.
- How much new for-sale + rental construction is in the pipeline within 1–3 miles? Heavy new supply typically softens prices + rents 12–24 months out; constrained supply supports both.
Investment metrics
- 1% rule
- 1.02% ✓
- Cap rate
- 7.86%
- Cash-on-cash
- 5.61%
- DSCR
- 1.25
- GRM
- 8.2
CMA / ARV
- ARV (on-the-fly)
- $251,090
- Comps found
- 1
Show comp detail 1 sale within ~0.75 mi
| Address | Dist | Beds/Ba | Sqft | Sold | Price | $/sf | Match |
|---|---|---|---|---|---|---|---|
| 8029 Roy Dr | 0.30mi | 2/2.0 | 1,163 (-2%) | 15mo | $245,000 | $211 | 70 |
Match score weights: distance 35% · size 25% · config 20% · recency 20%. Top-matched comps best support the ARV.
Projected returns pro-forma
-3.0% appreciation · 4.13% rent growth · sell at horizon
- IRR
- -8.4%
- Equity multiple
- 0.69×
- Total profit
- $-17,887
- Equity at exit
- $30,566
- IRR
- 2.6%
- Equity multiple
- 1.20×
- Total profit
- $11,324
- Equity at exit
- $17,725
Cash invested: $57,400 (down + closing). Projections, not guarantees.
Landlord ↔ Tenant lean methodology
- Overall (STATE)
- 87 Strongly Landlord-Friendly
- State Florida
- 87 Strongly Landlord-Friendly · R+3
- County
- — inherits STATE
- City
- — inherits STATE
ZIP-level market 33982
- Home prices YoY
- -1.2%
- Rents YoY
- 4.1%
- Active inventory
- 1037
- Price-to-rent
- 8.2×
Monthly cashflow live
- Estimated rent
- $2,094 medium interval (Pro) →
- Mortgage (P&I)
- −$1,075
- Tax from tax record
- −$225 /mo · $2,704/yr
- Insurance
- −$85
- Flood insurance flood zone
- −$66 /mo · $798/yr
- HOA
- −$0
- Vacancy / Maint / Mgmt
- −$440
- Net cashflow
- $202
Break-even live
UW: 25.0% down · 7.5% · 30yr · 1.5% tax · 5.0% vac · 8.0% maint · 8.0% mgmt
Financing live
Cash to close
- Down payment
- $51,250
- Closing costs
- $6,150
- Reserves months
- —
- Total cash needed
- —
Loan-product check · same deal, 3 products live
Conventional
25% down · 7.5% · 30yr
- Down + closing
- —
- Monthly P&I
- —
- Monthly cashflow
- —
- DSCR
- —
- Eligible?
- —
Personal DTI + credit; lowest rate.
DSCR
20% down · 8.5% · 30yr
- Down + closing
- —
- Monthly P&I
- —
- Monthly cashflow
- —
- DSCR
- —
- Eligible?
- —
No personal income docs; deal must DSCR.
Hard money
10% down · 12.0% · 12mo
- Down + closing
- —
- Monthly P&I
- —
- Monthly cashflow
- —
- DSCR
- —
- Eligible?
- —
Short-term bridge; refi at stabilization.
Rent comps 1 comps
| Address | Beds | Baths | Sqft | Rent | $/sqft | DOM | Units | Dist |
|---|---|---|---|---|---|---|---|---|
| 2921 Wilson Ave Punta Gorda, FL | 2.0 | 1.0 | 832 | $1,800 | $2.16 | 13d | 1 | 0.34mi |
Listing history 7 events
-
2026-04-13status Pending
-
2026-04-08$205,000 Active
-
2018-09-02historical
-
2018-05-14price $118,000
-
2018-05-14status Active
-
2018-05-13historical
-
2018-01-03$133,000 Active
ⓘ Source: listings_history table (triggers on properties + properties_extension) + one-shot
backfill from property_details.listing_events for pre-trigger history.
Tax reassessment forecast FL · Resets to sale price
- Current annual tax
- $2,704 · $225/mo
- Projected year-2 tax
- $2,704 · $225/mo
- Expected delta
- $0/yr ($0/mo · 0.0%)
ⓘ Screening estimate from a state-policy table — verify with the county assessor before closing.
Climate risk First Street
- Flood 7/10 Severe FEMA zone X (shaded) · 75% chance over 30 yrs
- Wildfire 5/10 Major
- Heat 10/10 Extreme 7 d/yr ≥108°F today · 27 d/yr by 30 yrs out
- Wind 10/10 Extreme 99% chance of damaging wind over 30 yrs
- Air quality 2/10 Low 2 unhealthy d/yr today · 2 by 30 yrs out
Nearby sold comps map
Loading sold comps map…
Walkable amenities ~0.75 mi
Loading nearby amenities…
Taxation est. · year 1
- Rental income
- $25,130
- − Mortgage interest
- −$11,483
- − Property taxes
- −$2,704
- − Insurance
- −$1,822
- − Repairs & maintenance
- −$2,010
- − Management
- −$2,010
- − Depreciation
- −$5,964
- Taxable loss
- −$865
- Est. tax savings @ 24.0%
- +$208
- After-tax cash flow
- $2,633/yr
For passive investors: Depreciation is non-cash, so a rental often shows a tax loss while cash-flowing — sheltering income. Rental losses are passive: they offset passive income freely, and up to $25,000/yr can offset ordinary (W-2) income if you actively participate and your MAGI is under $100k (phasing out to $0 by $150k); unused losses carry forward. On sale, claimed depreciation is recaptured at up to 25%, and gains may owe capital-gains tax (a 1031 exchange can defer both). Figures are a year-1 estimate at your 24.0% rate — not tax advice; consult a CPA.
Schools (NCES district)
- District
- Charlotte
- NCES district ID
- 1200240
- Math proficiency
- 54% ▼ -6.00%
- Reading proficiency
- 54% ▼ -1.00%
- Median HH income
- $44,864
- Composite
- 45.62/100
- National rank
- #2586
- State rank
- #22 of 73 in FL
Livability — Cleveland
- Score
- 67/100
- State rank
- #574
- US rank
- #10905
Category grades
Schools grade is shown separately in the Schools card above.
Census & demographics
- Census place
- Cleveland, FL
- County
- Charlotte County · 196,994 people
- Metro
- Punta Gorda, FL
- Population (ZIP)
- 13,006
- Household income
- $72,443
- Rent vs Own
- Severe rent burden
- 43.0
Population outlook (Charlotte County) Hauer SSP2
- Today (2025)
- 198,646 people
- By 2030
- 210,507 · +6.0%
- By 2040
- 230,857 · +16.2%
- By 2050
- 247,148 · +24.4%
- By 2075
- 281,777 · +41.8%
- By 2100
- 293,609 · +47.8%
Race, ethnicity, and origin ACS 2023
- Neighborhood character
- Predominantly White (81%)
- Race & ethnicity
- White 81% Two or more races 8% Hispanic / Latino 7% Black 7%
- Hispanic origin (detail)
- Puerto Rican 2% Cuban 3%
- Common ancestry
- Lithuanian 3% Iranian 3% Slovak 3%
- Foreign-born
- 6% · Canada, Jamaica
- Languages at home
- 93% English-only · Spanish 5% German/W. Germanic 1% Arabic 1%
Political lean MEDSL · Charlotte
- 2024 margin
- Solid R (+34.0) · D 32.7% · R 66.7%
- 2008→2024 swing
- -26.7pp toward R · 2008: -7.2pp · 2024: -34.0pp
- All cycles
- 2024: R+34.0 2020: R+26.6 2016: R+27.8 2012: R+14.3 2008: R+7.2
Not yet ingested
- Civics
- —
Market trends
- HPI YoY
- ▼ -5.25%
- Current HPI
- 448.5895
- Rent YoY
- ▲ 4.13%
- Metro
- Punta Gorda, FL
- State GDP YoY
- ▲ 3.28%
- F500 in state
- 36
Industry mix (Fortune 500 HQ in FL)
| Industry | F500 HQs | Revenue |
|---|---|---|
| Industrial Technology | 2 | $29B |
|
||
| Insurance | 2 | $17B |
|
||
| Retail | 1 | $60B |
|
||
| Technology Distribution | 1 | $58B |
|
||
| Homebuilding | 1 | $35B |
|
||
| Technology Manufacturing | 1 | $35B |
|
||
Price history
+54.1% since first listed7 events — show timeline
- 2026-04-13 Pending — Stellar MLS as Distributed by MLS Grid
- 2026-04-08 Listed $205,000 Stellar MLS as Distributed by MLS Grid
- 2018-09-02 Listing Removed — Stellar MLS as Distributed by MLS Grid
- 2018-05-14 Price Changed $118,000 Stellar MLS as Distributed by MLS Grid
- 2018-05-14 Relisted — Stellar MLS as Distributed by MLS Grid
- 2018-05-13 Listing Removed — Stellar MLS as Distributed by MLS Grid
- 2018-01-03 Listed $133,000 Stellar MLS as Distributed by MLS Grid
Property tax history
+11.3%/yrLatest (2025): $2,704 · -17.5% YoY. Source: county tax records.
Cash-flow waterfall
monthlySold comps — $/sqft
last 12 mo · ≤1 miLoading sold comps…