272 Araby St · Palm Springs, CA
Flood risk 1/10 · Minimal
- FEMA flood zone
- X
- Chance of flooding over 30 yrs
- 0.0%
- Est. flood insurance / yr
- $507 – $1,088
Fire risk 5/10 · Moderate
- Est. fire insurance / yr
- $659 – $1,223
Heat risk 9/10 · Severe
- Hot days now (above 110°F)
- 9 days/yr
- Hot days in 30 yrs
- 26 days/yr
Wind risk 1/10 · Minimal
- Chance of severe wind over 30 yrs
- —
Air-quality risk 5/10 · Moderate
- Unhealthy air days now
- 6 days/yr
- Unhealthy air days in 30 yrs
- 8 days/yr
Risk factors via First Street. Map © Google.
Why this score? — see what drove the B grade
The composite is a weighted blend of 9 inputs, each scored 0–100. Each bar is that input's sub-score; the figure is the points it added to the 100-point composite (weight × sub-score).
- Cash flow +27.8/30.0
- ARV discount +15.0/15.0
- DSCR +9.8/10.0
- 1% rule +7.6/10.0
- Livability +3.3/5.0
- Schools +2.7/10.0
- Condition / age +2.5/5.0
- Rent growth +2.4/5.0
- Appreciation +0.0/10.0
$195,000
🖨 Deal sheet (PDF) 📄 Offer letter ✓ Due diligence
Listing remarks MLS
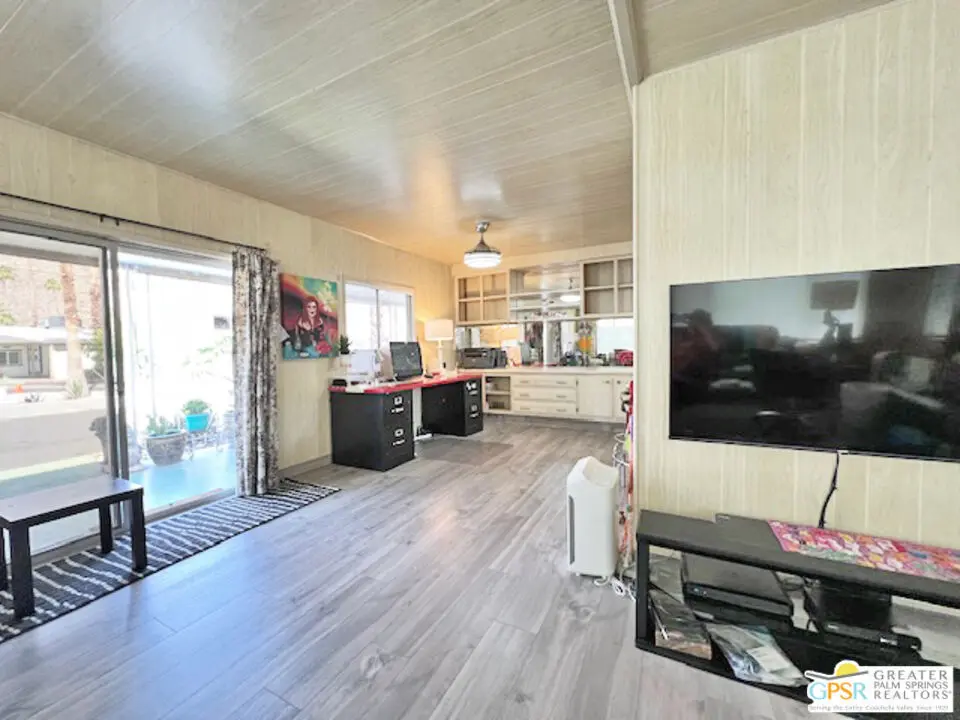
This park is owned by a non-profit corporation in the business of owning mobile home parks. 272 Araby St is located in Sahara Park, a senior community under rent control. Mobile home is a 1967 Goldenwest double wide coach with two bedrooms, two bathrooms, each remodeled in tile, open living room to dining area/office, and vintage kitchen. Laminate flooring installed in 2023. Ceiling fan with light and disappearing blades when not in use, central air and heat, stacking washer and dryer, oven, range and breakfast bar in the kitchen. Front and back covered patios the whole length of the unit with stunning Mountain Views from the front patio. Back yard has a block wall. Park amenities: Pool, spa, clubhouse with card room, TV room, library, full kitchen, stage, meeting room, and electronic bingo board. Exercise room and many park activities. All photos are altered. Current Rent $615.19
Key facts
- Vintage kitchen
- Laminate flooring
- Open living room
Tags
Neighborhood map
What this means for you Summary
Snapshot
- This is a 2-bed/2.0-bath manufactured listed at $195k.
Deal economics
- At list price, monthly cash flow is $597 ($7k/yr) — positive.
- The deal already cash-flows at list — no discount required.
- Meets the 1% rule at list price ($2k rent vs $195k).
- Recommended offer: $177k (9.0% below list) — sets the bar for market timing.
- Cap rate 10.0% vs local median 2.7% in Palm Springs — top-decile yield for the area; either an underpriced asset or a hidden risk that comps aren't pricing in. Stress-test before assuming the spread holds.
Location & tenants
- Location reads 66/100 on livability (#348 in CA) — a middle-class / working-renter tenant base. Strengths: amenities A+, commute A+; Watch: schools C-, crime F, cost of living F.
- Palm Springs Unified (suburban): math 21% / reading 42% proficiency, ranked #328 of 517 in CA (top 63%) — families likely to look elsewhere, expect single-tenant / working-renter base with shorter leases; 73% free/reduced lunch — lower-income household profile, screen leases tightly.
- Market conditions: Rents soft (-0.4%/yr); 492 active listings in the ZIP; 40 comparable units currently listed for rent nearby; rentals at typical pace (median 25d on market — plan ~3-4 weeks tenant-placement turnaround); solid renter incomes; 9,195 units permitted in Riverside County in 2024 (1,512 in 5+ unit buildings).
- This rent runs 38% of the median local income ($78k/yr) — at the standard rent-burdened threshold; future hikes will face affordability resistance.
Forward outlook
- Local home prices are declining (-3.0%/yr); year-one equity from $1k of loan paydown is wiped out by about $6k of value loss. Plan a longer hold.
- Riverside County population projected at +22% by 2050 — long-run rental-demand tailwind backs the buy-and-hold thesis.
Negotiation context
- It's been on market 100 days — a 9% lower offer ($177k) is reasonable based on typical stale-listing flexibility.
- 8 sale attempts since 17y ago with the ask held roughly flat each time — persistent listings suggest the price (not the market) is what's stuck; bring a comps-based counter.
Risks & watch-outs
- Climate carrying-cost: moderate wildfire risk; extreme-heat days projected 9→26/yr by 2055 (HVAC capex compounding) — expect insurance premiums to compound above CPI over the hold.
Questions for the listing agent
- It's been on market 100 days. Have you received any prior offers? Is the seller open to a 9% concession, seller financing, or rate buy-down credit?
- Built in 1967 — when were the roof, HVAC, electrical panel, plumbing, and water heater last replaced?
- Why hasn't it sold? Are there any deal-killer items the seller is aware of (foundation, flood, title, zoning, code violations)?
- Is there a deadline driving the sale (1031 exchange, divorce, estate, relocation)? That informs how much negotiation room exists.
- Crime grade is F in this area — have there been break-ins, vandalism, or insurance claims at this property in the last 3 years? What carrier currently insures it and at what premium?
- What's the average days-on-market for RENTAL listings here right now (not sales)? A rising rental-DOM trend means longer vacancies and softer asking-rent achievability than the comps imply.
- What's the recent tenant-quality profile in this submarket — average credit score on applications, eviction rate, late-payment / NSF rate, and stable-employment percentage? A property-management company in the area should have these aggregated.
- How much new for-sale + rental construction is in the pipeline within 1–3 miles? Heavy new supply typically softens prices + rents 12–24 months out; constrained supply supports both.
Investment metrics
- 1% rule
- 1.26% ✓
- Cap rate
- 9.97%
- Cash-on-cash
- 13.13%
- DSCR
- 1.58
- GRM
- 6.6
CMA / ARV
- ARV (median comp)
- $277,929
- List price
- $195,000
- Delta
- -29.84%
- Verdict
- UNDERPRICED
- Comps
- 18 within 1.0 mi
Show comp detail 12 sales within ~0.75 mi
| Address | Dist | Beds/Ba | Sqft | Sold | Price | $/sf | Match |
|---|---|---|---|---|---|---|---|
| 69 Nile St | 0.10mi | 2/2.0 | 1,100 (+2%) | 1mo | $299,900 | $273 | 92 |
| 136 Mecca St | 0.13mi | 2/2.0 | 1,040 (-4%) | 5mo | $205,000 | $197 | 84 |
| 102 Caravan St | 0.10mi | 2/2.0 | 1,152 (+7%) | 3mo | $290,000 | $252 | 82 |
| 17 Araby St | 0.16mi | 2/2.0 | 1,150 (+6%) | 4mo | $450,000 | $391 | 78 |
| 810 Hila Ln | 0.20mi | 2/2.0 | 1,000 (-7%) | 3mo | $319,000 | $319 | 76 |
| 1001 Aloha Dr | 0.14mi | 2/2.0 | 1,000 (-7%) | 7mo | $305,000 | $305 | 75 |
| 90 Caravan St | 0.11mi | 2/2.0 | 960 (-11%) | 2mo | $280,000 | $292 | 75 |
| 145 Morocco St #145 | 0.15mi | 3/2.0 (+1) | 1,164 (+8%) | 4mo | $214,000 | $184 | 72 |
| 113 Pali Dr | 0.23mi | 2/2.0 | 1,040 (-4%) | 15mo | $310,000 | $298 | 71 |
| 248 Lei Dr | 0.21mi | 2/2.0 | 1,200 (+11%) | 2mo | $143,000 | $119 | 70 |
| 504 Tiki Dr | 0.23mi | 2/2.0 | 1,000 (-7%) | 14mo | $300,000 | $300 | 65 |
| 146 Morocco St | 0.16mi | 2/1.5 | 1,242 (+15%) | 14mo | $211,000 | $170 | 54 |
Match score weights: distance 35% · size 25% · config 20% · recency 20%. Top-matched comps best support the ARV.
Projected returns pro-forma
-3.0% appreciation · 0.0% rent growth · sell at horizon
- IRR
- -0.4%
- Equity multiple
- 0.99×
- Total profit
- $-735
- Equity at exit
- $29,075
- IRR
- 5.9%
- Equity multiple
- 1.38×
- Total profit
- $20,612
- Equity at exit
- $16,860
Cash invested: $54,600 (down + closing). Projections, not guarantees.
Landlord ↔ Tenant lean methodology
- Overall (STATE)
- 18 Strongly Tenant-Friendly
- State California
- 18 Strongly Tenant-Friendly · D+13
- County
- — inherits STATE
- City
- — inherits STATE
ZIP-level market 92264
- Rents YoY
- -0.4%
- Active inventory
- 492
- Price-to-rent
- 6.6×
Monthly cashflow live
- Estimated rent
- $2,462 high interval (Pro) →
- Mortgage (P&I)
- −$1,023
- Tax est. 1.5%
- −$244 /mo · $2,925/yr
- Insurance
- −$81
- HOA
- −$0
- Vacancy / Maint / Mgmt
- −$517
- Net cashflow
- $597
Break-even live
Sensitivity live
| Price | -10% $732 | -5% $665 | +0% $597 | +5% $530 | +10% $463 |
|---|---|---|---|---|---|
| Rent | -10% $403 | -5% $500 | +0% $597 | +5% $695 | +10% $792 |
| Rate | -1.0pp $695 | -0.5pp $647 | base $597 | +0.5pp $547 | +1.0pp $495 |
UW: 25.0% down · 7.5% · 30yr · 1.5% tax · 5.0% vac · 8.0% maint · 8.0% mgmt
Financing live
Cash to close
- Down payment
- $48,750
- Closing costs
- $5,850
- Reserves months
- —
- Total cash needed
- —
Loan-product check · same deal, 3 products live
Conventional
25% down · 7.5% · 30yr
- Down + closing
- —
- Monthly P&I
- —
- Monthly cashflow
- —
- DSCR
- —
- Eligible?
- —
Personal DTI + credit; lowest rate.
DSCR
20% down · 8.5% · 30yr
- Down + closing
- —
- Monthly P&I
- —
- Monthly cashflow
- —
- DSCR
- —
- Eligible?
- —
No personal income docs; deal must DSCR.
Hard money
10% down · 12.0% · 12mo
- Down + closing
- —
- Monthly P&I
- —
- Monthly cashflow
- —
- DSCR
- —
- Eligible?
- —
Short-term bridge; refi at stabilization.
Rent comps 40 comps
| Address | Beds | Baths | Sqft | Rent | $/sqft | DOM | Units | Dist |
|---|---|---|---|---|---|---|---|---|
| 1041 S La Verne Way Palm Springs, CA | 2.0 | 2.0 | 1325 | $2,800 | $2.11 | 25d | 1 | 0.24mi |
| 120 Pali Dr Palm Springs, CA | 2.0 | 2.0 | 835 | $2,200 | $2.63 | 22d | 1 | 0.25mi |
| 2220 S Calle Palo Fierro #23 Palm Springs, CA | 2.0 | 2.0 | 1200 | $2,995 | $2.50 | 11d | 1 | 0.27mi |
| 451 E Via Carisma #72 Palm Springs, CA | 2.0 | 2.0 | 1170 | $2,200 | $1.88 | 25d | 1 | 0.33mi |
| 1900 S Palm Canyon Dr #42 Palm Springs, CA | 2.0 | 2.0 | 1024 | $2,500 | $2.44 | 44d | 1 | 0.34mi |
| 251 E La Verne Way Unit F Palm Springs, CA | 2.0 | 2.0 | 1345 | $2,550 | $1.90 | 25d | 1 | 0.36mi |
| 1950 S Palm Canyon Dr Palm Springs, CA | 1.0–2.0 | 1.0–2.0 | 902 | $2,500 | $2.77 | 44d | 2 | 0.38mi |
| 1950 S Palm Canyon Dr Palm Springs, CA | 1.0–2.0 | 1.0–2.0 | 902 | $2,645 | $2.93 | 2d | 3 | 0.38mi |
| 780 E Palm Canyon Dr #202 Palm Springs, CA | 2.0 | 2.0 | 1305 | $2,950 | $2.26 | 25d | 1 | 0.40mi |
| 250 E San Jose Rd Palm Springs, CA | 2.0–3.0 | 2.0 | 1187 | $2,199 | $1.85 | 44d | 2 | 0.48mi |
| 250 E San Jose Rd #63 Palm Springs, CA | 2.0 | 2.0 | 1152 | $2,400 | $2.08 | 25d | 1 | 0.48mi |
| 1150 E Palm Canyon Dr #60 Palm Springs, CA | 2.0 | 2.0 | 1240 | $2,595 | $2.09 | 25d | 1 | 0.51mi |
| 1400 E Palm Canyon Dr Unit 113 Palm Springs, CA | 1.0 | 1.0 | 800 | $1,995 | $2.49 | 44d | 1 | 0.58mi |
| 1428 S Camino Real Palm Springs, CA | 2.0 | 2.0 | 1054 | $2,300 | $2.18 | 44d | 1 | 0.59mi |
| 1530 E Palm Canyon Dr Unit 209 Palm Springs, CA | 2.0 | 2.0 | 740 | $2,595 | $3.51 | 4d | 1 | 0.62mi |
| 1486 E Palm Tree Dr Palm Springs, CA | 2.0 | 2.0 | 1300 | $3,000 | $2.31 | 44d | 1 | 0.63mi |
| 1655 E Palm Canyon Dr Palm Springs, CA | 1.0 | 1.0 | 755 | $2,122 | $2.81 | 44d | 3 | 0.65mi |
| 1655 E Palm Canyon Dr Palm Springs, CA | 1.0 | 1.0 | 755 | $2,000 | $2.65 | 8d | 3 | 0.65mi |
| 1655 E Palm Canyon Dr Palm Springs, CA | 1.0 | 1.0 | 755 | $2,350 | $3.11 | 25d | 2 | 0.65mi |
| 1425 Via Soledad Unit 1 Palm Springs, CA | 2.0 | 2.0 | 1050 | $2,500 | $2.38 | 25d | 1 | 0.67mi |
| 1425 Via Soledad Unit 1 Palm Springs, CA | 2.0 | 2.0 | 1050 | $2,500 | $2.38 | 44d | 1 | 0.67mi |
| 255 E Avenida Granada #525 Palm Springs, CA | 2.0 | 2.0 | 1198 | $2,195 | $1.83 | 19d | 1 | 0.80mi |
| 255 E Avenida Granada #324 Palm Springs, CA | 2.0 | 2.0 | 1198 | $2,100 | $1.75 | 8d | 1 | 0.80mi |
| 2600 S Palm Canyon Dr Palm Springs, CA | 2.0 | 1.5–2.0 | 1392 | $2,700 | $1.94 | 12d | 2 | 0.89mi |
| 1745 Capri Cir Palm Springs, CA | 2.0 | 2.0 | 1200 | $2,495 | $2.08 | 25d | 1 | 0.90mi |
| 1710 E Sonora Rd Palm Springs, CA | 2.0 | 2.0 | 1391 | $2,800 | $2.01 | 25d | 1 | 0.91mi |
| 722 E San Lorenzo Rd Palm Springs, CA | 3.0 | 1.0–2.0 | 750 | $2,015 | $2.69 | 8d | 3 | 0.94mi |
| 722 E San Lorenzo Rd Unit 02 Palm Springs, CA | 3.0 | 2.0 | 1200 | $2,425 | $2.02 | 4d | 1 | 0.95mi |
| 671 S Riverside Dr Unit 6 Palm Springs, CA | 2.0 | 2.0 | 900 | $1,985 | $2.21 | 25d | 1 | 0.97mi |
| 520 E Murray Canyon Dr Palm Springs, CA | 1.0–3.0 | 2.0–2.5 | 1885 | $2,595 | $1.38 | 0d | 1 | 1.03mi |
| 788 N Riverside Dr Palm Springs, CA | 1.0 | 1.0 | 725 | $1,648 | $2.27 | 44d | 1 | 1.04mi |
| 1111 E Ramon Rd #87 Palm Springs, CA | 3.0 | 2.0 | 1313 | $4,500 | $3.43 | 18d | 1 | 1.21mi |
| 620 S Thornhill Rd Unit 3 Palm Springs, CA | 2.0 | 1.0 | 700 | $1,985 | $2.84 | 25d | 1 | 1.27mi |
| 585 Calle Abronia S Unit B Palm Springs, CA | 1.0 | 1.0 | 750 | $2,100 | $2.80 | 44d | 1 | 1.27mi |
| 583 Calle Abronia S Unit A Palm Springs, CA | 2.0 | 1.0 | 760 | $2,299 | $3.02 | 44d | 1 | 1.28mi |
| 1111 E Ramon Rd Palm Springs, CA | 2.0–3.0 | 2.0 | 1191 | $2,800 | $2.35 | 17d | 2 | 1.38mi |
| 1111 E Ramon Rd Palm Springs, CA | 2.0–3.0 | 2.0 | 1191 | $2,000 | $1.68 | 25d | 2 | 1.38mi |
| 453 Village Square E Palm Springs, CA | 2.0 | 2.0 | 1400 | $3,000 | $2.14 | 17d | 1 | 1.45mi |
| 1050 E Ramon Rd Palm Springs, CA | 2.0 | 2.0 | 1253 | $3,815 | $3.04 | 44d | 2 | 1.45mi |
| 1050 E Ramon Rd Palm Springs, CA | 2.0 | 2.0 | 1135 | $3,264 | $2.88 | 0d | 3 | 1.45mi |
Listing history 23 events
-
2026-06-17status $195,000 Pending 100 DOM
-
2026-06-16days on market $195,000 Backup Offers Accepted 100 DOM
-
2026-06-15days on market $195,000 Backup Offers Accepted 99 DOM
-
2026-06-13days on market $195,000 Backup Offers Accepted 97 DOM
-
2026-06-13days on market $195,000 Backup Offers Accepted 96 DOM
-
2026-06-09days on market $195,000 Backup Offers Accepted 93 DOM
-
2026-06-08days on market $195,000 Backup Offers Accepted 92 DOM
-
2026-06-07days on market $195,000 Backup Offers Accepted 91 DOM
-
2026-06-04days on market $195,000 Backup Offers Accepted 88 DOM
-
2026-06-03statusdays on market $195,000 Backup Offers Accepted 87 DOM
-
2026-06-02days on market $195,000 Active 86 DOM
-
2026-06-01days on market $195,000 Active 85 DOM
-
2026-05-31days on market $195,000 Active 84 DOM
-
2026-03-08$195,000 Active 893-char remark
Show marketing remark (893 chars)
This park is owned by a non-profit corporation in the business of owning mobile home parks. 272 Araby St is located in Sahara Park, a senior community under rent control. Mobile home is a 1967 Goldenwest double wide coach with two bedrooms, two bathrooms, each remodeled in tile, open living room to dining area/office, and vintage kitchen. Laminate flooring installed in 2023. Ceiling fan with light and disappearing blades when not in use, central air and heat, stacking washer and dryer, oven, range and breakfast bar in the kitchen. Front and back covered patios the whole length of the unit with stunning Mountain Views from the front patio. Back yard has a block wall. Park amenities: Pool, spa, clubhouse with card room, TV room, library, full kitchen, stage, meeting room, and electronic bingo board. Exercise room and many park activities. All photos are altered. Current Rent $615.19
-
2025-09-08Active
-
2025-08-01status Active
-
2025-07-13status Active
-
2025-04-19status Active
-
2024-11-09status Active
-
2024-06-07price
-
2024-05-06Active
-
2009-05-03historical
-
2009-04-14$42,000
ⓘ Source: listings_history table (triggers on properties + properties_extension) + one-shot
backfill from property_details.listing_events for pre-trigger history.
Climate risk First Street
- Flood 1/10 Low FEMA zone X · 0% chance over 30 yrs
- Wildfire 5/10 Major
- Heat 9/10 Extreme 9 d/yr ≥110°F today · 26 d/yr by 30 yrs out
- Wind 1/10 Low
- Air quality 5/10 Major 6 unhealthy d/yr today · 8 by 30 yrs out
Nearby sold comps map
Loading sold comps map…
Walkable amenities ~0.75 mi
Loading nearby amenities…
Taxation est. · year 1
- Rental income
- $29,542
- − Mortgage interest
- −$10,923
- − Property taxes
- −$2,925
- − Insurance
- −$975
- − Repairs & maintenance
- −$2,363
- − Management
- −$2,363
- − Depreciation
- −$5,673
- Taxable income
- $4,320
- Est. tax owed @ 24.0%
- −$1,037
- After-tax cash flow
- $6,131/yr
For passive investors: Depreciation is non-cash, so a rental often shows a tax loss while cash-flowing — sheltering income. Rental losses are passive: they offset passive income freely, and up to $25,000/yr can offset ordinary (W-2) income if you actively participate and your MAGI is under $100k (phasing out to $0 by $150k); unused losses carry forward. On sale, claimed depreciation is recaptured at up to 25%, and gains may owe capital-gains tax (a 1031 exchange can defer both). Figures are a year-1 estimate at your 24.0% rate — not tax advice; consult a CPA.
Schools (NCES district)
- District
- Palm Springs Unified
- NCES district ID
- 0629550
- Math proficiency
- 21% ▼ -7.00%
- Reading proficiency
- 42% ▬ 0.00%
- Median HH income
- $43,638
- Composite
- 26.76/100
- National rank
- #7131
- State rank
- #328 of 517 in CA
Livability — Palm Springs
- Score
- 66/100
- State rank
- #348
- US rank
- #11850
Category grades
Schools grade is shown separately in the Schools card above.
Census & demographics
- Census place
- Palm Springs, CA
- County
- Riverside County · 2,287,001 people
- City population
- 46,786
- Metro
- Riverside-San Bernardino-Ontario, CA
- Population (ZIP)
- 19,899
- Household income
- $77,688
- Rent vs Own
- Severe rent burden
- 1215.0
Population outlook (Riverside County) Hauer SSP2
- Today (2025)
- 2,664,475 people
- By 2030
- 2,802,692 · +5.2%
- By 2040
- 3,050,904 · +14.5%
- By 2050
- 3,256,783 · +22.2%
- By 2075
- 3,655,058 · +37.2%
- By 2100
- 3,766,594 · +41.4%
Race, ethnicity, and origin ACS 2023
- Neighborhood character
- Predominantly White (68%)
- Race & ethnicity
- White 68% Hispanic / Latino 20% Two or more races 12% Asian 6% Black 2% Native American 1%
- Hispanic origin (detail)
- Mexican 16%
- Common ancestry
- Lithuanian 4% Romanian 3% Slovak 3%
- Foreign-born
- 16% · Canada, China, South Korea
- Languages at home
- 81% English-only · Spanish 13% Tagalog/Filipino 2% Other Asian/Pacific 1%
Political lean MEDSL · Riverside
- 2024 margin
- Toss-up / Even · D 48.0% · R 49.3% · Other 2.6%
- 2008→2024 swing
- -3.6pp toward R · 2008: 2.3pp · 2024: -1.3pp
- All cycles
- 2024: R+1.3 2020: D+8.0 2016: D+4.3 2012: R+0.4 2008: D+2.3
Not yet ingested
- Civics
- —
Market trends
- HPI YoY
- ▼ -489.04%
- Current HPI
- 357.0969
- Rent YoY
- ▼ -0.43%
- Metro
- Riverside-San Bernardino-Ontario, CA
- State GDP YoY
- ▲ 3.21%
- F500 in state
- 116
Industry mix (Fortune 500 HQ in CA)
| Industry | F500 HQs | Revenue |
|---|---|---|
| Technology | 27 | $1,492B |
|
||
| Financial Services | 3 | $174B |
|
||
| Retail | 3 | $44B |
|
||
| Insurance | 3 | $26B |
|
||
| Media / Entertainment | 2 | $115B |
|
||
| Pharmaceuticals / Biotech | 2 | $62B |
|
||
Price history
+364.3% since first listed10 events — show timeline
- 2026-03-08 Listed $195,000 TheMLS
- 2025-09-08 Listed — TheMLS
- 2025-08-01 Relisted — TheMLS
- 2025-07-13 Relisted — TheMLS
- 2025-04-19 Relisted — TheMLS
- 2024-11-09 Relisted — TheMLS
- 2024-06-07 Price Changed — TheMLS
- 2024-05-06 Listed — TheMLS
- 2009-05-03 Listing Removed — GPSMLS
- 2009-04-14 Listed $42,000 GPSMLS
Cash-flow waterfall
monthlySold comps — $/sqft
last 12 mo · ≤1 miLoading sold comps…