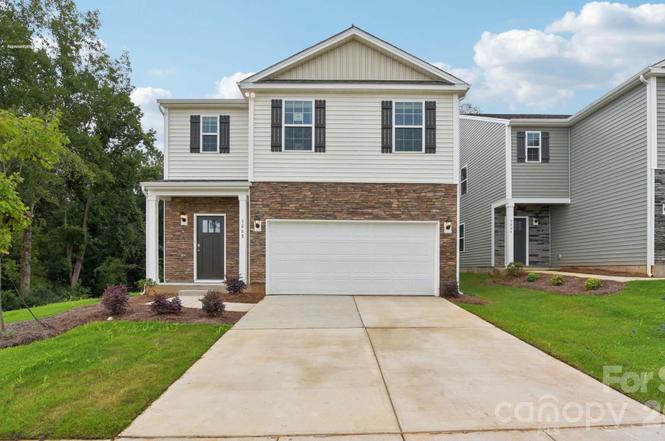
1133 Saloon Dr · York, SC
Flood risk No data
- FEMA flood zone
- —
- Chance of flooding over 30 yrs
- —
- Est. flood insurance / yr
- —
Fire risk No data
- Est. fire insurance / yr
- —
Heat risk No data
- Hot days now (above threshold)
- —
- Hot days in 30 yrs
- —
Wind risk No data
- Chance of severe wind over 30 yrs
- —
Air-quality risk No data
- Unhealthy air days now
- —
- Unhealthy air days in 30 yrs
- —
Risk factors via First Street. Map © Google.
Why this score? — see what drove the F grade
The composite is a weighted blend of 9 inputs, each scored 0–100. Each bar is that input's sub-score; the figure is the points it added to the 100-point composite (weight × sub-score).
- Cash flow +8.3/30.0
- ARV discount +7.5/15.0
- Livability +3.2/5.0
- Schools +3.0/10.0
- Rent growth +2.5/5.0
- Condition / age +2.5/5.0
- DSCR +2.3/10.0
- 1% rule +2.0/10.0
- Appreciation +0.0/10.0
$350,000
🖨 Deal sheet 📄 Offer letter ✓ Due diligence
Listing remarks
Come tour 1133 Saloon Drive!! The Robie is one of our two-story plans featured at Fergus Crossing in York, SC. This home offers five bedrooms, three bathrooms, and a two-car garage. Upon entering the home, you’ll be greeted by a foyer which invites you in the center of the home. At the heart of the home is a spacious living room and dining room that blends with the kitchen, creating an airy feel. The chef’s kitchen is equipped with modern appliances, ample cabinet space, walk-in pantry, and breakfast bar, perfect for cooking and casual dining. Adjacent to the kitchen is a bedroom, providing privacy and comfort. The home features a primary suite, complete with a walk-in closet
Key facts
- En suite bathroom
- Walk-in closet
- Primary suite
Tags
Property features AI
Finance
- Other: Living area listed as 2,368 total heated square feet; Additional 340 sq ft other area
- HOA & community: HOA present and mandatory; Quarterly HOA fee; Association fee is $307 quarterly
Exterior
- Parking: Two-car garage with garage door opener; Driveway; Main-level garage
- Security: Smoke detectors; Carbon monoxide detectors
- Utilities: City water; Public sewer; Cable available; Fiber optic service available
- Home design: Single-family residence; Site-built construction; Two levels; Under construction / new construction
- Construction: Fiber cement exterior; Slab foundation; Builder: D.R. Horton; Model: Robie - J; Proposed completion: 2026-05-18
- Exterior features: Concrete road access; Road dedicated to public use pending acceptance; Community amenities include outdoor pool, cabana, playground, picnic area, game court, tennis courts, walking trails, sidewalks, street lights, and recreation area
Interior
- Kitchen: Dishwasher; Electric range; Microwave; Walk-in pantry
- Bedrooms: Five bedrooms total — four upstairs and one on the main level
- Flooring: Carpet; Vinyl
- Bathrooms: Three full bathrooms (two upstairs, one on the main level)
- Heating & cooling: Electric heating; Heat pump; Central air; Zoned cooling
- Interior features: Open floorplan; Garden tub; Walk-in pantry; Insulated windows; 11 total rooms
- Laundry & utility: Washer hookup; Electric dryer hookup; Laundry area located on the upper level
Neighborhood map
What this means for you Summary
Snapshot
- This is a 5-bed/3.0-bath land listed at $350k.
Deal economics
- At list price, monthly cash flow is $-320 ($-4k/yr) — negative.
- To cash-flow at today's rent, offer at most $293k (16.1% below list).
- To meet the 1% rule (rent ≥ 1% of price), the offer needs to be $245k (30.0% below list).
- Recommended offer: $245k (30.0% below list) — sets the bar for 1% rule.
Location & tenants
- Location reads 65/100 on livability (#139 in SC) — a middle-class / working-renter tenant base. Strengths: cost of living A+, housing A+, health & safety A+; Watch: crime F, amenities F, commute F.
- York 01 (rural): math 31% / reading 40% proficiency, ranked #41 of 80 in SC (top 51%) — families likely to look elsewhere, expect single-tenant / working-renter base with shorter leases.
- Zoned schools: Hunter Street Elementary (math 52% / reading 47%, grade D, #168 of 597 statewide, top 31%, 405 students, 74% FRL); York Comprehensive High (math 39% / reading 82%, grade C+, #108 of 196 statewide, top 55%, 1,493 students, 68% FRL) — zoned schools average 71% FRL vs 54% district-wide (17 pts higher); higher-poverty schools than district average — tighter screening recommended.
- Zoned-school proficiency averages 55% at this address vs 36% district-wide (+20 pts) — the actual schools serving this property are materially stronger than the York 01 average implies; a family-tenant draw the district grade alone would hide.
- Market conditions: 541 active listings in the ZIP; solid renter incomes; 2,550 units permitted in York County in 2024 (350 in 5+ unit buildings).
- This rent runs 37% of the median local income ($79k/yr) — at the standard rent-burdened threshold; future hikes will face affordability resistance.
Forward outlook
- Local home prices are declining (-3.0%/yr); year-one equity from $2k of loan paydown is wiped out by about $10k of value loss. Plan a longer hold.
- York County population projected at +44% by 2050 — long-run rental-demand tailwind backs the buy-and-hold thesis.
Negotiation context
- It's been on market 83 days — a 6% lower offer ($329k) is reasonable based on typical stale-listing flexibility.
Questions for the listing agent
- What do current leases actually rent for vs. the listed asking? Can we see a recent rent roll and the last 12 months of T-12 income?
- It's been on market 83 days. Have you received any prior offers? Is the seller open to a 30% concession, seller financing, or rate buy-down credit?
- What does the HOA fee cover, when was the last increase, and are there any pending special assessments or reserve-fund shortfalls?
- Why hasn't it sold? Are there any deal-killer items the seller is aware of (foundation, flood, title, zoning, code violations)?
- Is there a deadline driving the sale (1031 exchange, divorce, estate, relocation)? That informs how much negotiation room exists.
- Schools are D-rated, which usually means shorter tenancies and higher turnover. Who's the typical renter profile here, and what's been the actual vacancy rate?
- Crime grade is F in this area — have there been break-ins, vandalism, or insurance claims at this property in the last 3 years? What carrier currently insures it and at what premium?
- The area grade is low — what's the realistic commute time and amenity access for the typical tenant pool here? Any planned neighborhood developments (good or bad) we should know about?
- What's the average days-on-market for RENTAL listings here right now (not sales)? A rising rental-DOM trend means longer vacancies and softer asking-rent achievability than the comps imply.
- What's the recent tenant-quality profile in this submarket — average credit score on applications, eviction rate, late-payment / NSF rate, and stable-employment percentage? A property-management company in the area should have these aggregated.
- How much new for-sale + rental construction is in the pipeline within 1–3 miles? Heavy new supply typically softens prices + rents 12–24 months out; constrained supply supports both.
Investment metrics
- 1% rule
- 0.70% ✗
- Cap rate
- 5.20%
- Cash-on-cash
- -3.92%
- DSCR
- 0.83
- GRM
- 11.9
CMA / ARV
No comps found within radius.
Projected returns pro-forma
-3.0% appreciation · 3.0% rent growth · sell at horizon
- IRR
- -22.9%
- Equity multiple
- 0.21×
- Total profit
- $-77,157
- Equity at exit
- $52,186
- IRR
- -17.4%
- Equity multiple
- 0.04×
- Total profit
- $-93,682
- Equity at exit
- $30,262
Cash invested: $98,000 (down + closing). Projections, not guarantees.
Landlord ↔ Tenant lean methodology
- Overall (STATE)
- 90 Strongly Landlord-Friendly
- State South Carolina
- 90 Strongly Landlord-Friendly · R+6
- County
- — inherits STATE
- City
- — inherits STATE
ZIP-level market 29745
- Home prices YoY
- -30.3%
- Active inventory
- 541
- Price-to-rent
- 11.9×
Monthly cashflow live
- Estimated rent
- $2,452 medium interval (Pro) →
- Mortgage (P&I)
- −$1,835
- Tax from tax record
- −$173 /mo · $2,081/yr
- Insurance
- −$146
- HOA
- −$102
- Vacancy / Maint / Mgmt
- −$515
- Net cashflow
- $-320
Break-even live
UW: 25.0% down · 7.5% · 30yr · 1.5% tax · 5.0% vac · 8.0% maint · 8.0% mgmt
Financing live
Cash to close
- Down payment
- $87,500
- Closing costs
- $10,500
- Reserves months
- —
- Total cash needed
- —
Loan-product check · same deal, 3 products live
Conventional
25% down · 7.5% · 30yr
- Down + closing
- —
- Monthly P&I
- —
- Monthly cashflow
- —
- DSCR
- —
- Eligible?
- —
Personal DTI + credit; lowest rate.
DSCR
20% down · 8.5% · 30yr
- Down + closing
- —
- Monthly P&I
- —
- Monthly cashflow
- —
- DSCR
- —
- Eligible?
- —
No personal income docs; deal must DSCR.
Hard money
10% down · 12.0% · 12mo
- Down + closing
- —
- Monthly P&I
- —
- Monthly cashflow
- —
- DSCR
- —
- Eligible?
- —
Short-term bridge; refi at stabilization.
HOA detail
- Monthly dues
- $102 · $1,224/yr
Listing history 5 events
-
2026-05-11status Pending
-
2026-04-07price $350,000
-
2026-03-17price $359,000
-
2026-02-17$384,490 Active
-
2025-07-02soldstatus $3,030,240
ⓘ Source: listings_history table (triggers on properties + properties_extension) + one-shot
backfill from property_details.listing_events for pre-trigger history.
Tax reassessment forecast SC · Resets to sale price
- Current annual tax
- $2,081 · $173/mo
- Projected year-2 tax
- $2,081 · $173/mo
- Expected delta
- $0/yr ($0/mo · 0.0%)
ⓘ Screening estimate from a state-policy table — verify with the county assessor before closing.
Nearby sold comps map
Loading sold comps map…
Walkable amenities ~0.75 mi
Loading nearby amenities…
Taxation est. · year 1
- Rental income
- $29,419
- − Mortgage interest
- −$19,605
- − Property taxes
- −$2,081
- − Insurance
- −$1,750
- − Repairs & maintenance
- −$2,354
- − Management
- −$2,354
- − HOA
- −$1,224
- − Depreciation
- −$10,182
- Taxable loss
- −$10,131
- Est. tax savings @ 24.0%
- +$2,431
- After-tax cash flow
- $-1,408/yr
For passive investors: Depreciation is non-cash, so a rental often shows a tax loss while cash-flowing — sheltering income. Rental losses are passive: they offset passive income freely, and up to $25,000/yr can offset ordinary (W-2) income if you actively participate and your MAGI is under $100k (phasing out to $0 by $150k); unused losses carry forward. On sale, claimed depreciation is recaptured at up to 25%, and gains may owe capital-gains tax (a 1031 exchange can defer both). Figures are a year-1 estimate at your 24.0% rate — not tax advice; consult a CPA.
Schools (NCES district)
- District
- York 01
- NCES district ID
- 4503810
- Math proficiency
- 31% ▼ -16.00%
- Reading proficiency
- 40% ▬ 0.00%
- Median HH income
- $44,491
- Composite
- 30.21/100
- National rank
- #6305
- State rank
- #41 of 80 in SC
Livability — York
- Score
- 65/100
- State rank
- #139
- US rank
- #13425
Category grades
Schools grade is shown separately in the Schools card above.
Census & demographics
- Census place
- York, SC
- County
- York County · 281,758 people
- City population
- 34,909
- Metro
- Charlotte-Concord-Gastonia, NC-SC
- Population (ZIP)
- 34,909
- Household income
- $79,117
- Rent vs Own
- Severe rent burden
- 321.0
Population outlook (York County) Hauer SSP2
- Today (2025)
- 307,757 people
- By 2030
- 335,979 · +9.2%
- By 2040
- 391,378 · +27.2%
- By 2050
- 443,234 · +44.0%
- By 2075
- 557,102 · +81.0%
- By 2100
- 625,837 · +103.4%
Race, ethnicity, and origin ACS 2023
- Neighborhood character
- Predominantly White (75%)
- Race & ethnicity
- White 75% Black 12% Two or more races 6% Hispanic / Latino 6% Asian 1%
- Hispanic origin (detail)
- Mexican 4%
- Common ancestry
- Romanian 3% Serbian 3% Italian 2%
- Foreign-born
- 4% · Canada
- Languages at home
- 94% English-only · Spanish 4%
Political lean MEDSL · York
- 2024 margin
- R (+19.1) · D 39.7% · R 58.8% · Other 1.5%
- 2008→2024 swing
- -1.4pp toward R · 2008: -17.7pp · 2024: -19.1pp
- All cycles
- 2024: R+19.1 2020: R+16.5 2016: R+22.1 2012: R+20.5 2008: R+17.7
Not yet ingested
- Civics
- —
Market trends
- HPI YoY
- ▼ -109.42%
- Current HPI
- 251.6848
- Rent YoY
- —
- Metro
- Charlotte-Concord-Gastonia, NC-SC
- State GDP YoY
- ▲ 4.51%
- F500 in state
- 2
Industry mix (Fortune 500 HQ in SC)
| Industry | F500 HQs | Revenue |
|---|---|---|
| Packaging | 1 | $7B |
|
||
Price history
-88.4% since first listed5 events — show timeline
- 2026-05-11 Pending — CANOPYMLS as Distributed by MLS Grid
- 2026-04-07 Price Changed $350,000 CANOPYMLS as Distributed by MLS Grid
- 2026-03-17 Price Changed $359,000 CANOPYMLS as Distributed by MLS Grid
- 2026-02-17 Listed $384,490 CANOPYMLS as Distributed by MLS Grid
- 2025-07-02 Sold (Public Records) $3,030,240 Public Records
Cash-flow waterfall
monthlySold comps — $/sqft
last 12 mo · ≤1 miLoading sold comps…